All Activity
- Past hour
-
2026 Mid-Atlantic Severe Storm General Discussion
high risk replied to Kmlwx's topic in Mid Atlantic
The rare Day 7 SPC outlook for our area!- 998 replies
-
- 1
-

-
- severe
- thunderstorms
- (and 7 more)
-
 That could tell us something about the reality of the urgency/risk to actual people. First, there's the "facade" of crisis, then ... we have to pay to find out how it will harm us? Riiiight - What ...? so let's venture a scenario. Suppose the Canary Islands over there SSE of the Azores go on ahead a bifurcate in a geological event that sldes the western slope of the trillion trillion trillion ton volcanic shield's mass into the Atlantic depths ... sending enough wave energy to surge up a 1,000 foot high tsunamis into the eastern seaboard of America. Media-sphere holds back, unless we spend 2.99 on a paywall site to find out what's going on. Another 4 bucks for the premium service of finding out how one can save their ass or die. That's right ... 4 bucks or you die! It's tacky at best. I mean that's obviously a fictional/exaggerated depiction there but it takes elaboration of circumstance to brightly identify the point. If it is really harmful, the ethical thing to do is tone down the rhetoric and up the expediency of useful/vital information -
 -
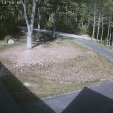 Lawns are going to be toast by next wknd. Sent from my SM-S921U using Tapatalk
 -
 June is a convenient cutoff considering May 2025 was 8.05”. But I get it, I want more rain too. PVD Historical Averages and monthly totals May 25 3.38” 8.05” +4.67” Jun 25 3.25” 1.15” -2.10” Jul 25 3.18” 5.08” +1.90” Aug 25 3.64” 2.76” -0.88” Sep 25 3.60” 6.24” +2.64” Oct 25 3.47” 4.80” +1.33” Nov 25 3.88” 2.56” -1.32” Dec 25 4.09 2.37” -1.72” Jan 26 3.82” 3.08” -0.74” Feb 26 3.32” 2.84” -0.48” Mar 26 4.16” 5.57” +1.41” Apr 26 3.86” 1.89” -1.97” May 26 3.38” 2.01” -1.37” Jun 26 3.25” 2.38” -0.87” Plus did they underreport liquid equiv in the big snowstorms this year? Spring has been dry, but where is the longterm 13” deficit?
 - Today
-
I remember that! I was only 6 lol. Crazy rates. Best rates I've ever seen were Jan 25, 2000, February 2010, and by far the most insane was last January in the town of Pulaski and Lacona NY. 6-8" per hour is just different. It's like twilight zone. You can literally watch it accumulating like a time lapse video.
-

Occasional Thoughts on Climate Change
donsutherland1 replied to donsutherland1's topic in Climate Change
I strongly agree. This chart that purports to represent rural U.S. temperatures is badly flawed. I'm not surprised that there is no attribution or full inventory of stations and the years for which their data was used. However, upon further research, it seems to have originated at the Electroverse climate change denial site. The chart relies on a changing station sample, extreme geographic undercoverage (n=6) in the early period, and equal weighting of unevenly distributed stations. The combination of absolute temperature averaging and changing station composition is a fatal flaw. To illustrate the absurdity of the impact of a changing station mix. Let's say one had a mix of just Charleston and New Haven in 2025. The annual average mean for those two stations (not representative of the U.S., but that's a separate issue) would have been 60.6°. Now, if one added Casper into the mix, the new three-station average would fall sharply to 56.2°. Simply adding or removing stations has an artificial impact on the temperature average. This chart elevates the art of "cherrypicking" to new heights. -
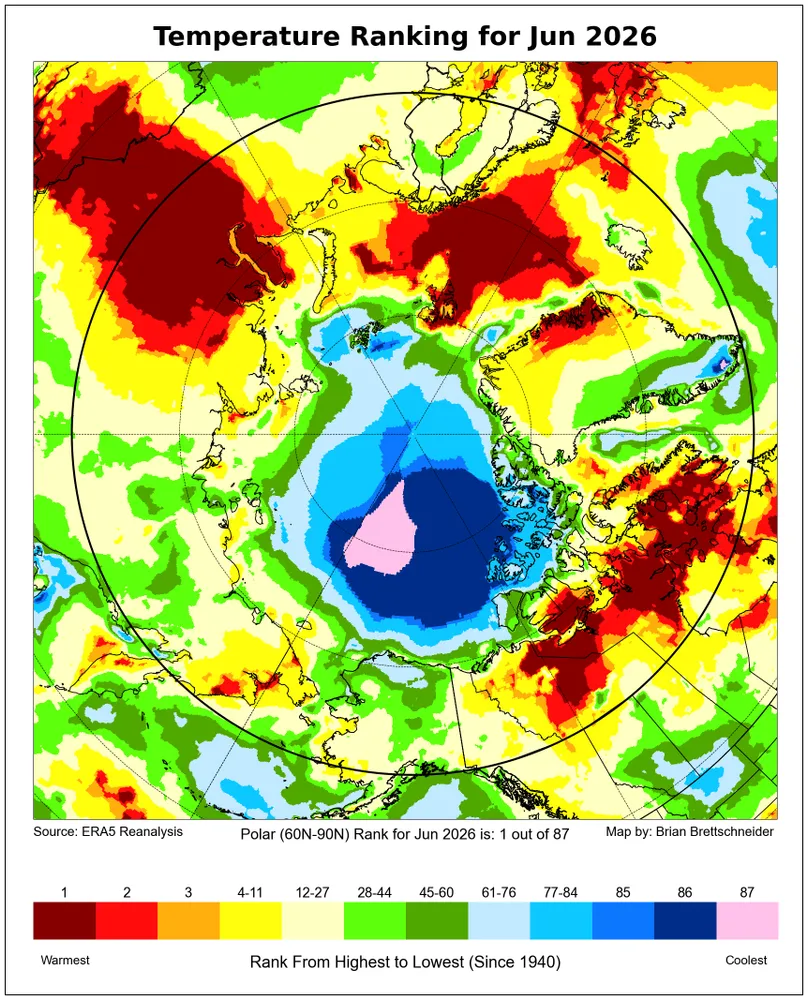
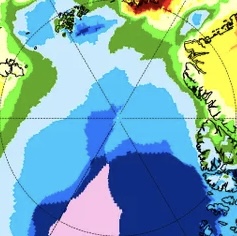
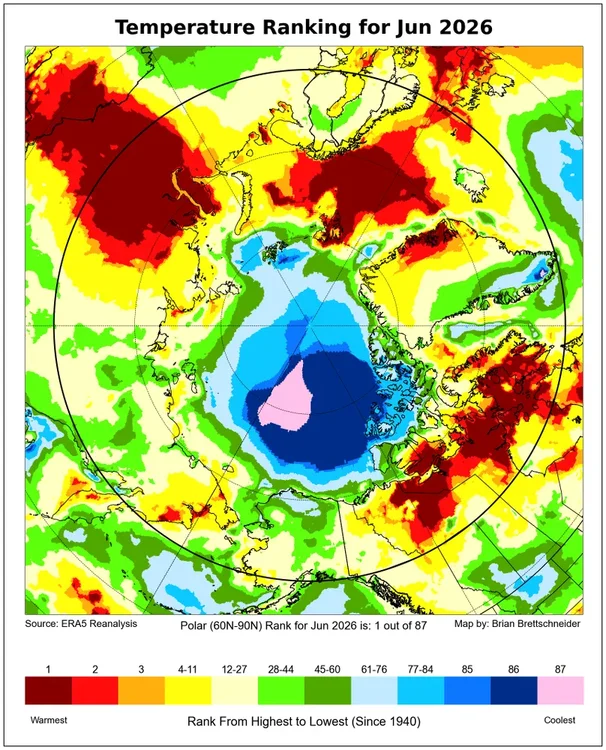
But for just 80N+, it is quite cold overall! Below is a closeup of just the 80N+ portion showing that overall it’s quite cold: 1. only ~1/7 is in warmest 1/2 of years vs ~6/7 in coldest 1/2 2. -a little >50% is in 4 coldest colors meaning coldest 11 of 87 -but only ~6% is in warmest 11, which is <1/8 the size of coldest 11 3. -~25% is in coldest 3 of 87 -but only ~1% is in warmest 3 of 87, which is a mere 1/25 of the size of coldest 3
-
.11" rain yesterday and .85" for the week. Green grass abounds.
-

2026-2027 Super El Nino
snowman19 replied to Stormchaserchuck1's topic in Weather Forecasting and Discussion
I’m starting to think the CFS isn’t overdone with the peak anymore. The way this is going, a traditional ONI peak of +4C and a RONI peak of +3.5C would not surprise me. I also think we have an MEI of +2 come August based on how strong the ocean-atmosphere coupling (Bjerknes feedback) is becoming Every model has a monster come November/December -
This is the actual ERA 5 temperature map which produced the climate record for June 2026. The Pacific Arctic area to the north of Alaska did have its coldest June since the 1940s as I mentioned in my first post. But you can see how the total area from 80N to 90N had zones closest to the warmest on record on the Atlantic side. So the actual rank of the high Arctic wasn’t the coldest on record. Since the totality of the Arctic north of 60N had the warmest June on record. Even the less reliable ECWMF only starts in 2002, so an apples to apples comparison to any year earlier than 2002 can’t be made. This is why we use Era 5 for comparison to times since the 1940s.
-

Mid-Long Range Discussion 2026
WinstonSalemArlington replied to BooneWX's topic in Southeastern States
-
Notice that Charleston SC and New Haven, CT are "rural" stations. There were large reverse heat island effects at 2 of the COOP stations in "rural" Chester County. Bottom-line US historical weather data is very inconsistent. It needs to be carefully analyzed not cherry-picked.
-

2026-2027 Super El Nino
bluewave replied to Stormchaserchuck1's topic in Weather Forecasting and Discussion
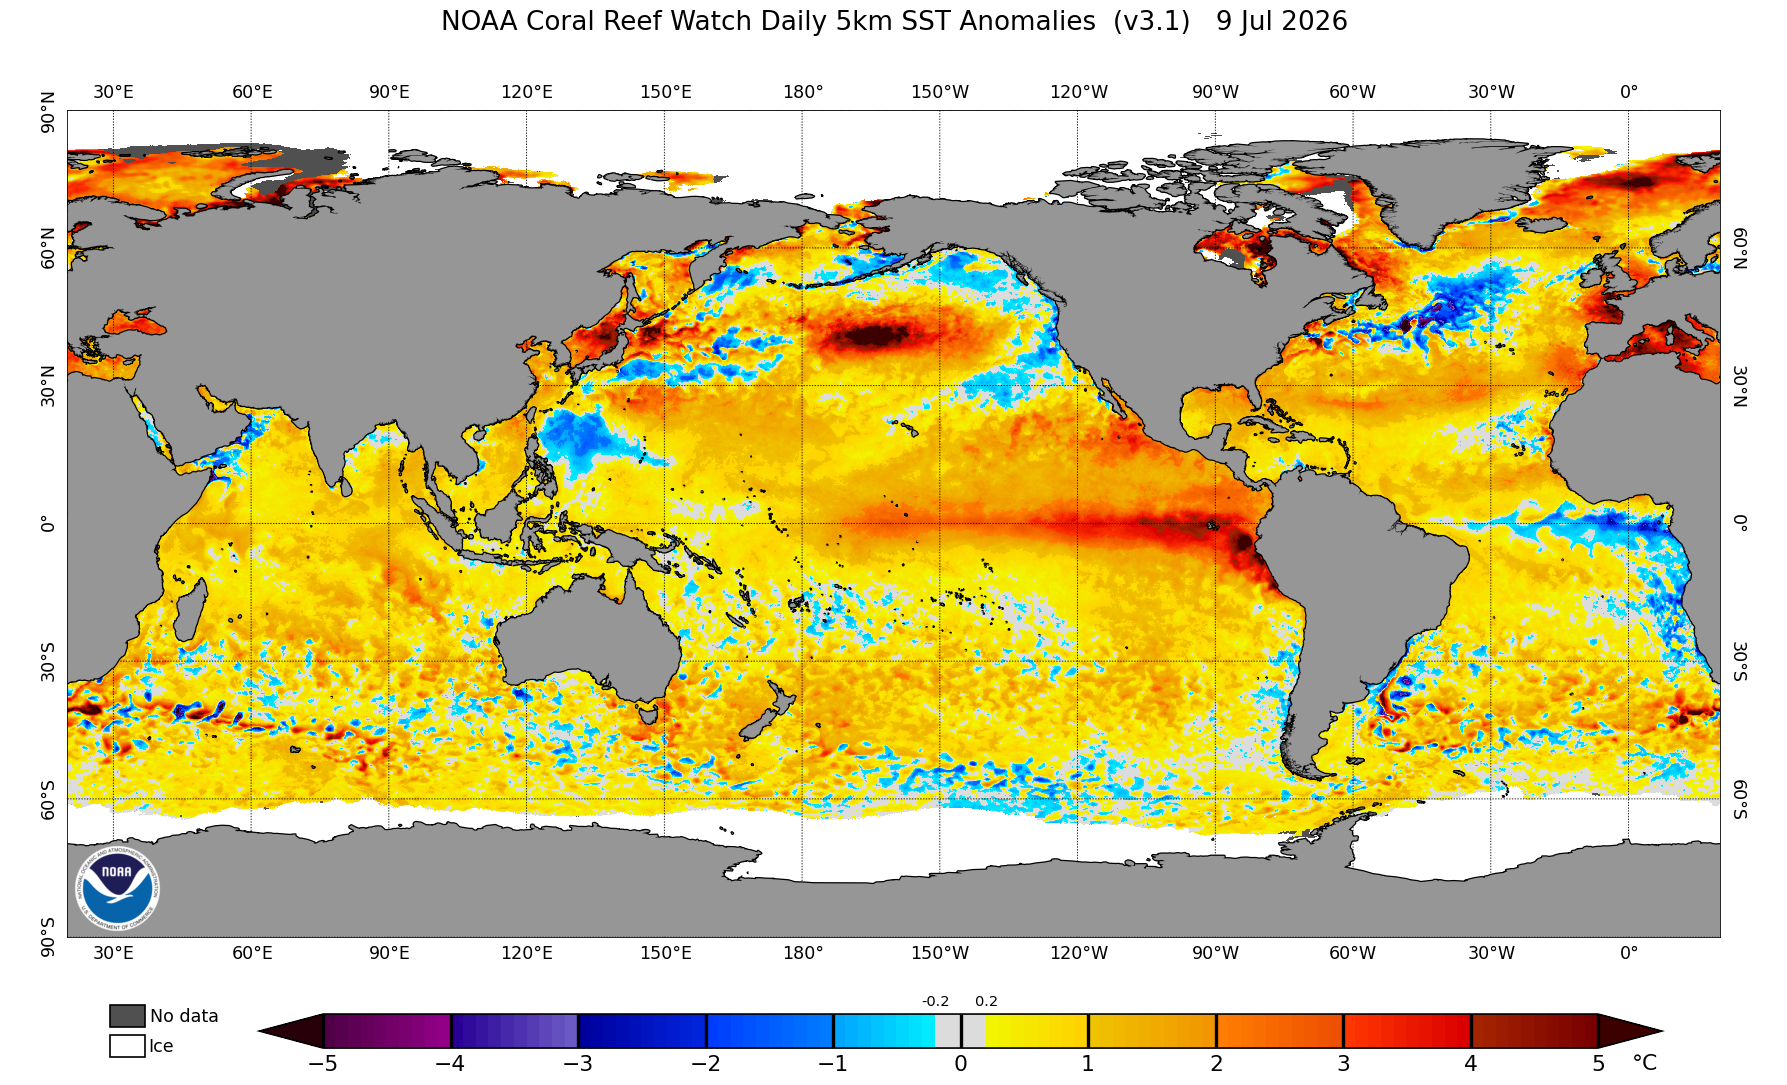
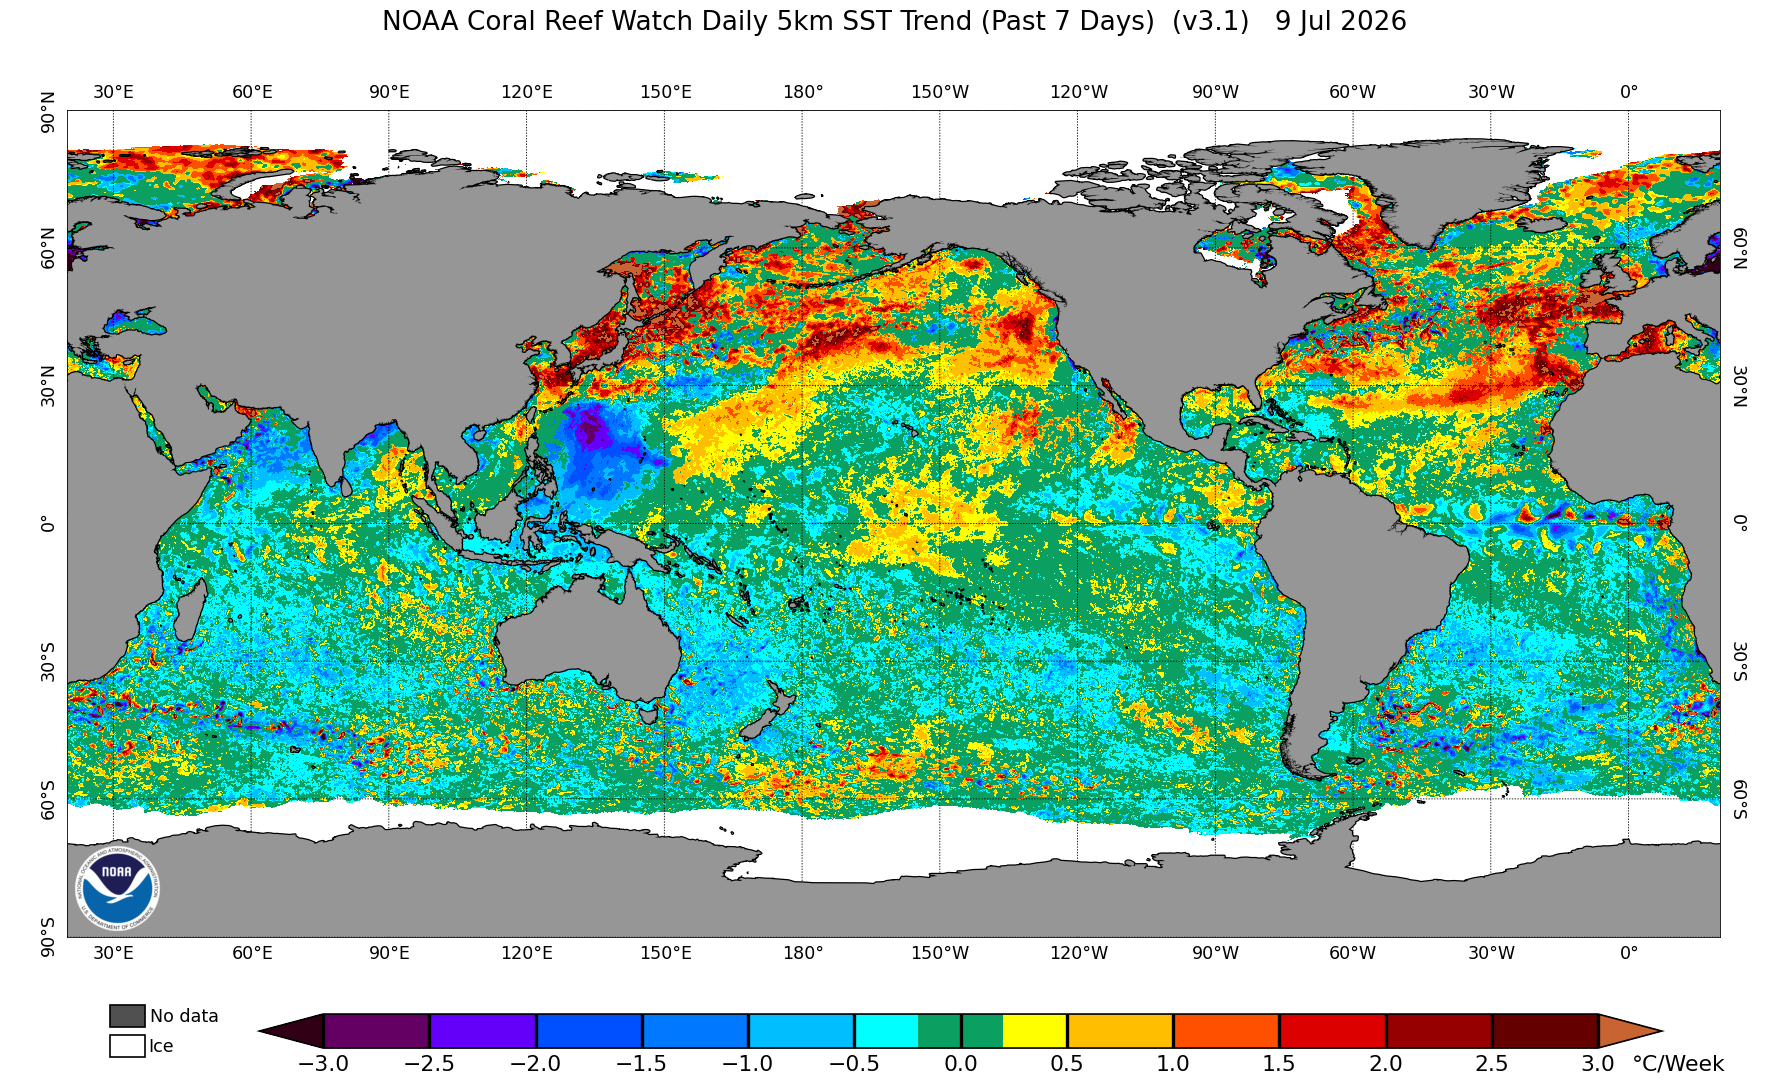
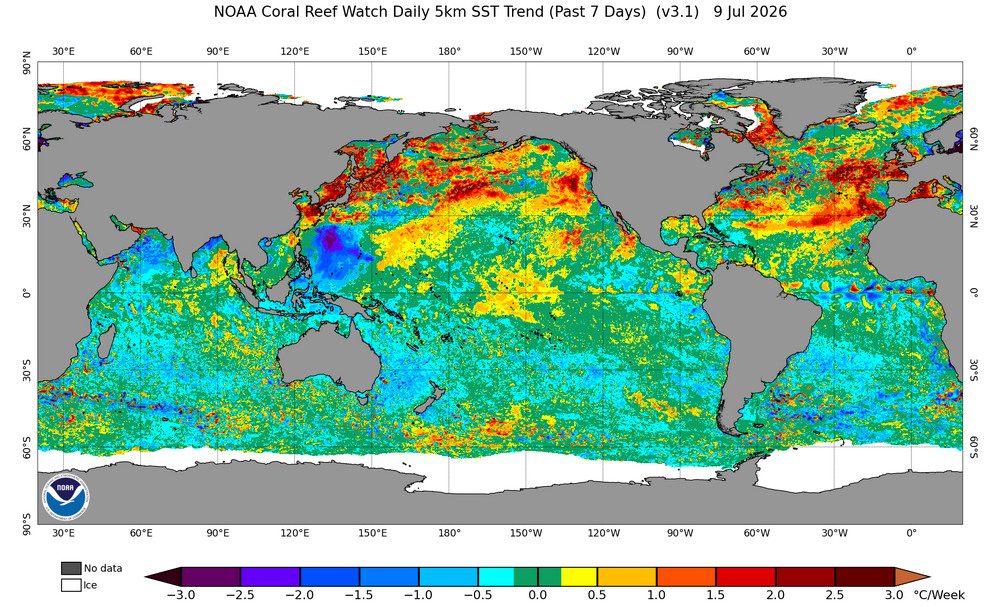
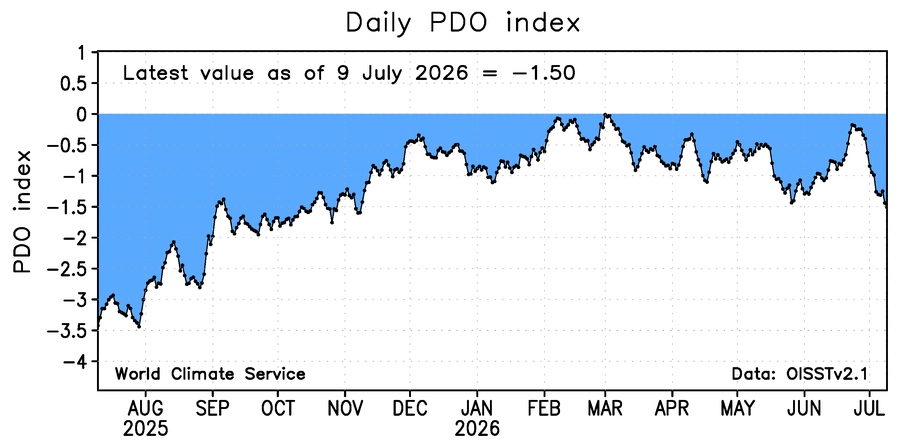
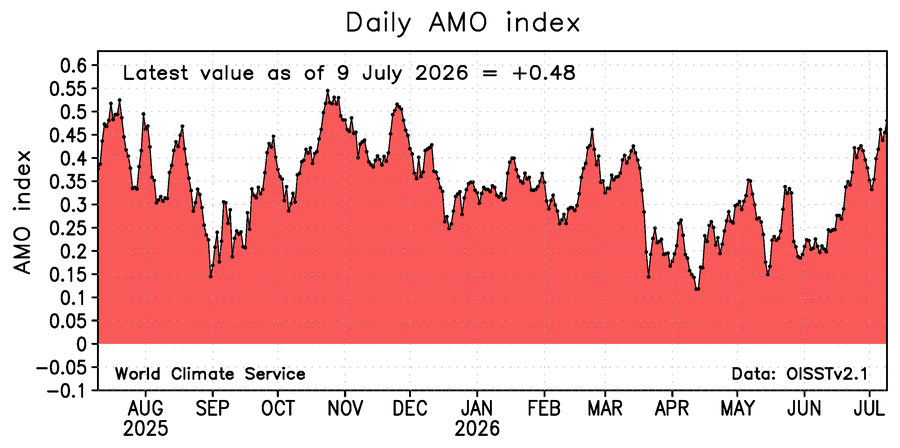
The shifted nature of the ridges further south than usual over the CONUS is probably related to the persistent marine heatwave and 500 mb pattern from Japan to north of Hawaii driving the -PDO and contributing to the +AMO. A recent study found that this process is operating independently from the El Nino. So this more La Nina background pattern is overlapping with the developing super El Nino. If this interaction continues into the winter, then the El Nino ridge axis normally south of Hudson Bay could be located further south than usual. We’ll just have to see how the pattern evolves moving into the winter. https://www.science.org/doi/10.1126/sciadv.adz4647 Marine heatwaves in the Northwestern Pacific (NWP) have become increasingly frequent and persistent, yet the mechanisms enabling their multiseasonal duration remain poorly understood. Through observational analyses and climate model experiments, we demonstrate that NWP marine heatwaves are primarily driven by a quasistationary wavenumber 5 circumglobal wave (CGW) pattern that operates independently of El Niño–Southern Oscillation. The CGW modulates surface heat fluxes during summer, triggering a self-reinforcing feedback loop where NWP warming intensifies the CGW pattern, amplifying and prolonging heatwaves across extended warm seasons. Additionally, CGW-driven summer warming in the northern North Atlantic persists into winter through oceanic thermal inertia, exciting a great-circle wave pattern that propagates back to the NWP, sustaining heatwaves through cold seasons. This interplay between atmospheric waves and trans-basin interactions enables multiyear marine heatwave events. Analysis of observational data and climate model simulations reveals a strengthening CGW influence in recent decades, indicating more frequent and prolonged NWP marine heatwaves under ongoing global warming.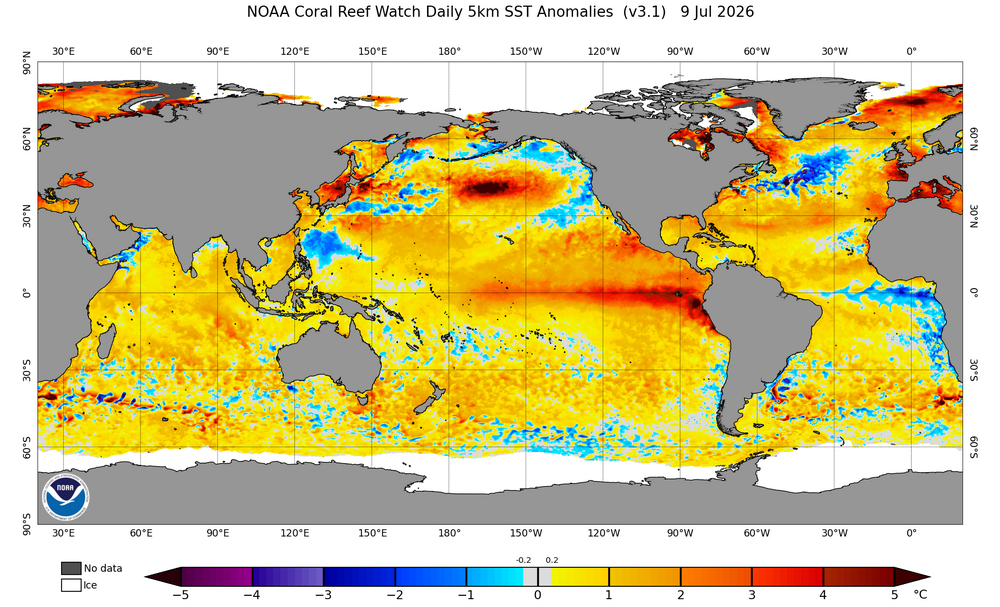
-
Yeah I lived in Takoma Park then it was an intense storm
-
Euro dry af over n il, summer doldrums incoming
-
Looks low end
-
Nice
-
 Noticed last week around Narragansett RI they had water ban signs up all over town. They also had all the beach showers and water turned off. I think Narragansett uses groundwater wells and they are exceptionally low. The Providence Journal just published an article yesterday but its paywalled. Here is the headline. To understand why Gov. Dan McKee, in June, declared a drought watch for only the second time in Rhode Island in 24 years, you need only look at the precipitation numbers over the last 12 months. In nearly every month since June 2025, the state has fallen short of the historical average, leading to a cumulative deficit of 13.4 inches for the year and a total that’s at only 80% of where it should be.
 -
Overall a big model bust on rain today. MRX new afd seems pretty skeptical of the heavy rain delivering Saturday as well, which leads them to doubt flooding. Models are handling everything very poorly, which has been a theme all spring and summer.
-
Yeah, there definitely was some positive feedback over Lake Erie that night with the convection helping to develop a mesolow, which in turn then kept the convection relatively stationary and intense.
-
Central Park was 85, not sure where the 82 came from.
-
Today's Highs: LGA: 89 JFK: 88 EWR: 87 TEB: 87 PHL: 87 BLM: 86 New Brnswck: 86 TTN: 86 ACY: 86 ISP: 85 NYC: 82
-

In The Eye of the Storm: Chasers
Coach McGuirk replied to Coach McGuirk's topic in Weather Forecasting and Discussion
Some of these tornado videos are beautiful. They kept saying a stove top tornado could be an EF-5. I'm like no it's not. Turned out to be an EF-3 165 MPH winds. -
Doesn't sound like nearly as hot as they were hyping a few days ago though.
-
In The Eye of the Storm: Chasers
Coach McGuirk replied to Coach McGuirk's topic in Weather Forecasting and Discussion
I also love how everyone has to say, "we're doing this to save lives." No, you're tornado junkies.