

ORH_wxman
-
Posts
90,902 -
Joined
-
Last visited
2 Followers

About ORH_wxman

- Birthday 07/14/1981
-
That’s quite the ratio for mid April and a min temp of 32F….34” on 1.25 of liquid that one day. Wonder if they left the core boiling over the fire too long, lol
-
Yeah kind of a positive spring bust of yore…interestingly, guidance was generally more aggressive earlier in the overnight period but that part kind of failed. But then we got that blob of monster omega around 5am and things went gangbusters for roughly 2-3 hours and that’s when 90% of the accumulation happened.
-
Yeah Ashburnham had 9” so top of Watatic likely broke double digits.
-
Jackpot was right along the eastern spine of ORH hills. Ashburnham down to Princeton to Holden, Paxton/Leicester (and adjacent far W and N ORH city proper). Pretty consistent 6-9” totals.
-
I’d bet top of WaWa had 10+….best was slightly south of you too.
-
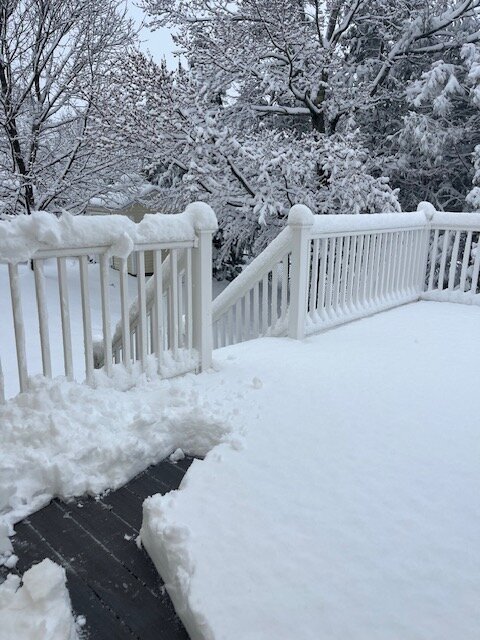
One more deck pic
-
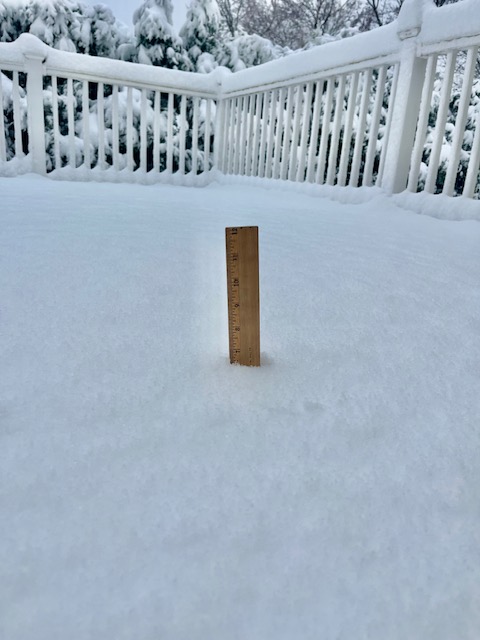
Over 6” on winter hill
-
Marginal there...but very real chance of advisory snows. I'd still prob lean conservative (1-2" of slushy snow) but if we can go to poundtown for about 5-6 hours, then all bets are off. Lot of short term model disagreement on precip intensity and how long the good stuff lasts.
-
Might come out of hibernation just for tonight. Was texting with some folks, but powerfreak posted above....there's a pretty big difference betweeen different sets of guidance on the precip shield and it makes a huge difference. NAM is kind of flaccid with rates over central areas for much of the overnight period while HRRR/RAP/RGEM just hammer Kevin's hood and especially crush ORH county.
-
New England Winter 2024-25 Bantering, Whining, and Sobbing Thread
ORH_wxman replied to klw's topic in New England
@dendrite, finally noticed the ORH ASOS got fixed. Only took 5 years.
-
Yep. Not biting unless other guidance latches on…but particularly the euro. GGEM and Ukie can do what they want but if GFS/Euro start agreeing then it’s a legit threat.
-
Yep. esp in March....you get a lot more convection down south this month and things don't always play quite as "smoothly" on guidance as it does in the heart of winter. Still obviously maintaining a lot of skepticism on a big event, but I'm not dismissing it with this much lead time.
-
We got one last year in January I think.
-
Yeah that’s almost a juiced-look version of a Feb 2013 phase job. It’ll be either over DTW or Bermuda by verification time for sure…
-
Don’t think anyone is escaping the torching cutter next week. The slow decline starts for everyone by that point.


