bluewave
-
Posts
34,923 -
Joined
-
Last visited
3 Followers


About bluewave

Recent Profile Visitors
50,017 profile views


-
We have only had one October really amplified MJO 5-6 during each multiyear La Niña going back to 2010. October 2024…+2.76…October 2020…+2.81….October 2017…+3.35….October 2010….+2.88. The other La Niña years surrounding these in each group had a weaker October MJO in 5-6 like in 2022, 2021, 2016, and 2011. So the more amplified October years featured La Niña +PNA mismatches. With the exception of last year, these were very snowy winters. But the WPAC pattern and Pacific Jet never relaxed last winter like all the previous mismatch winters did. This is what I was pointing out last year why I mentioned early on that there were competing influences which didn’t exist during the other winters. So not to expect the same type of outcome. So this would be a first time occurrence if the MJO 5 peaked again this October in the +2.76 to +3.35 range. Seems like it’s some type of fall forcing event which affects the winter PNA during La Ninas. It’s why my guess a few months back that this 25-26 winter will be warmer than last winter was with the PNA averaging less positive than last winter did. But since the snowfall was so low last winter, it wouldn’t take much for one decent snow event to surpass last seasons snowfall totals from around Philly to Boston. Plus it’s possible that we could get a least one winter month with a decent +PNA like we saw in January 2022 even though the PNA was strongly negative in December tilting the whole winter -PNA. That was largely driven by the MJO 8. January 2022 was the last winter month around NYC which was both cold and snowy especially Long Island. We have also seen very impressive 500 ridges in Canada since the 2023-2024 El Niño generally boosting the +PNA. So we’ll have to wait for the October verification this year to know if it will be like past multiyear La Ninas following the mismatch winters like we had in 2024-2025. Always have to leave open the possibility of a first time occurrence with back to back mismatch events. But this hasn’t happened yet since 2010.
-
Narrowly focused into the Bay Area in an otherwise sea of warm across the Northern Hemisphere this summer.
-
July 2025 Discussion-OBS - seasonable summer variability
bluewave replied to wdrag's topic in New York City Metro
It’s part of the record subtropical ridge expansion this decade across the Northern Hemisphere. -
Yes. I get the humor involved. Not trying to rain on anyone’s parade. Just taking note of the pattern and where it has gone in the recent past with these persistent base states across the mid-latitudes.
-
I like to use the PDO as a marker or gauge of what the 500mb pattern is doing. Since it’s being driven during the 2020s by these extreme 500 mb ridges across the Pacific leading to similar ridging across the U.S. across the Atlantic. So the strong -PDO is more indicative of the record warm SSTs than the cold ones in the old days. Sometimes during the cold season we see an October -PDO peak like in 2024 and 2021. Then a rebound heading into both winters. But it’s a signal that a very strong subtropical 500mb ridge may occur in the following months. While we had the strong -PDO mismatch last December, there was a very strong subtropical ridge from near Hawaii right into the Western Gulf. So last December was the 4th warmest on record for the CONUS. Back in 2021 we had the October -PDO peak which rose off those lows into December. But it was a signal that the 500 mb ridge driving the -PDO was very robust. This is when we had the record breaking Aleutian Ridge that December leading to the 2nd warmest December on record for the CONUS.
-
July 2025 Discussion-OBS - seasonable summer variability
bluewave replied to wdrag's topic in New York City Metro
The 90° reading for JFK at 10pm was pretty impressive. The all-time 10pm record high at JFK was 95° set back on July 5th 1999. So anytime we are near 90° this late into the evening people notice since it close to the record values. This allowed the record low max at ISP set earlier in the day to hold. A 79° low for anywhere in Suffolk County is very impressive. You can see it beat the previous record by +4°. The warmest low max ever at ISP was 81°. RECORD EVENT REPORT NATIONAL WEATHER SERVICE NEW YORK, NY 316 AM EDT FRI JUL 18 2025 ...RECORD DAILY HIGH MINIMUM TEMPERATURE SET AT ISLIP NY... THE LOW TEMPERATURE WAS ONLY 79 DEGREES THURSDAY, JULY 17 AT ISLIP MACARTHUR AIRPORT. THIS BREAKS THE OLD RECORD HIGH MINIMUM OF 75 DEGREES, LAST SET IN 2021. RECORDS FOR THE ISLIP NY AREA GO BACK TO 1963. ALL CLIMATE DATA ARE CONSIDERED PRELIMINARY UNTIL REVIEWED BY THE NATIONAL CENTERS FOR ENVIRONMENTAL INFORMATION (NCEI). -
The record WPAC warm pool and cooler waters east of the Dateline have been driving these stronger EWBs. So the actual Nino 3.4 SSTs aren’t that important. It’s the SST difference driving the La Niña background. This was the strongest early July EWB near the Dateline since 2022 but not quite as strong.The RONI also tries to approximate this difference which keeps this persistent La Niña background going whether the actual Nino 3.4 is closer to neutral or below -1.
-
July 2025 Discussion-OBS - seasonable summer variability
bluewave replied to wdrag's topic in New York City Metro
Pattern persistence. So we get cooler and more clouds during the weekend with shower or drizzle chances. The best beach days have been during the week especially for the heat like we just experienced last few days. The next heatwave with 95° to 100° potential will be next Thursday and Friday. Models showing cooler and showers clouds chances again for next weekend also. Gets back to the stuck weather patterns which have become so common over the last decade. -
July 2025 Discussion-OBS - seasonable summer variability
bluewave replied to wdrag's topic in New York City Metro
The marine heatwaves were caused by the record 500mb ridge stalling in place creating clear skies and light winds allowing the seas to rapidly warm below. -
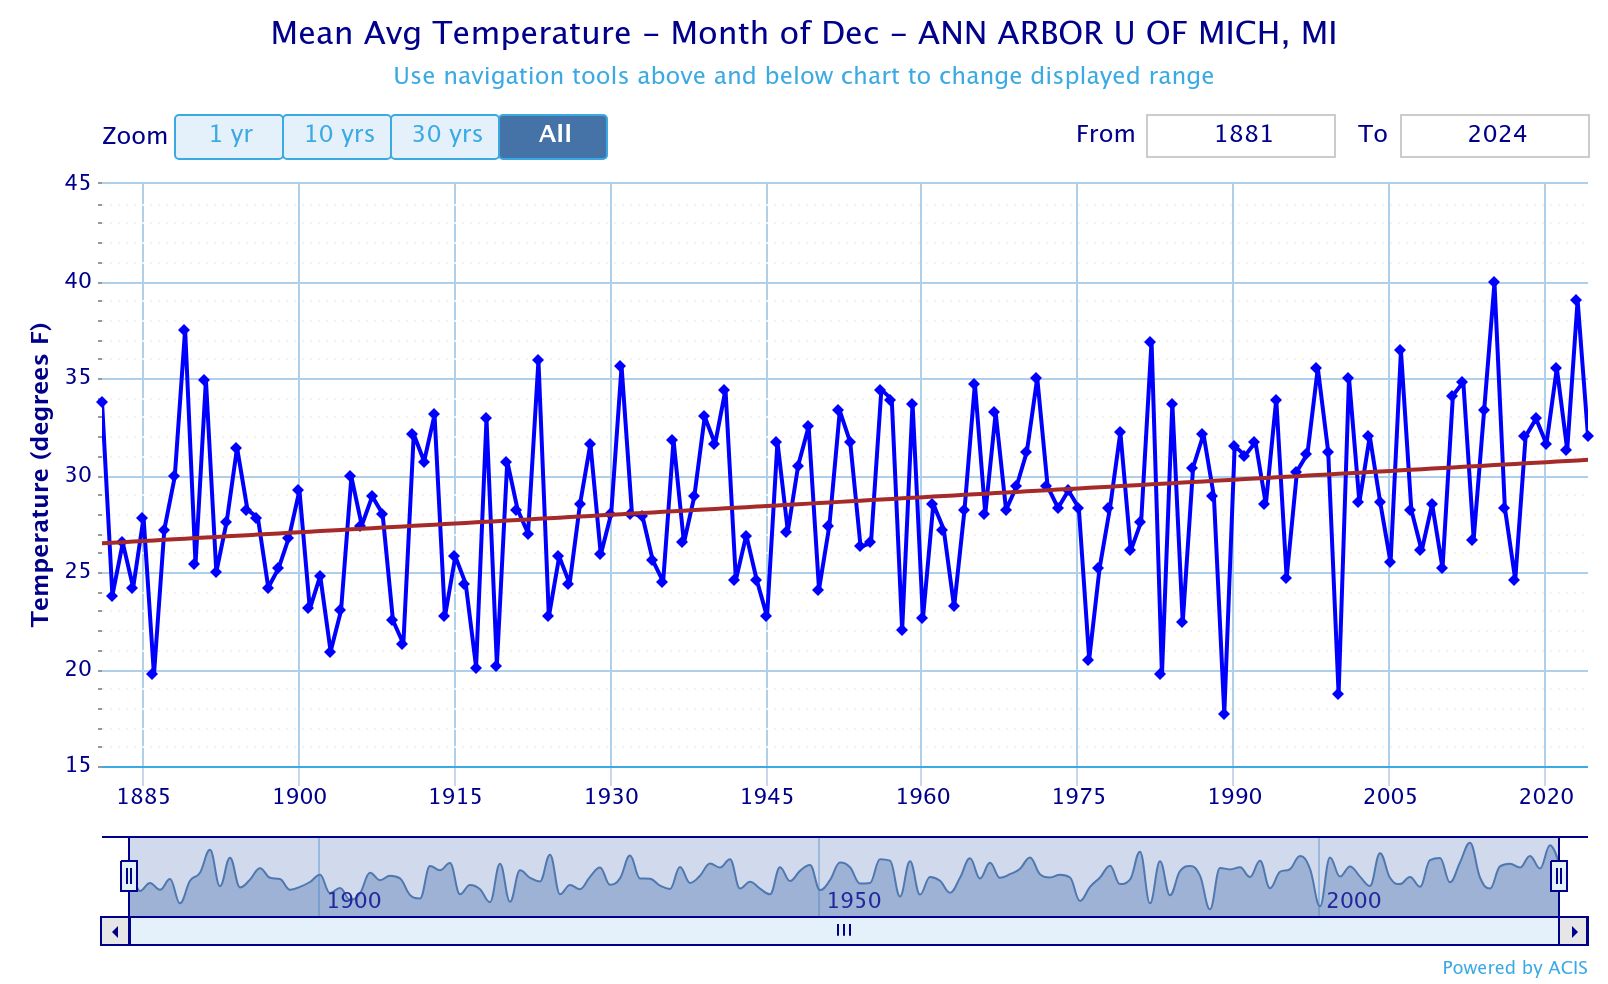
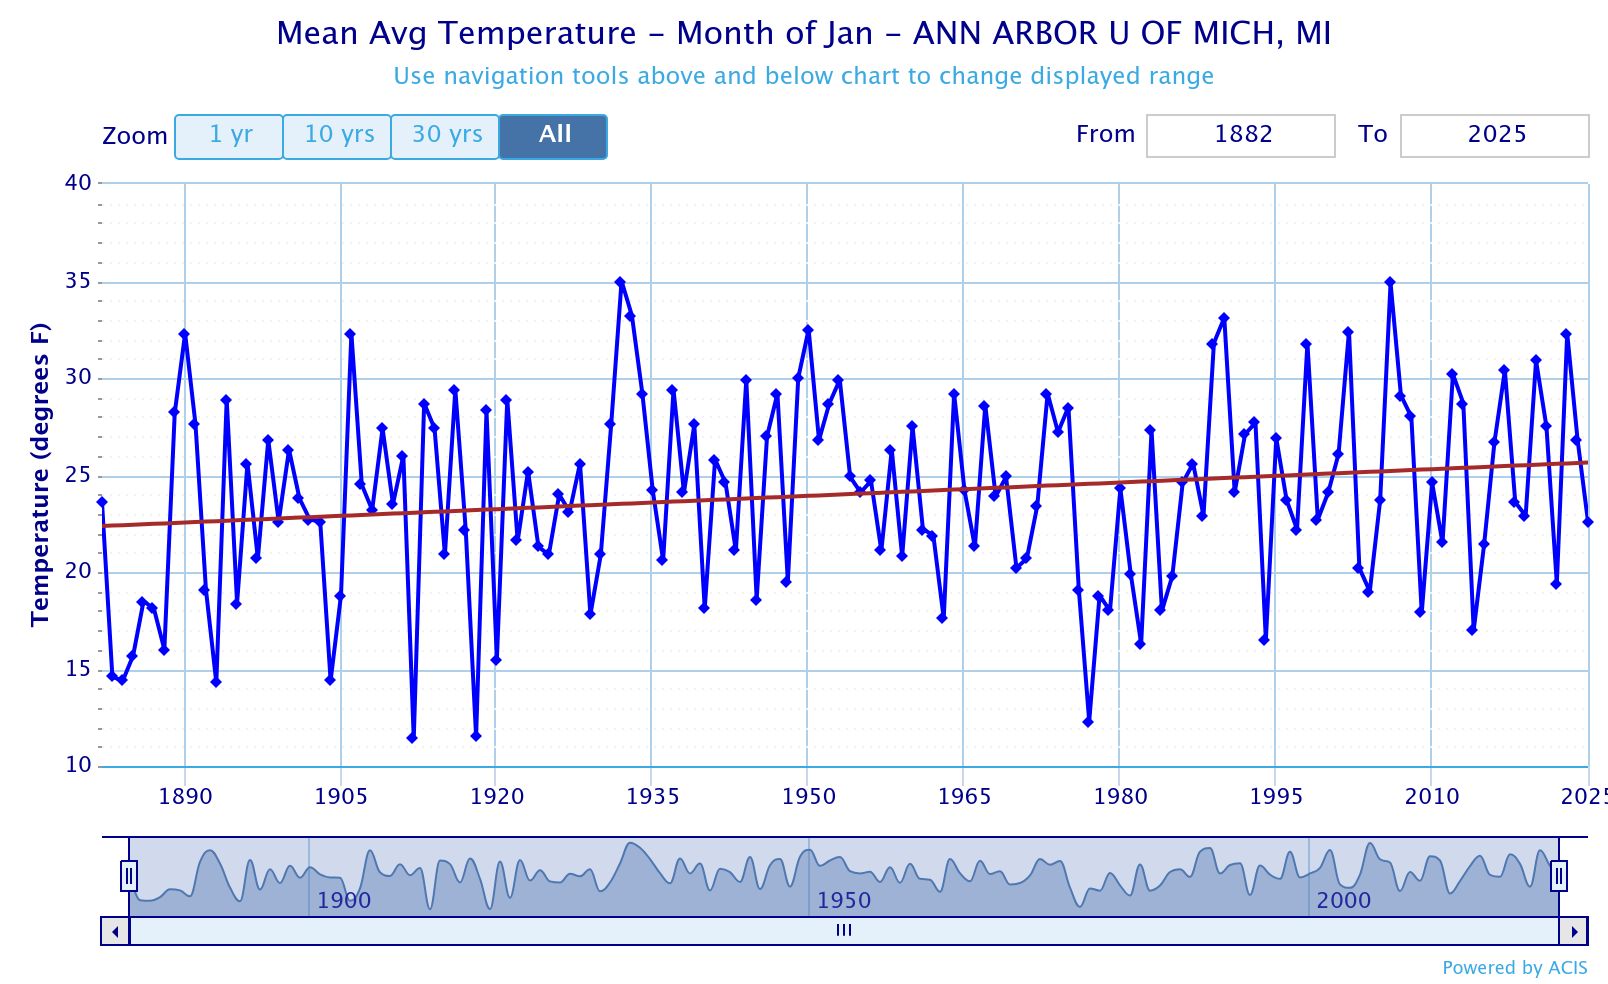
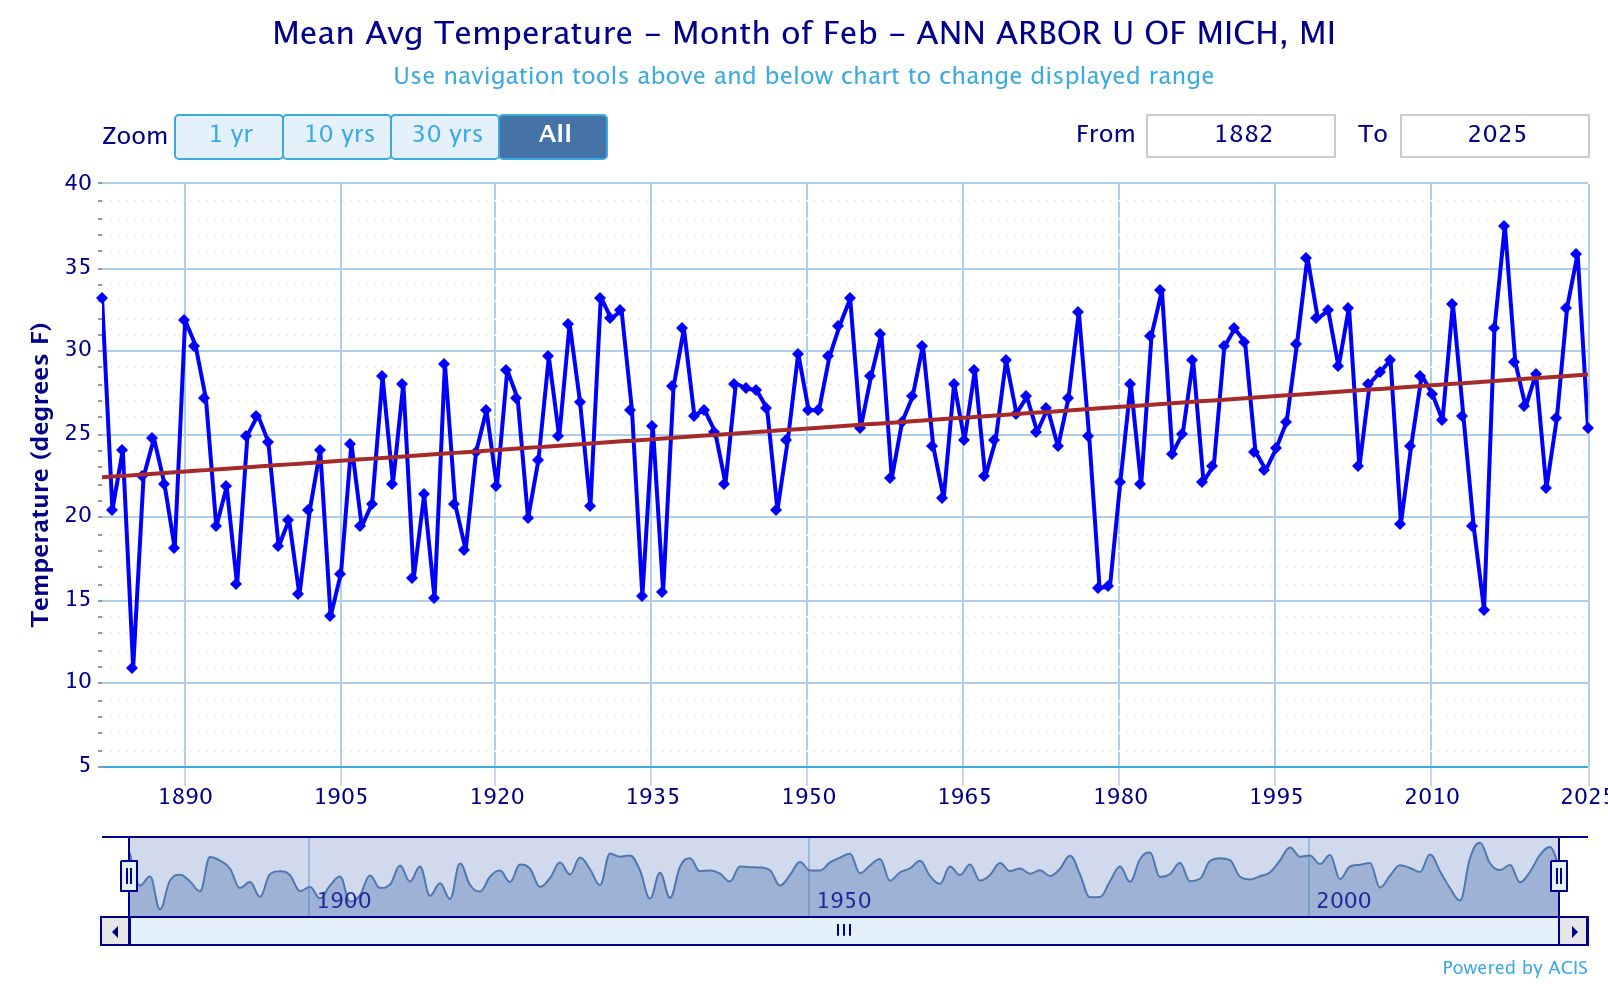
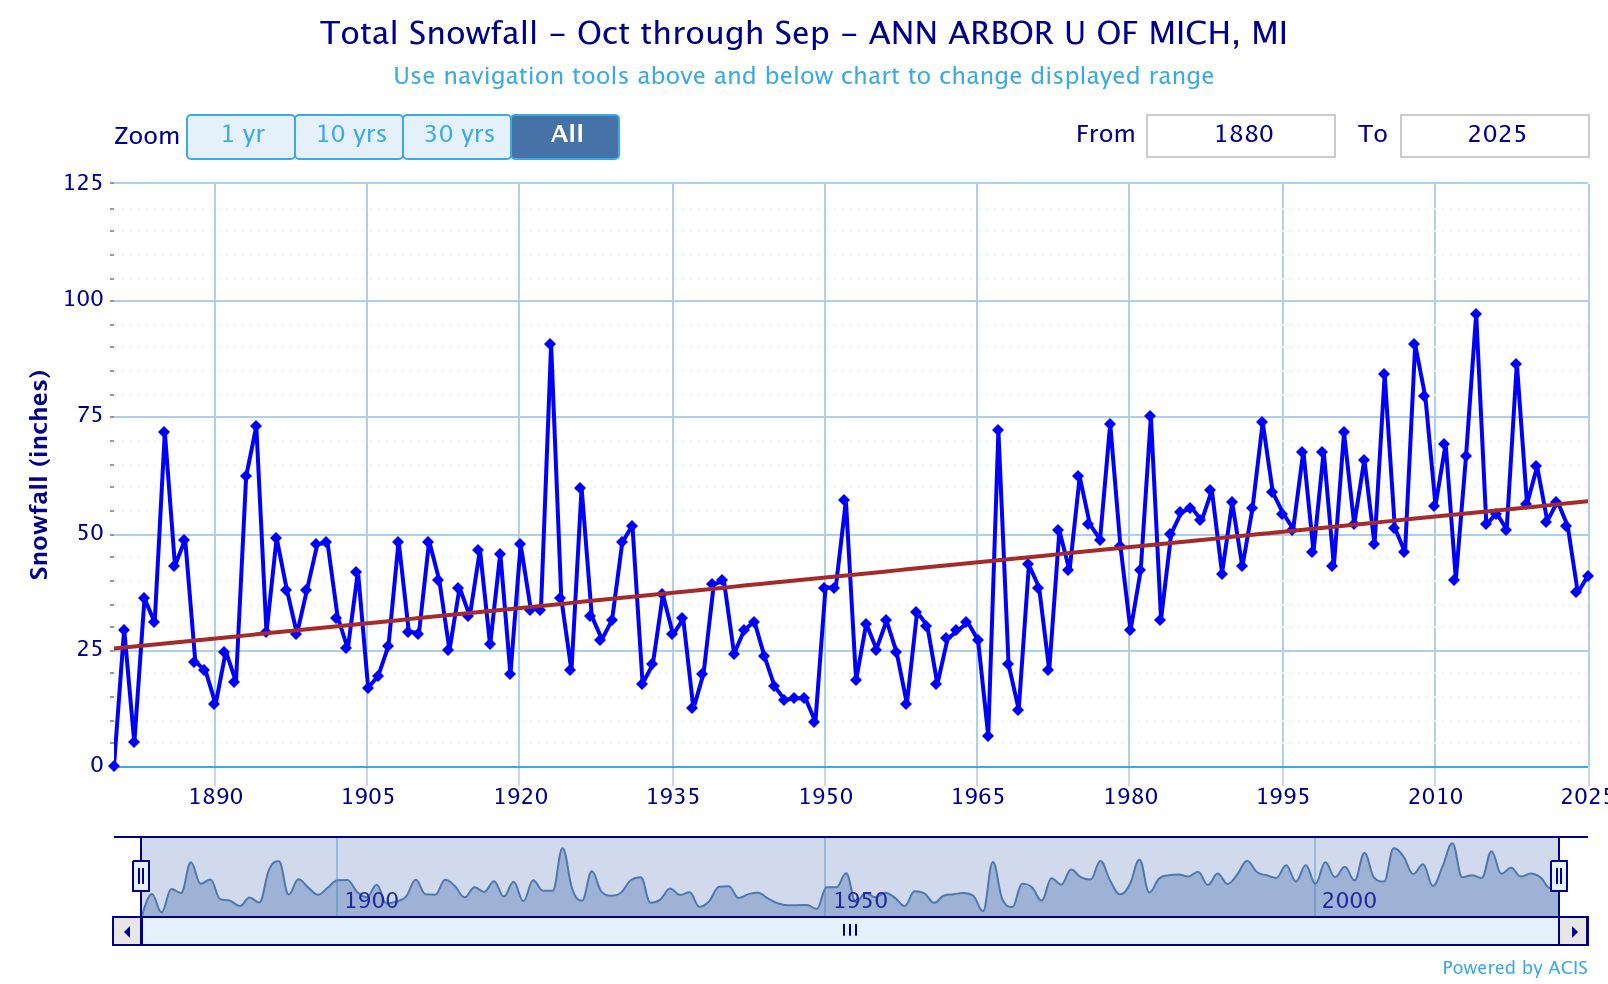
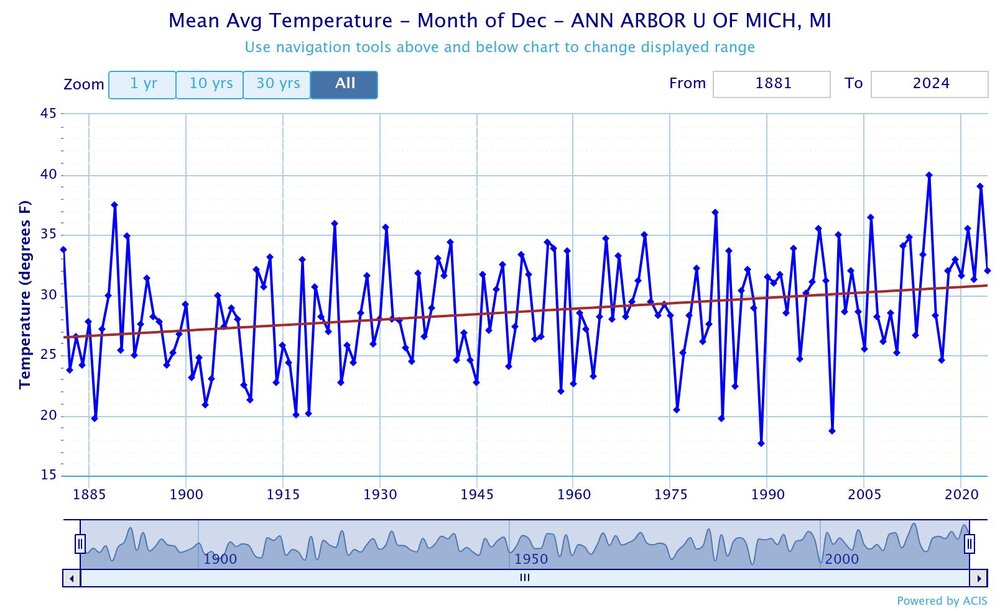
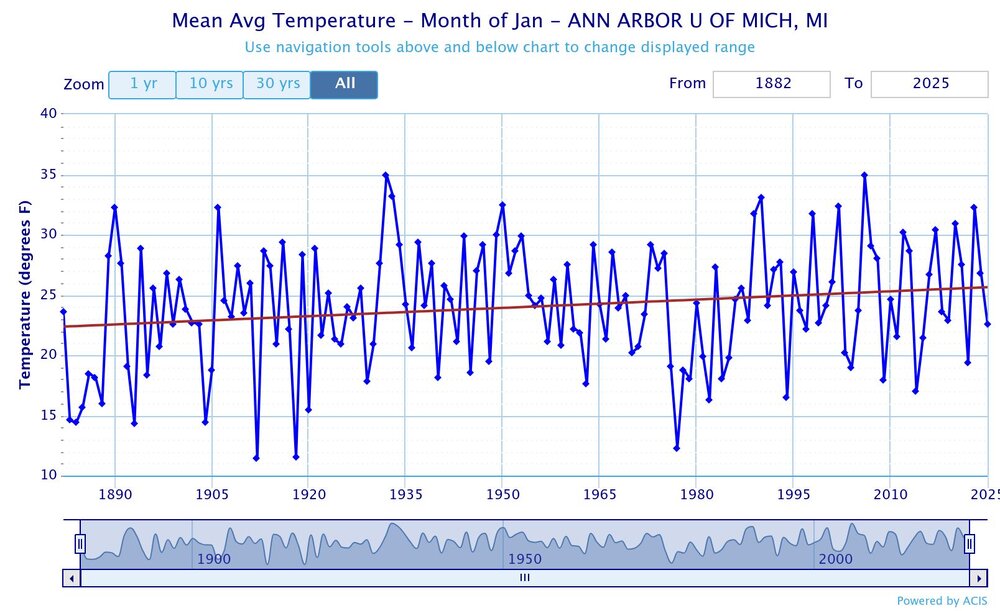
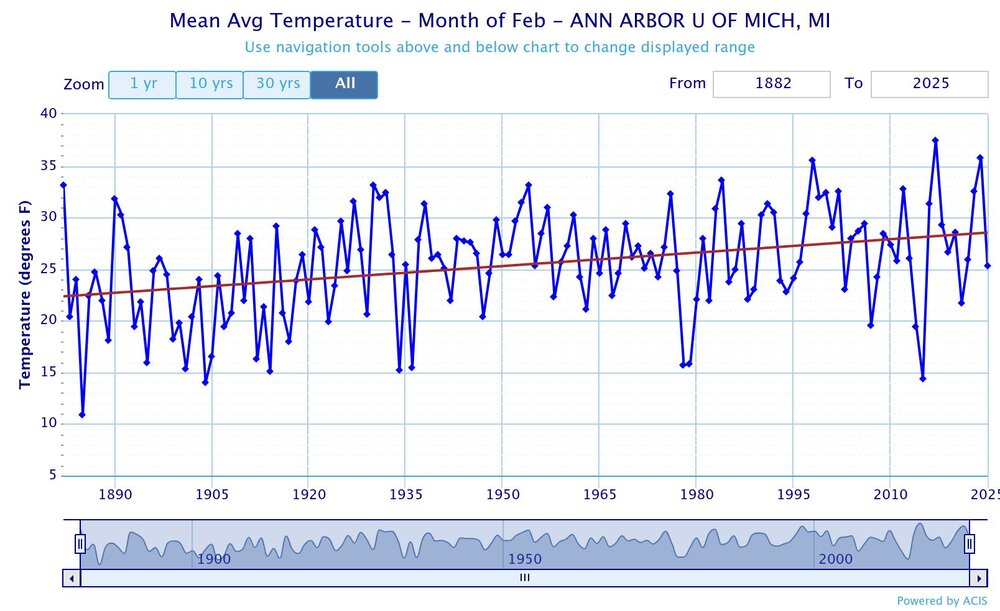
The only thing consistent about Ann Arbor’s winter temperatures since the late 1800s has been a steady warming trend. December is up +4.3° with Jan at +3.2° and February +6.1°. The snowfall has seen a nice increase over this period as you pointed out. This could be a function of the warming winters holding more moisture while still being sufficiently cold enough to increase the snow. It’s one of the benefits of living in a colder region. But this benefit isn’t held by other less warm regions which have seen a steady decrease in snowfall with their rising temperatures. But relative to other parts of Michigan which can really cash in on lake effect snows, the SE corner was never a particularly wintry part of the state compared to areas further north. But at least places like Ann Arbor have seen a decent improvement relative to the old days which didn’t see as much snow.

-
July 2025 Discussion-OBS - seasonable summer variability
bluewave replied to wdrag's topic in New York City Metro
Another typical South Florida day here on the CT Shoreline. New Haven MOSUNNY 89 76 65 SW15G23 29.80F HX 100 MIAMI PTSUNNY 89 77 67 SE16G29 30.08F HX 101 -
July 2025 Discussion-OBS - seasonable summer variability
bluewave replied to wdrag's topic in New York City Metro
We could see some stronger MCS activity in the day 6-10 period. But these have been finding a way to miss our area in recent years. Either to the north or south. But eventually we will get one here. -
July 2025 Discussion-OBS - seasonable summer variability
bluewave replied to wdrag's topic in New York City Metro
Only 1.41” for July here just to the east of KHVN with the lawns quickly turning brown with all the heat. -
July 2025 Discussion-OBS - seasonable summer variability
bluewave replied to wdrag's topic in New York City Metro
The SMQ average max dew point this July so far is a record breaking 74.8°. This is the same average this time of year as Norfolk, VA. Just boost the average max around 1° and this is normal for Miami in July. https://mesonet.agron.iastate.edu/plotting/auto/?_wait=no&q=76&network=NJ_ASOS&station=SMQ&season=jul&varname=dwpf&agg=max&year=1893&w=bar&hours=0-23&_r=t&dpi=100&_fmt=png -
July 2025 Discussion-OBS - seasonable summer variability
bluewave replied to wdrag's topic in New York City Metro
Yeah, it may be a struggle getting much below 70° around NYC. This current streak above 70° is the 17th longest 70° streak in the strongest UHI zones combined with the higher dew points and general warming. So LGA is currently at 12 days through the 16th. The top 10 starts at 19 days with #1 at 44 days back in 2020. Number of Consecutive Days Min Temperature >= 70 for LAGUARDIA AIRPORT, NY Click column heading to sort ascending, click again to sort descending. 1 44 2020-07-03 through 2020-08-15 2 34 2006-07-08 through 2006-08-10 3 32 1980-07-15 through 1980-08-15 4 29 2023-07-01 through 2023-07-29 - 29 2018-07-22 through 2018-08-19 5 28 2010-07-03 through 2010-07-30 6 24 1999-07-16 through 1999-08-08 - 24 1995-07-13 through 1995-08-05 7 23 1988-07-27 through 1988-08-18 8 22 2016-07-12 through 2016-08-02 - 22 2012-06-28 through 2012-07-19 9 20 2015-07-18 through 2015-08-06 - 20 2005-07-29 through 2005-08-17 - 20 1994-07-16 through 1994-08-04 10 19 2021-08-09 through 2021-08-27 - 19 2016-08-04 through 2016-08-22 - 19 2013-06-23 through 2013-07-11 - 19 1966-06-27 through 1966-07-15 11 18 2012-07-31 through 2012-08-17 - 18 1998-07-13 through 1998-07-30 - 18 1988-07-07 through 1988-07-24 - 18 1979-07-20 through 1979-08-06 12 17 2019-07-25 through 2019-08-10 13 16 2008-07-12 through 2008-07-27 - 16 2007-07-25 through 2007-08-09 - 16 1990-08-03 through 1990-08-18 - 16 1990-07-16 through 1990-07-31 14 15 2024-07-04 through 2024-07-18 - 15 2022-07-17 through 2022-07-31 - 15 2018-08-24 through 2018-09-07 - 15 2003-08-02 through 2003-08-16 - 15 1944-07-23 through 1944-08-06 15 14 2019-07-09 through 2019-07-22 - 14 2005-07-14 through 2005-07-27 - 14 1991-07-14 through 1991-07-27 16 13 2022-08-19 through 2022-08-31 - 13 2010-08-01 through 2010-08-13 - 13 2006-06-17 through 2006-06-29 - 13 2002-06-23 through 2002-07-05 - 13 2001-08-01 through 2001-08-13 - 13 1983-07-28 through 1983-08-09 - 13 1973-08-01 through 1973-08-13 - 13 1959-08-25 through 1959-09-06 - 13 1955-07-15 through 1955-07-27 17 12 2025-07-05 through 2025-07-16 - 12 2015-08-14 through 2015-08-25 - 12 2009-08-15 through 2009-08-26 - 12 1993-08-24 through 1993-09-04 - 12 1993-07-04 through 1993-07-15 - 12 1975-07-13 through 1975-07-24