MJO812 Posted December 13, 2023 Share Posted December 13, 2023 18 minutes ago, Neblizzard said: Watch what you say on here this year. Lot of sensitive warminstas. Watch what you post on here . They’ll say it’s over before it’s even begun. It's starting earlier than expected. 4 Link to comment Share on other sites More sharing options...
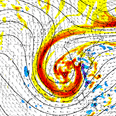
cleetussnow Posted December 13, 2023 Share Posted December 13, 2023 This looks like shit: 2 1 1 1 Link to comment Share on other sites More sharing options...
MANDA Posted December 13, 2023 Share Posted December 13, 2023 3 minutes ago, cleetussnow said: This looks like shit: 500 MB HTS in the low 560's is something most of us don't want on Christmas morning. The 546 at KINL not much better! Link to comment Share on other sites More sharing options...
psv88 Posted December 13, 2023 Share Posted December 13, 2023 27 minutes ago, MJO812 said: I was joking unlike some people in this thread You most definitely were not joking but sure Link to comment Share on other sites More sharing options...
jm1220 Posted December 13, 2023 Share Posted December 13, 2023 51 minutes ago, Brian5671 said: that's one heck of a storm-how often do you see a 984 monster over S Virginia? I think our possible way out of another deluge is it bombs and occludes in the South early which removes much of the large scale lift and WAA when it gets here. But if it’s being lifted north and phasing later, it’ll still be strengthening as it arrives. Not good when even the “dry” models have 2-3” still. Tons of moisture available since this is a southern stream Nino fueled storm. 1 Link to comment Share on other sites More sharing options...
TriPol Posted December 13, 2023 Share Posted December 13, 2023 I don’t care about the warm weather right now. There are… 1… no 2…. hurricane strength storms about to hit us? Up to 10” of rain in a week from them both? That’s some MAJOR flooding! 1 Link to comment Share on other sites More sharing options...
bluewave Posted December 13, 2023 Share Posted December 13, 2023 27 minutes ago, TriPol said: I don’t care about the warm weather right now. There are… 1… no 2…. hurricane strength storms about to hit us? Up to 10” of rain in a week from them both? That’s some MAJOR flooding! These extreme rainfall events have become the new normal for us since 2003. Many years in NYC have finished above 50.00”. Plus if this comes far enough west for high winds, this has been a repeating theme since 2010. Time Series Summary for NY CITY CENTRAL PARK, NY - Jan through DecClick column heading to sort ascending, click again to sort descending. Rank Year Total Precipitation Missing Count 1 1983 80.56 Rain gauge malfunction so total likely overdone 2 2011 72.81 0 3 1972 67.03 0 4 2018 65.55 0 5 1989 65.11 0 6 2007 61.67 0 7 1975 61.21 0 8 1990 60.92 0 9 2006 59.89 0 10 2021 59.73 0 11 2003 58.42 0 12 1903 58.32 0 13 1889 58.18 0 14 1913 58.00 0 15 1973 57.23 0 16 1984 57.03 0 17 1971 56.77 0 18 1996 56.19 0 19 1927 56.06 0 20 2005 55.97 0 21 2023 55.21 19 22 1977 54.73 0 23 2014 53.79 0 24 2009 53.62 0 25 2008 53.61 0 26 1933 53.53 0 27 1888 53.32 0 28 1919 53.29 0 29 1920 53.20 0 30 2019 53.03 0 31 1937 52.97 0 32 1902 52.77 0 33 1884 52.25 0 34 1979 52.13 0 35 2004 51.93 0 36 1871 51.38 0 1 Link to comment Share on other sites More sharing options...
suzook Posted December 13, 2023 Share Posted December 13, 2023 36 minutes ago, TriPol said: I don’t care about the warm weather right now. There are… 1… no 2…. hurricane strength storms about to hit us? Up to 10” of rain in a week from them both? That’s some MAJOR flooding! But if it was cold enough, it could have been 130 inches. Lol 2 Link to comment Share on other sites More sharing options...
nycwinter Posted December 13, 2023 Share Posted December 13, 2023 so warm that i do not even have to zipper my coat.. 1 Link to comment Share on other sites More sharing options...
SnowGoose69 Posted December 13, 2023 Share Posted December 13, 2023 1 hour ago, cleetussnow said: This looks like shit: The airmass is gonna be puke as a whole, at least at 276. But as you saw if you follow the Op run to 384 it gets colder as you more or less develop a -NAO/AO by that time 2 Link to comment Share on other sites More sharing options...
donsutherland1 Posted December 13, 2023 Share Posted December 13, 2023 Cool weather will continue through tomorrow. Afterward, temperatures will grow milder to end the week. The mild weather will continue through the weekend. A significant rainstorm followed by a continuation of above normal temperatures is likely Sunday evening into Monday. A general 1"-3" of rain is possible. No Arctic air appears likely through the remainder of December. If anything, the warm risks for the closing 7-10 days of the month have increased. A transition to a colder pattern could commence during the first week of January. The ENSO Region 1+2 anomaly was +1.3°C and the Region 3.4 anomaly was +1.9°C for the week centered around December 6. For the past six weeks, the ENSO Region 1+2 anomaly has averaged +1.97°C and the ENSO Region 3.4 anomaly has averaged +1.92°C. A basinwide El Niño event is ongoing. El Niño conditions will may strengthen somewhat further this month. The SOI was +6.69 today. The preliminary Arctic Oscillation (AO) was +0.180 today. Strong blocking in the final week of November, as occurred this year, has often been followed by frequent blocking in December and January. On December 11 the MJO was not available. The December 10-adjusted amplitude was 1.890 (RMM). Based on sensitivity analysis applied to the latest guidance, there is an implied 84% probability that New York City will have a warmer than normal December (1991-2020 normal). December will likely finish with a mean temperature near 41.6° (2.5° above normal). 1 1 Link to comment Share on other sites More sharing options...
North and West Posted December 13, 2023 Share Posted December 13, 2023 so warm that i do not even have to zipper my coat... 1 Link to comment Share on other sites More sharing options...
LongBeachSurfFreak Posted December 13, 2023 Share Posted December 13, 2023 Pretty hard core snow showers to our north currently. They should at least survive into the northern suburbs. 1 Link to comment Share on other sites More sharing options...
NittanyWx Posted December 13, 2023 Share Posted December 13, 2023 2 hours ago, bluewave said: These extreme rainfall events have become the new normal for us since 2003. Many years in NYC have finished above 50.00”. Plus if this comes far enough west for high winds, this has been a repeating theme since 2010. Time Series Summary for NY CITY CENTRAL PARK, NY - Jan through DecClick column heading to sort ascending, click again to sort descending. Rank Year Total Precipitation Missing Count 1 1983 80.56 Rain gauge malfunction so total likely overdone 2 2011 72.81 0 3 1972 67.03 0 4 2018 65.55 0 5 1989 65.11 0 6 2007 61.67 0 7 1975 61.21 0 8 1990 60.92 0 9 2006 59.89 0 10 2021 59.73 0 11 2003 58.42 0 12 1903 58.32 0 13 1889 58.18 0 14 1913 58.00 0 15 1973 57.23 0 16 1984 57.03 0 17 1971 56.77 0 18 1996 56.19 0 19 1927 56.06 0 20 2005 55.97 0 21 2023 55.21 19 22 1977 54.73 0 23 2014 53.79 0 24 2009 53.62 0 25 2008 53.61 0 26 1933 53.53 0 27 1888 53.32 0 28 1919 53.29 0 29 1920 53.20 0 30 2019 53.03 0 31 1937 52.97 0 32 1902 52.77 0 33 1884 52.25 0 34 1979 52.13 0 35 2004 51.93 0 36 1871 51.38 0 It's not unique to NY either. Single day rainfall records are being broken and an increasing rate over the past 20 years. It's one of the cleaner climate change signals we have and passes the scientific sniff test. 5 Link to comment Share on other sites More sharing options...
wishcast_hater Posted December 14, 2023 Share Posted December 14, 2023 It's not unique to NY either. Single day rainfall records are being broken and an increasing rate over the past 20 years. It's one of the cleaner climate change signals we have and passes the scientific sniff test.I will never understand how we can declare definitive climate change based on 150 years of records when we have no idea of what took place beforehand. . 2 Link to comment Share on other sites More sharing options...
ForestHillWx Posted December 14, 2023 Share Posted December 14, 2023 36 minutes ago, wishcast_hater said: I will never understand how we can declare definitive climate change based on 150 years of records when we have no idea of what took place beforehand. . Careful…you’re treading on sacred ground around these parts. 2 Link to comment Share on other sites More sharing options...
Roger Smith Posted December 14, 2023 Share Posted December 14, 2023 There are some records in N America going back into the 18th century, if you want to see some detailed examples have a look in climate change forum for a thread on Toronto and NYC climate stats, Toronto goes back to 1840 and I found a station at Providence RI going back to 1831. A summary of that location's daily records 1831-60 gives a basic overview that supports the idea parts of 19th century could have been slightly warmer (than 1871-1900) but not as warm as last 30-40 yrs. UK "Central England Temperature" series goes further back, a period between 1710 and 1739 is almost as warm as mid-20th century and about 0.5 C cooler than more recent decades. The interval from 1659 to 1709 was colder than any later intervals, 1684 to 1709 in particular very cold (this is the later part of the maunder minimum). Before that we only have tree ring records and such, together with anecdotal reports about extremes. Some believe 1540 could have been a summer like 2022 in Europe for drought and extreme heat. It was recorded that the Rhine almost dried up and heat was described as severe leading to deaths. Perhaps of significance, this was a very active solar period between two lower intervals, the Sporer minimum of the 15th century, and the maunder minimum. There is also the well known postulate that severe drought caused major cultural shifts in the southwestern U.S., such as the migration of the formerly dominant Anasazi people in the "four corners" region. This is dated to 1150-1200 A.D. Climate change is real but it isn't new. A region between Chad and Libya used to have a lush savanna climate and a lake fed a now-extinct river, the "Yellow Nile" that flowed east to join the Nile near where the other two sources of the Nile ("white" and "blue" Niles) now combine in Sudan. That river stopped flowing about six thousand years ago and people in that region had to migrate to find reliable water sources. But there are small lakes left and even a remnant population of wildlife including a few crocs and hippos, in a desert oasis setting now. That climate change was related to the final drying up and disappearance of Lake Lahontan in the great basin region. All that's left of formerly gigantic Lake Lahontan are a half dozen salt lakes and plenty of other seasonal dry lakes scattered across Nevada and Utah. As recently as 17,000 years ago, when the Laurentide glaciers were still near their full extent, the climate of Nevada was about like south-central B.C. nowadays, with reliable rainfall and probably a much colder winter. 1 Link to comment Share on other sites More sharing options...
bluewave Posted December 14, 2023 Share Posted December 14, 2023 30 minutes ago, Roger Smith said: There are some records in N America going back into the 18th century, From all the historical accounts that I have read, the winter of 1779-1780 was probably the coldest on record going back to the colonial times. If this Philly account of the temperature only getting above freezing once in January 1780 is close, then the monthly average may have only been around 15°. The coldest month on record since 1874 was January 1977 at 20.0°. https://www.google.com/books/edition/The_Philadelphia_Area_Weather_Book/mon_ivVXUY4C?hl=en&gbpv=1&dq=january+1780+cold+philadelphia+pa&pg=PA76&printsec=frontcover Time Series Summary for Philadelphia Area, PA (ThreadEx) - Month of JanClick column heading to sort ascending, click again to sort descending. Rank Year Mean Avg Temperature Missing Count 1 1977 20.0 0 2 1893 24.0 0 3 1918 24.1 0 4 1970 24.5 0 5 1982 24.7 0 1 2 Link to comment Share on other sites More sharing options...
Volcanic Winter Posted December 14, 2023 Share Posted December 14, 2023 40 minutes ago, bluewave said: From all the historical accounts that I have read, the winter of 1779-1780 was probably the coldest on record going back to the colonial times. If this Philly account of the temperature only getting above freezing once in January 1780 is close, then the monthly average may have only been around 15°. The coldest month on record since 1874 was January 1977 at 20.0°. https://www.google.com/books/edition/The_Philadelphia_Area_Weather_Book/mon_ivVXUY4C?hl=en&gbpv=1&dq=january+1780+cold+philadelphia+pa&pg=PA76&printsec=frontcover Time Series Summary for Philadelphia Area, PA (ThreadEx) - Month of JanClick column heading to sort ascending, click again to sort descending. Rank Year Mean Avg Temperature Missing Count 1 1977 20.0 0 2 1893 24.0 0 3 1918 24.1 0 4 1970 24.5 0 5 1982 24.7 0 Simply unfathomable. I appreciate this post very much Bluewave, I have an intense fascination with the LIA both from a volcanism perspective and just the general extreme climo differences to now. I was born simply too late to experience the milder facsimiles of the harshest LIA winter months in the 70’s and 80’s. — I generally believe the LIA was caused by a multitude of factors instead of any one singular thing, but I found a snippet of a paper suggesting volcanism as the principal driver, kicked off the by the enormous Samalas / Rinjani eruption of the 13th century (larger than Tambora, even greater climate impact). https://ui.adsabs.harvard.edu/abs/2017AGUFMPP43D..05Z/abstract Seems to suggest the ability for the large scale volcanism of the LIA to tip a susceptible AMO into a prolonged cold configuration. It’s interesting because traditionally ‘volcanic winters’ are short lived phenomena. 1 Link to comment Share on other sites More sharing options...
Roger Smith Posted December 14, 2023 Share Posted December 14, 2023 Yes, it was also a very cold winter in Britain, after a very warm year (1779) that provides warmest Feb even now after 2.5 centuries. Sure you also know about extreme snowfalls in Feb-mar 1717. Link to comment Share on other sites More sharing options...
jm1220 Posted December 14, 2023 Share Posted December 14, 2023 1 hour ago, wishcast_hater said: I will never understand how we can declare definitive climate change based on 150 years of records when we have no idea of what took place beforehand. . As the air gets warmer it holds more moisture=more extreme rain events. We also have methods to evaluate ice cores and other means to evaluate the climate from much longer ago. 2 Link to comment Share on other sites More sharing options...
STORMANLI Posted December 14, 2023 Share Posted December 14, 2023 4 hours ago, North and West said: . And Asia's The Heat Goes On Sorry, no video link. 1 Link to comment Share on other sites More sharing options...
donsutherland1 Posted December 14, 2023 Share Posted December 14, 2023 24 minutes ago, jm1220 said: As the air gets warmer it holds more moisture=more extreme rain events. We also have methods to evaluate ice cores and other means to evaluate the climate from much longer ago. A good summary on paleoclimate proxies can be found here: https://www.usgs.gov/programs/climate-research-and-development-program/science/paleoclimate-proxies#overview 1 Link to comment Share on other sites More sharing options...
NittanyWx Posted December 14, 2023 Share Posted December 14, 2023 4 hours ago, wishcast_hater said: I will never understand how we can declare definitive climate change based on 150 years of records when we have no idea of what took place beforehand. . Lol what? I gotta ask, who told you we have 'no idea' of what happened more than 150 years ago? 1 1 Link to comment Share on other sites More sharing options...
ForestHillWx Posted December 14, 2023 Share Posted December 14, 2023 Without needing to state the obvious, I think @wishcast_hateris commenting as to the extent of AGW on the ever evolving climate, as the responsive posts correctly point out. Candidly when discussing the impacts of “climate change” on our weather patterns there is a built-in narrative that the climate is changing due to human activity, and not in response to natural variability. And now, back to wishcasting for snow… 1 Link to comment Share on other sites More sharing options...
Roger Smith Posted December 14, 2023 Share Posted December 14, 2023 If for any reason it cooled down on an epic scale (volcanic dust, solar downturns, unknown cause and effect) we would begin to be glad for AGW signal, it could save our society considerable stress. But nobody is predicting it would work out so. It would probably rain even greater values, be cloudy all day, and around 1961-90 averages. Sort of like a worst case scenario but not too cold to survive. Link to comment Share on other sites More sharing options...
the_other_guy Posted December 14, 2023 Share Posted December 14, 2023 28F this morning. Dont look now, but…looks like that storm really pulls in a lot of cool air behind it. haha Link to comment Share on other sites More sharing options...
bluewave Posted December 14, 2023 Share Posted December 14, 2023 27 minutes ago, the_other_guy said: 28F this morning. Dont look now, but…looks like that storm really pulls in a lot of cool air behind it. haha That isn’t a lot of cold air by late December standards. We go from 60° to -2 to -4 for a couple of days before we warm up back above normal again. The 26th to 31st may be the warmer minimums driving the +departures with the fast flow and clouds. 2 Link to comment Share on other sites More sharing options...
qg_omega Posted December 14, 2023 Share Posted December 14, 2023 17 minutes ago, the_other_guy said: 28F this morning. Dont look now, but…looks like that storm really pulls in a lot of cool air behind it. haha one to two days of normal and right back to well above Link to comment Share on other sites More sharing options...
MJO812 Posted December 14, 2023 Share Posted December 14, 2023 15 minutes ago, bluewave said: That isn’t a lot of cold air by late December standards. We go from 60° to -2 to -4 for a couple of days before we warm up back above normal again. The 26th to 31st may be the warmer minimums driving the +departures with the fast flow and clouds. It's not a torch 1 Link to comment Share on other sites More sharing options...

Recommended Posts
Create an account or sign in to comment
You need to be a member in order to leave a comment
Create an account
Sign up for a new account in our community. It's easy!
Register a new accountSign in
Already have an account? Sign in here.
Sign In Now