donsutherland1 Posted December 31, 2023 Share Posted December 31, 2023 Recent years have seen fewer hours during which the temperature was 32° or below in December: 1 2 Link to comment Share on other sites More sharing options...
the_other_guy Posted December 31, 2023 Share Posted December 31, 2023 4 minutes ago, donsutherland1 said: Recent years have seen fewer hours during which the temperature was 32° or below in December: Look at the huge change in just 20 years! How fucking scary! 1 Link to comment Share on other sites More sharing options...
coastalplainsnowman Posted December 31, 2023 Share Posted December 31, 2023 Global temperatures have been rising for as long as we've been able to reliably measure it. The recent rate over the most recent 50 years is greater than the previous 100. But the extrapolation by some on here of very, very recent events to suggest that we're witnessing a sudden point of no return right here before our eyes on americanwx.com, is unfounded and not scientific. For the same reason that a cold snap or a blizzard doesn't dispute the fact that temperatures have been rising ("Weather is not climate", we are told), looking at a few recent years to suggest that it just won't snow any more in 'our new climate' (another term I see here a lot lately) is silly. There's so much data to convince that things are getting warmer. Extrapolating very recent data to draw dramatic and ominous conclusions undermines such arguments. I don't see the mets or other experts on here who share their excellent posts about warming trends saying anything so dramatic - perhaps cues can be taken from them to - pardon the pun - chill out. 1 Link to comment Share on other sites More sharing options...
qg_omega Posted December 31, 2023 Share Posted December 31, 2023 Increased water vapor from the volcano combined with cleaner air due to reduced aerosol and sulfur pollution has rapidly accelerated the warming, this is fact and not debatable 1 Link to comment Share on other sites More sharing options...
psv88 Posted December 31, 2023 Share Posted December 31, 2023 5 minutes ago, qg_omega said: Increased water vapor from the volcano combined with cleaner air due to reduced aerosol and sulfur pollution has rapidly accelerated the warming, this is fact and not debatable Right. The cleaner air was an underestimated source of warming. Link to comment Share on other sites More sharing options...
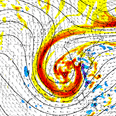
Wxoutlooksblog Posted December 31, 2023 Share Posted December 31, 2023 Watching Jan 6th into the 7th. At this point, I have trouble seeing how this works out in in our favor. Definitely a thread the needle situation, if it comes too close to us, we're mostly rain, if it stays too far south we're on the edge of the precip get little if any. The GFS really indicated a nearly perfect track for snow from the Washington D.C. to Baltimore to Philly to NYC and LI. I'd be amazed if it actually worked out that way. WX/PT https://www.tropicaltidbits.com/analysis/models/gfs/2023123100/gfs_mslp_pcpn_frzn_us_31.png 1 1 Link to comment Share on other sites More sharing options...
STORMANLI Posted December 31, 2023 Share Posted December 31, 2023 33° Lowest temp since Dec 23rd Remarkable Link to comment Share on other sites More sharing options...
SnoSki14 Posted December 31, 2023 Share Posted December 31, 2023 7 hours ago, qg_omega said: Increased water vapor from the volcano combined with cleaner air due to reduced aerosol and sulfur pollution has rapidly accelerated the warming, this is fact and not debatable I doubt the volcano had much of an effect. The aerosols sure. It also doesn't help that we're lagging big time with renewables and clean energy. I think coal outputs reached record highs actually Link to comment Share on other sites More sharing options...
North and West Posted December 31, 2023 Share Posted December 31, 2023 I doubt the volcano had much of an effect. The aerosols sure. It also doesn't help that we're lagging big time with renewables and clean energy. I think coal outputs reached record highs actually Too much focus on expensive renewables and new clean energy, and not enough on reliable and proven clean nuclear energy. e.g., look at Europe, particularly Germany, moving away from nuclear and having to use gas and coal.The solution for clean is here and has been here for a while - nuclear. Same goes for hybrid vehicles versus full EVs. Over 90% of our car trips are under 30 total miles, completely within a hybrid’s range. Per Toyota, you could build over 70 hybrids with the rare earths it takes to build one EV. We can do it, it’s just not trendy nor does it favor lining the pockets of special interests or social status.. 1 Link to comment Share on other sites More sharing options...
IrishRob17 Posted December 31, 2023 Share Posted December 31, 2023 16 hours ago, IrishRob17 said: Forecasted low of 27 here tonight, last below freezing low was on Christmas Eve. Fail, only made it to 33 Link to comment Share on other sites More sharing options...
bluewave Posted December 31, 2023 Share Posted December 31, 2023 The first 3 consecutive winter months with top 3 warmest finishes for NYC. Time Series Summary for NY CITY CENTRAL PARK, NY - Month of DecClick column heading to sort ascending, click again to sort descending. Rank Year Mean Avg Temperature Missing Count 1 2015 50.8 0 2 2023 44.7 1 3 2001 44.1 0 4 2021 43.8 0 5 1984 43.7 0 6 2006 43.6 0 7 2011 43.3 0 8 1998 43.1 0 9 1982 42.7 0 10 1990 42.6 0 Time Series Summary for NY CITY CENTRAL PARK, NY - Month of FebClick column heading to sort ascending, click again to sort descending. Rank Year Mean Avg Temperature Missing Count 1 2018 42.0 0 2 2017 41.6 0 3 2023 41.1 0 4 2012 40.9 0 5 2002 40.6 0 - 1998 40.6 0 - 1984 40.6 0 6 2020 40.1 0 - 1954 40.1 0 7 1997 40.0 0 8 1991 39.9 0 - 1976 39.9 0 9 1990 39.7 0 10 1981 39.3 0 Time Series Summary for NY CITY CENTRAL PARK, NY - Month of JanClick column heading to sort ascending, click again to sort descending. Rank Year Mean Avg Temperature Missing Count 1 2023 43.5 0 2 1932 43.2 0 3 1950 41.8 2 4 1990 41.4 0 5 2006 40.9 0 6 1913 40.8 0 7 1933 40.3 0 8 1937 40.2 0 9 1998 40.0 0 10 2002 39.9 0 1 Link to comment Share on other sites More sharing options...
SACRUS Posted December 31, 2023 Share Posted December 31, 2023 Low of 39 now to 40 and cloudy. More cloudiness the next day or day and half then Tue - Fri dry and sunny. Will track a storm next week with more rain potential. Happy New Year Link to comment Share on other sites More sharing options...
MJO812 Posted December 31, 2023 Share Posted December 31, 2023 Just now, SACRUS said: Low of 39 now to 40 and cloudy. More cloudiness the next day or day and half then Tue - Fri dry and sunny. Will track a storm next week with more rain potential. Happy New Year Rain ? Link to comment Share on other sites More sharing options...
SACRUS Posted December 31, 2023 Share Posted December 31, 2023 Records: Highs: EWR: 63(1965) NYC: 63 (1965) LGA: 63 (1965) Lows: EWR: 2 (1962) NYC: -7 (1917) LGA: 3 (1962) Historical: 1876: A heavy snowstorm hit southern Arkansas, with amounts well over 20 inches in places. 28 inches was reported near Warren, and 24–28 inches was reported at Arkansas City. On this day in 1876, a heavy snow storm hit southern Arkansas, with amounts well over 20 inches in places. 28 inches was reported near Warren, and 24-28 inches was reported at Arkansas City. The snow lingered well into January of 1877. 1882: Downtown San Francisco saw 3.5 inches of snow. 1917 - The temperature at Lewisburg, WV, plunged to 37 degrees below zero to set a state record. (Sandra and TI Richard Sanders - 1987) 1929 - Greenland Ranch, in Death Valley, California, went the entire year without measurable precipitation. (The Weather Channel) 1933 - A 24 hour rainfall of 7.36 inches set the stage for the worst flood in Los Angeles history. Flooding claimed 44 lives. (David Ludlum) 1933: During the last week of December, a series of winter storms pounded the mountainside with 12 inches of rain near Los Angeles. More rain occurred on New Year’s Eve, including 4.86 inches in downtown Los Angeles. The 4.86 inches is currently the fourth most rainfall to occur in one day in downtown Los Angeles since 1877. Around midnight, hillsides in at least three mountain locations collapsed sending millions of tons of mud and debris into the Crescenta Valley neighborhoods below. Crescenta Valley is a few miles north of Los Angeles. This mudslide destroyed more than 400 homes. Following the disaster, the U.S. Army Corps of Engineers and the County of Los Angeles built a flood control system of catch basins, and concrete storm drains, designed to prevent a repeat of the 1934 disaster. 1967: The kickoff temperature for the NFL Championship Game between the Dallas Cowboys and the Green Bay Packers was -13°F with a wind chill of -36°F. This game is known as the “Ice Bowl.” 1941 - Snow which began on New Year's Eve became a major blizzard on New Year's Day, burying Des Moines, IA, uunder 19.8 inches of snow in 24 hours, an all-time record for that location. (The Weather Channel) 1947 - A late afternoon tornado touched down 10 miles north of Shreveport LA, and dissipated south of El Dorado AR. The tornado, as much as 400 yards in width, killed 18 persons. It damaged or destroyed two thirds of the structures at Cotton Valley LA. (The Weather Channel) 1962 - Perhaps the worst blizzard in the history of the state of Maine finally came to an end. The storm produced 40 inches in 24 hours at Orono, and a total of 46 inches at Ripogenus Dam. Gale force winds produced snow drifts twenty feet high around Bangor. A disastrous icestorm was over Georgia and South Carolina. It ravaged the two states for days causing more than seven million dollars damage. (David Ludlum) (The Weather Channel) 1963 - A snowstorm struck the Deep South. Meridian, MS, received 15 inches of snow, 10.5 inches blanketed Bay St Louis MS, and 4.5 inches fell at New Orleans LA. Freezing temperatures then prevailed for New Year's Day. (David Ludlum) 1987 - Torrential rains caused extensive flash flooding over eastern sections of the island of Ohau in Hawaii, resulting in many rock and mud slides. Rainfall totals ranged up to 22.89 inches in a 24 hour period, and property damage was estimated at 35 million dollars. Strong winds continued to usher arctic cold into the north central U.S. The temperature at Alexandria MN remained below zero through the day, and Jamestown ND reported a wind chill reading of 58 degrees below zero. Gales lashed the Great Lakes, with wind gusts to 54 mph reported at Lansing MI. (Storm Data) (The National Weather Summary) 1988 - Warm and wet weather prevailed in the southeastern U.S. Six cities in Florida reported record high temperatures for the date. Thunderstorms produced locally heavy rains from the Lower Mississippi Valley to the Southern Atlantic Coast. (The National Weather Summary) 1989 - The year and decade ended on a soggy note in the eastern U.S. Thunderstorm rains pushed precipitation totals for the year to 88.32 inches at Baton Rouge, and to 75.37 inches at Huntsville AL, establishing all-time records for those two locations. Dry weather continued in California. Sacramento and San Francisco finished the month without any rain or snow, and Santa Maria reported their driest year of record with just 3.30 inches of precipitation. (The National Weather Summary) (Storm Data) 2010 - Unusually warm air fueled strong storms in the midwestern and southern U.S., producing high winds and a preliminary count of 53 tornadoes across five states. At least eight people were killed in Missouri and Arkansas and dozens of others were injured. In Mississippi, about 200 people were evacuated from the Jackson-Evers International Airport, where an EF-2 tornado crossed a runway. (NCDC) Link to comment Share on other sites More sharing options...
Stormlover74 Posted December 31, 2023 Share Posted December 31, 2023 I thought today was going to be sunny? Nope 42 and overcast again Link to comment Share on other sites More sharing options...
IrishRob17 Posted December 31, 2023 Share Posted December 31, 2023 30 minutes ago, Stormlover74 said: I thought today was going to be sunny? Nope 42 and overcast again Saw it for about three minutes this morning Link to comment Share on other sites More sharing options...
donsutherland1 Posted December 31, 2023 Share Posted December 31, 2023 New York City's second warmest December on record is concluding with a monthly mean temperature of 44.6° (5.5° above normal). 2023 has become New York City's warmest year on record with an annual mean temperature of 58.0° (old record: 57.4°, 2012). Additional cities in the Northeast experiencing their warmest year on record included: Albany, Baltimore, Islip, Newark, Sterling, and Worcester. The first week of January will likely feature generally near normal to somewhat above normal temperatures. Severe cold is unlikely. Initially, the arrival of a colder regime could coincide with a drier one, so snowfall prospects will remain limited until near the end of the week or start of the following week. There is the possibility that a storm could bring measurable snowfall to the region during January 7-8 with interior sections likely to see the largest amounts. Details remain to be worked out and there is a risk that the storm could cut toward the Great Lakes Region. The ENSO Region 1+2 anomaly was +1.6°C and the Region 3.4 anomaly was +2.0°C for the week centered around December 20. For the past six weeks, the ENSO Region 1+2 anomaly has averaged +1.75°C and the ENSO Region 3.4 anomaly has averaged +1.98°C. A basinwide El Niño event is ongoing. The SOI was +12.20 today. The preliminary Arctic Oscillation (AO) was -1.865 today. Strong blocking in the final week of November, as occurred this year, has often been followed by frequent blocking in December and January. 55% of days in December saw the AO below 0.000, including 39% where the AO was -1.000 or below. On December 29 the MJO was in Phase 1 at an amplitude of 1.993 (RMM). The December 28-adjusted amplitude was 2.103 (RMM). 3 Link to comment Share on other sites More sharing options...
donsutherland1 Posted December 31, 2023 Share Posted December 31, 2023 The warmest year on record globally is coming to a close. Numerous U.S. cities, including New York City, also experienced their warmest year on record. Some highlights: 3 Link to comment Share on other sites More sharing options...
bluewave Posted January 1, 2024 Share Posted January 1, 2024 The historic winter warmth pattern since December 2015 continues. A record breaking 19 warmer winter months out of the last 25. These were the 3 warmest consecutive winter months for NYC beginning with last Janaury. NYC Dec 23..+5.5 Feb 23…+5.2 Jan 23…+9.8 Dec 22…-0.6 …………..+4.8 Feb 22….+1.4 Jan 22….-3.2 Dec 21….+4.7 ……………..+1.0 Feb 21….-1.7 Jan 21….+1.1 Dec 20…+1.7 …………..+0.4 Feb 20…+4.8 Jan 20….+6.5 Dec 19….+0.8 …………….+4.0 Feb 19….+0.9 Jan 19….-0.1 Dec 18…+2.6 …………….+1.1 Feb 18…+6.7 Jan 18….-0.9 Dec 17…..-2.5 …………….+1.1 Feb 17…..+6.3 Jan 17….+5.4 Dec 16….+0.8 …………….+4.2 Feb 16….+2.4 Jan 16….+1.9 Dec 15….+13.3 …………….+5.9 Link to comment Share on other sites More sharing options...
donsutherland1 Posted January 1, 2024 Share Posted January 1, 2024 On 12/24/2023 at 8:08 AM, donsutherland1 said: Some week ahead maps and numbers. Cooler air moves in near the end of the month. Prospects for snowfall remain low. Final Numbers: Warmer than had been shown. 1 Link to comment Share on other sites More sharing options...
LibertyBell Posted January 2, 2024 Share Posted January 2, 2024 On 12/31/2023 at 4:44 PM, donsutherland1 said: New York City's second warmest December on record is concluding with a monthly mean temperature of 44.6° (5.5° above normal). 2023 has become New York City's warmest year on record with an annual mean temperature of 58.0° (old record: 57.4°, 2012). Additional cities in the Northeast experiencing their warmest year on record included: Albany, Baltimore, Islip, Newark, Sterling, and Worcester. The first week of January will likely feature generally near normal to somewhat above normal temperatures. Severe cold is unlikely. Initially, the arrival of a colder regime could coincide with a drier one, so snowfall prospects will remain limited until near the end of the week or start of the following week. There is the possibility that a storm could bring measurable snowfall to the region during January 7-8 with interior sections likely to see the largest amounts. Details remain to be worked out and there is a risk that the storm could cut toward the Great Lakes Region. The ENSO Region 1+2 anomaly was +1.6°C and the Region 3.4 anomaly was +2.0°C for the week centered around December 20. For the past six weeks, the ENSO Region 1+2 anomaly has averaged +1.75°C and the ENSO Region 3.4 anomaly has averaged +1.98°C. A basinwide El Niño event is ongoing. The SOI was +12.20 today. The preliminary Arctic Oscillation (AO) was -1.865 today. Strong blocking in the final week of November, as occurred this year, has often been followed by frequent blocking in December and January. 55% of days in December saw the AO below 0.000, including 39% where the AO was -1.000 or below. On December 29 the MJO was in Phase 1 at an amplitude of 1.993 (RMM). The December 28-adjusted amplitude was 2.103 (RMM). wow you'd think that a month which averaged a -AO would be much colder than it actually was. How negative was the NAO, Don? Link to comment Share on other sites More sharing options...
donsutherland1 Posted January 2, 2024 Share Posted January 2, 2024 16 minutes ago, LibertyBell said: wow you'd think that a month which averaged a -AO would be much colder than it actually was. How negative was the NAO, Don? Both the NAO and EPO were predominantly positive during December. 1 Link to comment Share on other sites More sharing options...
LibertyBell Posted January 2, 2024 Share Posted January 2, 2024 18 minutes ago, donsutherland1 said: Both the NAO and EPO were predominantly positive during December. what causes the AO and NAO to decouple? I've noticed we've seen this a lot in the last few winters. Link to comment Share on other sites More sharing options...
donsutherland1 Posted January 2, 2024 Share Posted January 2, 2024 2 hours ago, LibertyBell said: what causes the AO and NAO to decouple? I've noticed we've seen this a lot in the last few winters. Climate change is likely playing an important role through the impact of a warming North Pacific Ocean. There was a paper on this in 2021: https://www.nature.com/articles/s41558-020-00966-8 2 Link to comment Share on other sites More sharing options...
wdrag Posted January 3, 2024 Share Posted January 3, 2024 For the record nationally: inclusive of our own top 10 wettest Dec, some climate sites top 5. Top 3 warmest. snapshot via CP, EWR, ABE for both temp/qpf vs yearly reality. 1 Link to comment Share on other sites More sharing options...
doncat Posted January 3, 2024 Share Posted January 3, 2024 My station on si... Dec tied for 2nd warmest behind the ridiculous 2015... Precip of 7.67" was 2nd wettest. Nov actually had a lower mean min temp than Dec. Yearly it was my 2nd warmest just behind 2012.... Total Precipitation of 56.67" was about 7" above normal. Based on 46 years of record. 2 Link to comment Share on other sites More sharing options...

Recommended Posts
Create an account or sign in to comment
You need to be a member in order to leave a comment
Create an account
Sign up for a new account in our community. It's easy!
Register a new accountSign in
Already have an account? Sign in here.
Sign In Now