All Activity
- Past hour
-
62 now. Clouds and cooler today with some showers. Onshore E'rly /NE flow kicks in overnight setting up a chilly , raw and rainy Friday - stuck in the 50s. Cloudy cool mother's day weekend. Overall cool, and cloudy 8 of the next 10 days, with rain chances. Cloudy this weekend and extended guidance has a cloudy , rain next weekend too. Period 5/9 - 5/18 cooler/wetter overall. Next shot at 70s or 80s Mon (5/13)or Tue (5/14)brief reprieve.
-
Yesterdays highs: ACY: 90 EWR: 89 PHL: 88 BLM: 87 LGA: 86 TEB: 86 New Brnswck: 86 TTN: 85 NYC: 84 JFK: 80 ISP: 70
-
Wait, were you channeling the ghost of Earl Weaver?
-
The HRRR was really the only model that ever went all in on this scenario, but it really backed off yesterday evening.
-

May 2024 Discussion - Welcome to Severe Season!!!!
drstuess replied to weatherwiz's topic in New England
Hail here was solid. I did not get outside and grab any pics, but my neighbor sent these over this morning. And this from local fb -

Extended summer stormlover74 future snow hole banter thread 23
bluewave replied to BxEngine's topic in New York City Metro
We have actually seen a shift in the way the -PDO has been manifesting in recent years. It’s now defined by the 2nd EOF which is being driven by the extreme marine heatwave east of Japan. So this is the first El Niño around +2.0 or higher with a -2.09 PDO in April. https://www.ncei.noaa.gov/pub/data/cmb/ersst/v5/index/ersst.v5.pdo.dat https://www.nature.com/articles/s43247-023-00839-wIn this study, we evaluate the ocean warming pattern derived from four decades of satellite measurements. We find widespread strong subtropical ocean warming, concentrating mostly on the western ocean basins. In contrast to these observations, studies of paleoclimate suggest that the greatest ocean warming occurs at higher latitudes. By pairing the observed warming pattern with SST evolution in long-term climate simulations, we propose that the observed warming pattern is constrained by ocean dynamics of surface convergence (downwelling, subtropical gyres) and divergence (upwelling, subpolar gyres) rather than being dominated by internal variabilities, such as the https://agupubs.onlinelibrary.wiley.com/doi/full/10.1029/2022GL101078 The fundamental result of this study is that the first EOF of SST in the North Pacific has changed starting in 2014. For more than 20 years, the PDO has been used to describe the state of the North Pacific. However, since the marine heatwave of 2014, there have been remarkable changes to the dominant mode of SST in the North Pacific. The spatial pattern of the first EOF of SST from 1950 to 2021 is notably different from the PDO, suggesting that though the PDO served as a useful metric of SST variations until 2014 (Johnstone & Mantua, 2014), it may no longer be as effective a climate index for the North Pacific. From 1950 until the 2014 MHW, the first EOF remained consistent in its proportion of positive and negative regions with both taking up roughly half the area of the North Pacific (and with the positive region taken to be the eastern Pacific). When EOFs are calculated from 1950 to endpoints after 2014, the first EOF has a maximum positive region covering 77% of the North Pacific, with a PC indicating the largest anomalies on record. These changes to the first EOF/PC of North Pacific SST are nothing short of remarkable. In concert with these changes, the second EOF/PC of SST has also undergone profound evolution since 2014. This second EOF now accounts for approximately 18% of the variability, growing from 13% during the 1950–2013 period. The spatial structure of the second EOF now is positive over almost the entire basin, with a PC that has grown strongly positive in the last several years. Thus, the second EOF/PC describes warming over much of the Pacific not in the positive lobe of the first -
A nice refresher here with 0.44". Pushing 1.5" for May.
-
Yup, going to be rainy tomorrow
-
They really cut back on rain forecast.
-
Too bad we couldn’t get southward corrections like this during the winter. New run Old run


- 391 replies
-
- 2
-

-

-
- spring
- dry weather
- (and 3 more)
-
I smoked 2 packs and drank a 5th between inning 9 and 12
-
Lush spring, no question. Been awhile. Shame about the cicada thing.
-
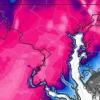
satellite imagery is not encouraging at all
-
PHL has had a similar amount of 90° days since 2010 as more rural to suburban COOP sites in NJ. Monthly Number of Days Max Temperature >= 90 for PHILADELPHIA INTL AP, PA Click column heading to sort ascending, click again to sort descending. Year Apr May Jun Jul Aug Sep Oct Season Mean 0 2 6 15 9 3 0 35 2023 0 0 1 13 3 7 0 24 2022 0 3 5 19 19 2 0 48 2021 0 3 9 10 15 0 0 37 2020 0 0 5 21 10 0 0 36 2019 0 1 4 18 8 3 1 35 2018 0 1 4 11 10 4 0 30 2017 0 3 6 11 4 2 0 26 2016 0 3 5 16 17 5 0 46 2015 0 1 7 10 12 7 0 37 2014 0 0 3 11 3 2 0 19 2013 0 3 4 12 0 1 0 20 2012 0 2 7 21 8 1 0 39 2011 0 3 5 21 4 0 0 33 2010 0 2 15 19 12 7 0 55 Monthly Number of Days Max Temperature >= 90 for HIGHTSTOWN 2 W, NJ Click column heading to sort ascending, click again to sort descending. Year Apr May Jun Jul Aug Sep Oct Season Mean 0 2 6 15 9 3 0 35 2023 0 0 2 18 5 6 0 31 2022 0 3 3 22 19 2 0 49 2021 0 3 10 14 13 1 0 41 2020 0 0 5 23 13 1 0 42 2019 0 0 4 16 10 4 1 35 2018 0 3 4 12 13 4 0 36 2017 0 3 6 11 4 2 0 26 2016 0 4 4 17 16 5 0 46 2015 0 3 7 9 10 7 0 36 2014 0 0 7 12 2 6 0 27 2013 0 1 7 11 0 2 0 21 2012 1 2 6 16 5 1 0 31 2011 0 2 4 16 5 0 0 27 2010 1 3 10 17 11 6 0 48 Monthly Number of Days Max Temperature >= 90 for FREEHOLD-MARLBORO, NJ Click column heading to sort ascending, click again to sort descending. Year Apr May Jun Jul Aug Sep Oct Season Mean 0 2 6 15 8 3 0 34 2023 0 0 1 13 0 4 0 18 2022 0 2 4 22 11 3 0 42 2021 0 3 14 13 12 1 0 43 2020 0 0 6 18 14 2 0 40 2019 0 0 4 16 8 4 1 33 2018 0 5 7 15 17 4 0 48 2017 0 3 5 10 4 2 0 24 2016 0 4 2 16 14 6 0 42 2015 0 0 4 10 13 7 0 34 2014 0 0 4 10 0 5 0 19 2013 0 1 7 12 0 2 0 22 2012 1 1 5 17 5 1 0 30 2011 0 0 3 16 5 0 0 24 2010 1 3 12 19 12 5 0 52
-
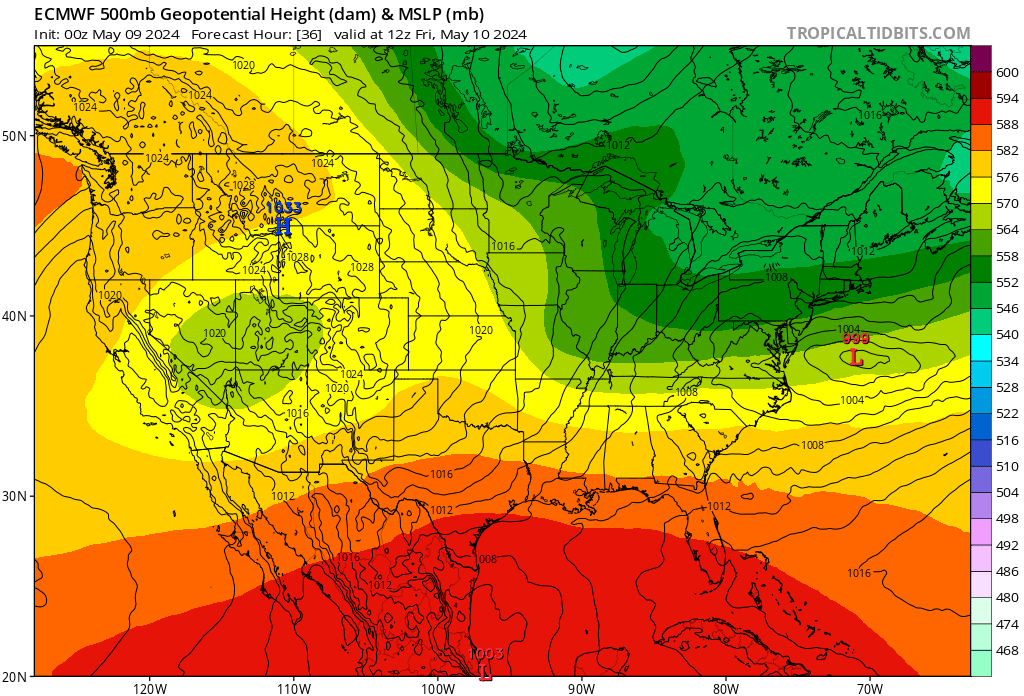
Rain amounts look paltry for much of the area through Saturday evening on the 6z GFS.
-
Another soaker, gonna look so nice this weekend
- Today
-
May is shaping up to be a dreary boring dud. Oh look.. another cloudy damp morning. Shocker
-
Today looks decent. Even tomorrow rain north and east of the city could be limited. Euro however is wet for everyone.
-

May 2024 Discussion - Welcome to Severe Season!!!!
Damage In Tolland replied to weatherwiz's topic in New England
Back in the days when it snowed https://x.com/nwsboston/status/1788524313634816060?s=46&t=dhcbvkjmRcyBVQtDxJ3lRg -
Of course, we rescheduled our event for today and now it looks like it won't rain until late in the day.
-

2024 Hurricane season forecast contest -- enter by June 1st
CHSVol replied to Roger Smith's topic in Tropical Headquarters
25/12/5 -
We got missed in every direction Tuesday, but I had like 1.5” over the weekend so I’m not too mad about it. Wouldn’t mind a boomer though…
-
The Garden was rocking
- 391 replies
-
- 1
-
-
- spring
- dry weather
- (and 3 more)
-
Feels like models in general have played up the rain this week that hasn't happened. I wasn't expecting periods of rain but I haven't seen a drop.
-
hell yeah to the palms


.thumb.jpeg.56a9ebf712d5b807b01f737fdf2721c2.jpeg)