Search the Community
Showing results for tags 'heat'.
Found 21 results
-
Will we see our first heatwave? Severe weather? Or just a continuation of average to below average precip, above average temps and windy conditions?
-
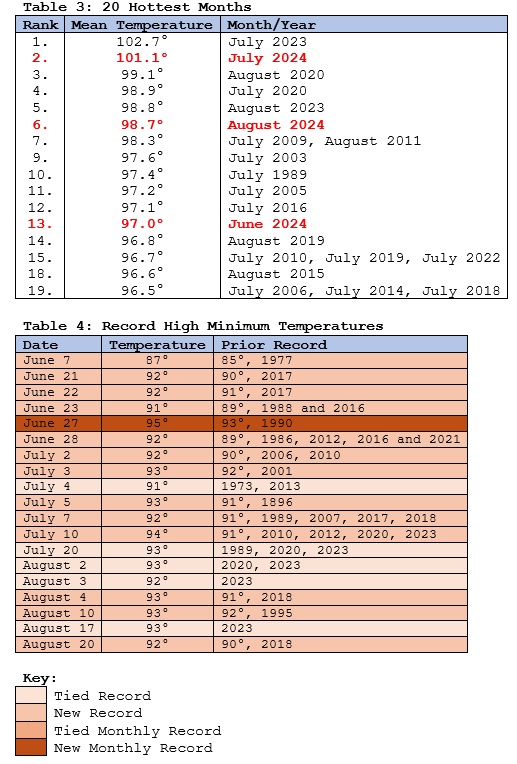
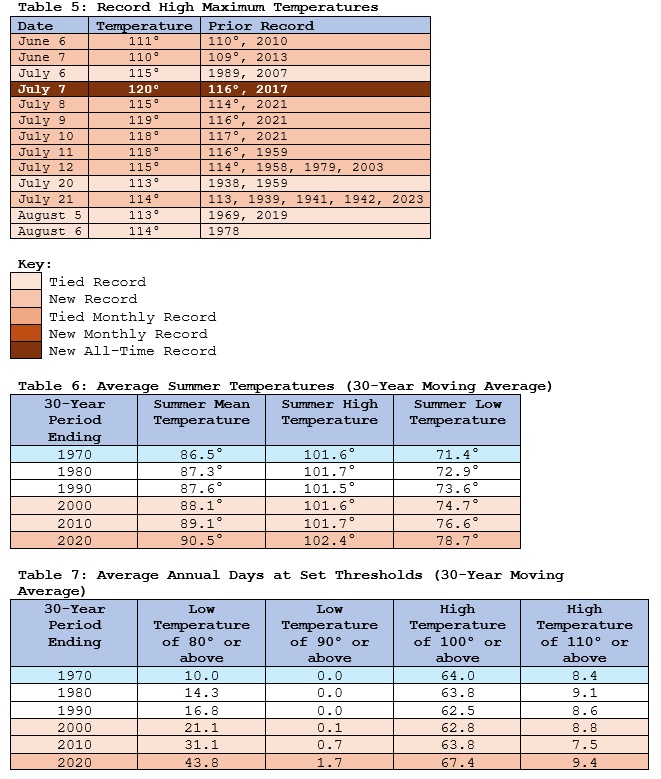
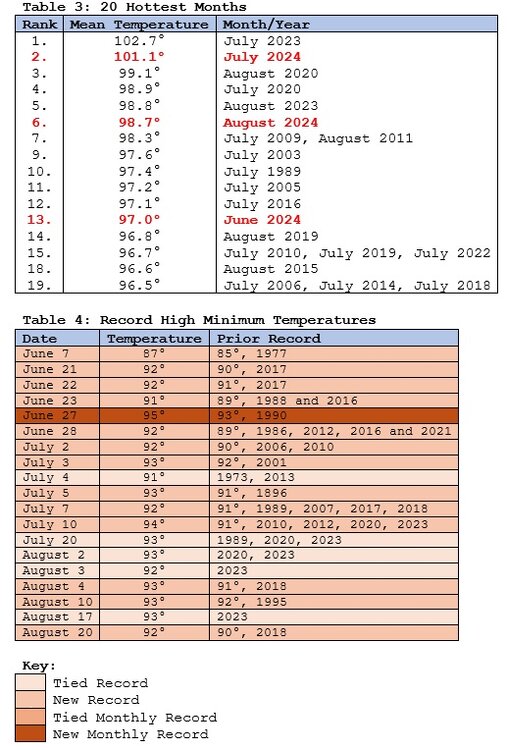
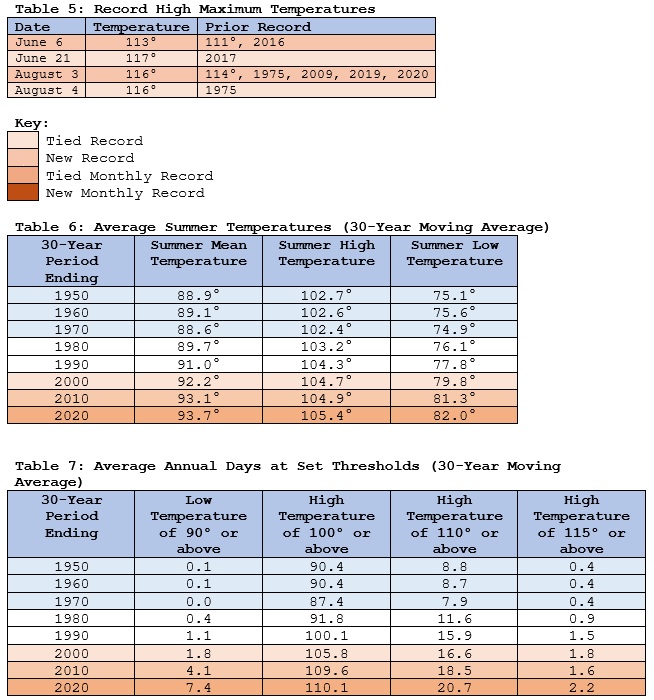
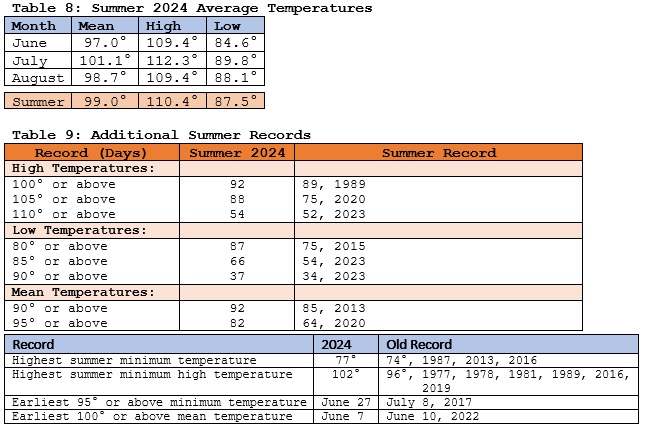
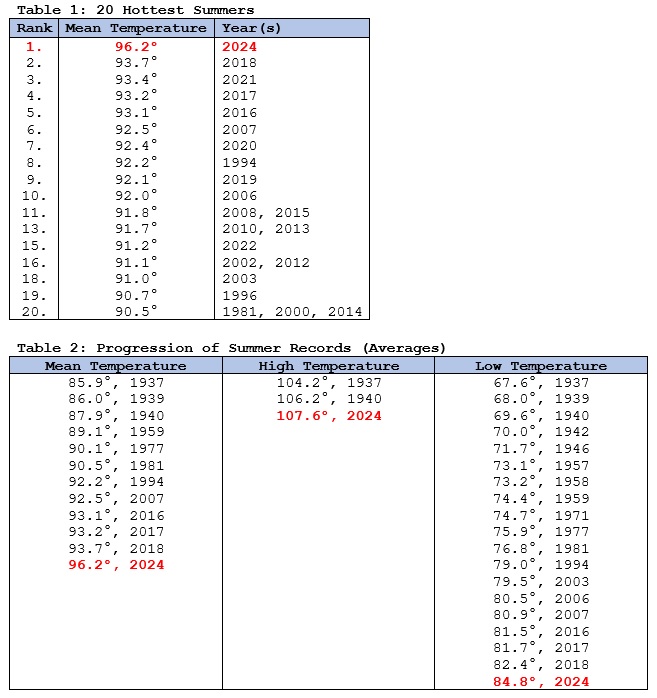
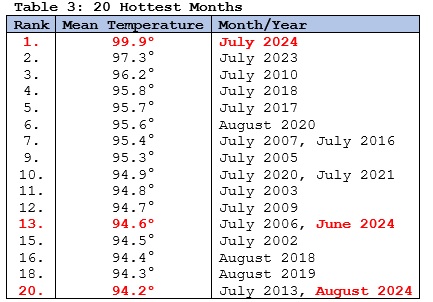
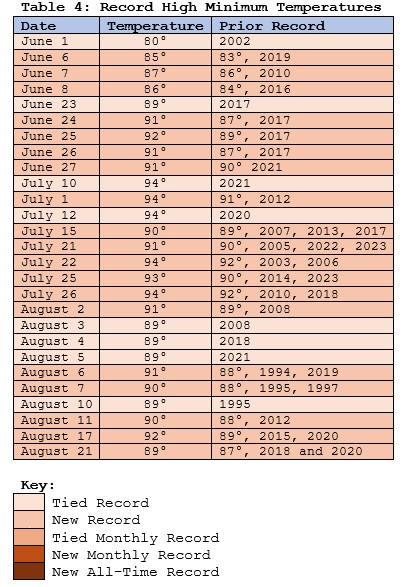
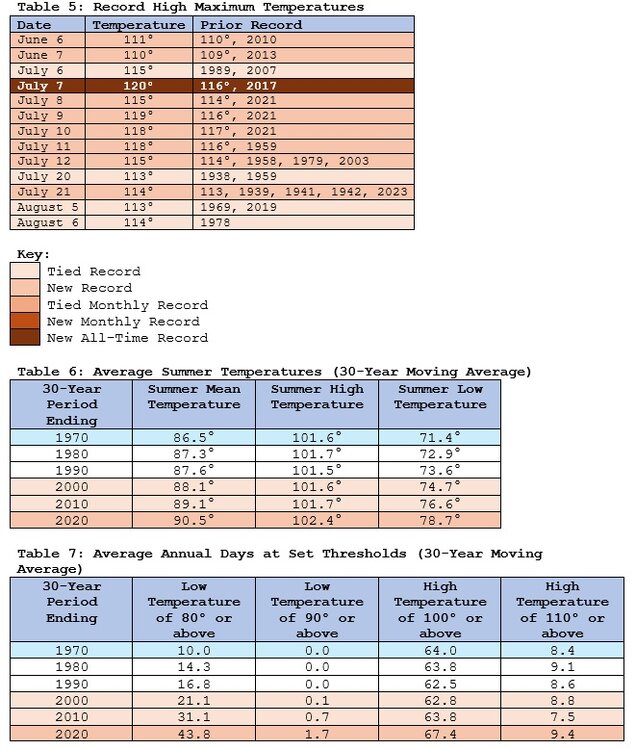
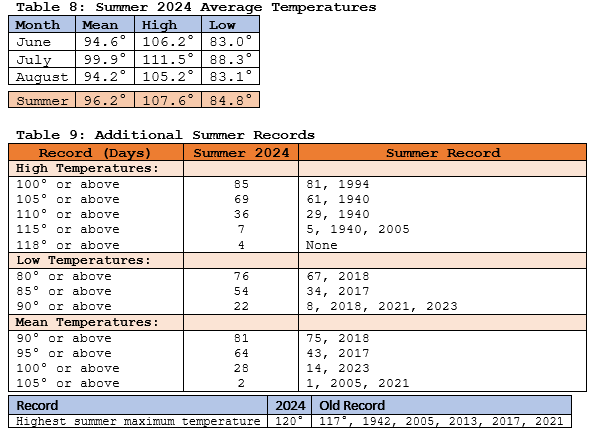
 In what has become a seemingly regular occurrence beginning in 2020, Phoenix has experienced its hottest summer on record. Since 2020, Phoenix has eclipsed the summer mark in 2020, 2023, and again this year. A major theme, as was the case in 2020 and 2023 when the heat set in, was its persistence. Summer 2024 got off to a blazing start with its hottest June, by far, on record. The sizzling June was followed by Phoenix’s second hottest July and second hottest month on record. July featured an 11-day extreme heat event (Clarke et al., 2014 methodology) during which the temperature reached or exceed 115° on six days. That was the second longest such event on record. Summer concluded with the third hottest August on record. On account of the historic heat, Phoenix saw its longest stretches of 80° or above lows, 100° or above highs, and 105° or above highs: 80° or above lows: 74 days, June 5-August 17; old record: 51 days, July 1-August 20, 2023 100° or above highs: 97 days (as of August 31 and ongoing); old record: 76 days, June 10-August 24, 1993 105° or above highs: 63 days, June 5-August 6; old record: 56 days, June 24-August 18, 2023 Anthropogenic climate change amplified by the urban heat island effect is driving a warming of Arizona’s and Phoenix's summers. Data from a joint May 2024 report published by Climate Central, Red Cross Red Crescent Climate Centre and World Weather Attribution revealed that the influence of climate change has resulted in a 231.1% increase in Arizona’s days with temperatures above the 90th percentile (1991-2020 baseline) over the figure expected without the influence of climate change. The warming has accelerated in recent decades. Between 1950 and 2023, summers have warmed by 0.6° per decade in Phoenix. Since 1980, summers have warmed by 0.9° per decade. As a result, Phoenix has set summer records in 2020, 2023, and now 2024. As a result, the annual number of days on which the high temperature has exceeded the 90th percentile for summer maximum readings (1991-2020 baseline) has increased from 6.5 days during 1961-1990 to 9.99 days during 1991-2020. The most recent 30-year moving average (1995-2024) is 12.7 such days per year (through August 31, 2024). Select highlights: Updates: Phoenix records 100th 80° low temperature of the year Progression of Phoenix's Record Streak of 100° Highs Phoenix and Surrounding Area 100° Highs and 80° Lows U.S. Sites with 110 or More Consecutive 100° Highs and Population Hottest Last 7 Days of September Phoenix Experiences its Hottest September on Record Phoenix's Extreme September 28th and October 1st High Temperatures Phoenix Experiences its Hottest First Week of October on Record Phoenix Sets or Ties Daily High Temperature Records on an Unprecedented 21 Consecutive Days Climate Change not the Urban Heat Island Effect drove Phoenix's Record Autumn Heatwave Southwest Region Summer Trends Phoenix Follows its Hottest Summer with its Warmest Fall on Record Phoenix Caps Off its Warmest Year with Its Warmest December on Record
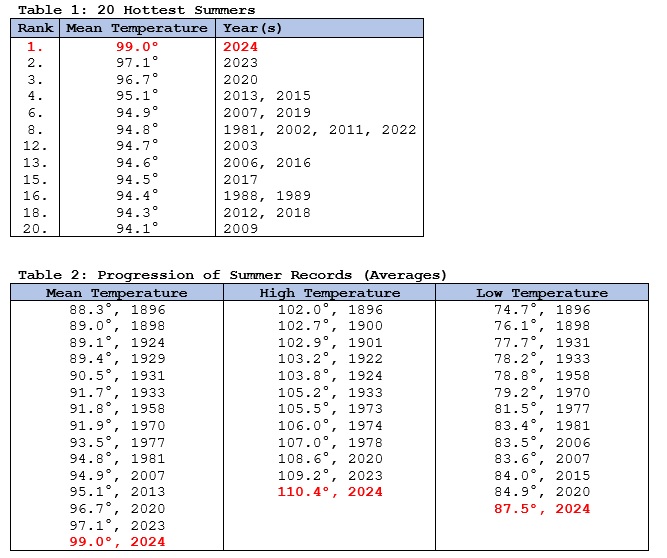
-
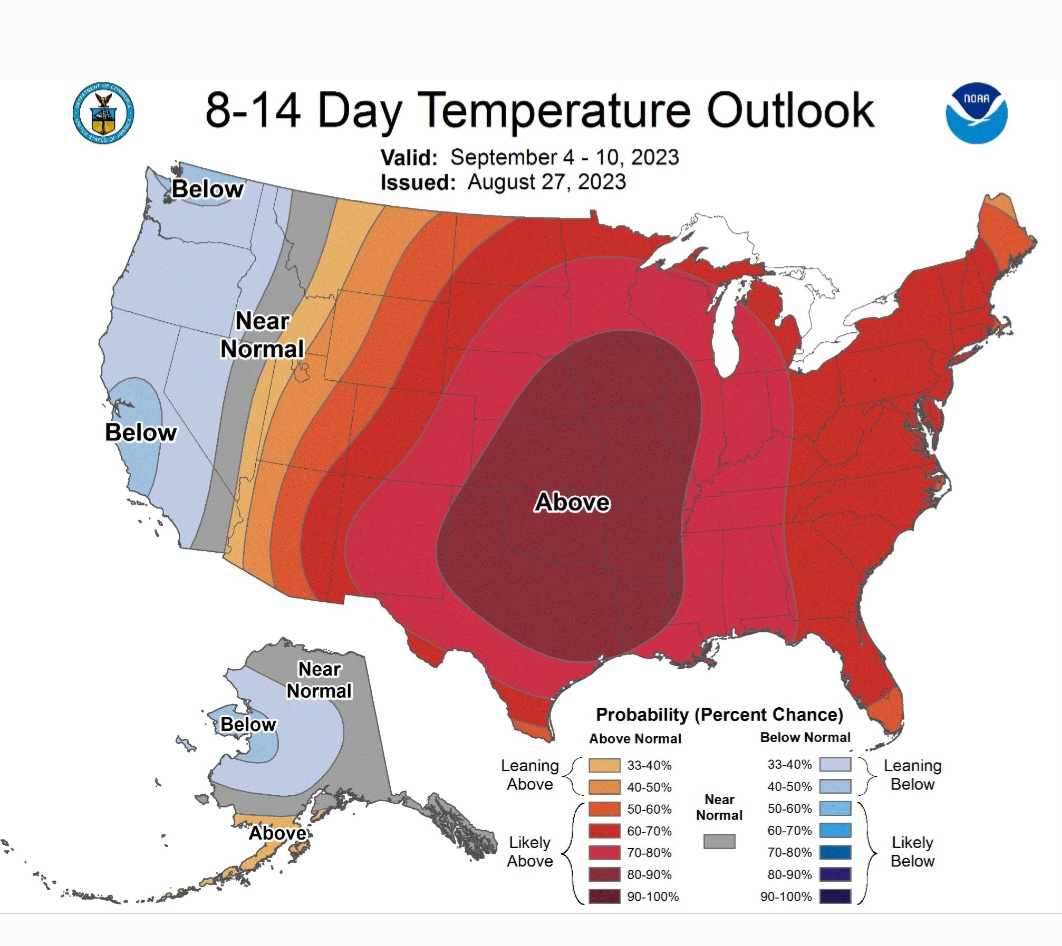
The boring season continues here but the first two weeks of Met summer look favorable as far as us not roasting goes. The 6-10 day and 8-14 day outlook favors BN temps and near to bn precip. The first two days of met summer have produced low 70s yesterday and only mid-60s at 1pm here with rainfall both days. The countdown is on until the first true cold front of fall.
- 688 replies
-
- 1
-

-
- heat
- thunderstorms
- (and 7 more)
-
After a brief hiatus following three consecutive record hot summers (2016-2018), Las Vegas demolished its summer heat record. Summer 2024 got off to a blistering start with its hottest June on record. July became that City’s hottest month on record. August also became its hottest August on record. July featured a 12-day extreme heat event (Clarke et al., 2014 methodology) during which the temperature reached or exceed 115° on a record seven consecutive days. That extreme heat event was highlighted by Las Vegas’ hottest reading on record (120°) and three other temperatures that surpassed the old all-time mark of 117°. On account of the historic heat, Las Vegas saw its longest stretches of 80° or above lows, 105° or above highs, 110° or above highs, and 115° or above highs: 80° or above lows: 63 days, June 21-August 22; old record: 33 days, July 4-August 5, 2020 105° or above highs: 43 days, June 20-August 1; old record: 25 days, June 15-July 9, 2017 110° or above highs: 11 days, July 3-13; old record: 10 days, June 17-26, 1961 and July 14-23, 2023 115° or above high: 7 days, July 6-12; old record: 4 days, July 16-19, 2005 Anthropogenic climate change amplified by the urban heat island effect is driving a warming of Las Vegas’ summers. The warming has accelerated in recent decades. Between 1950 and 2023, summers have warmed by 0.8° per decade in Las Vegas. Since 1980, summers have warmed by 1.0° per decade. Select highlights:
-
Tropics are potentially heating up. Let's get things rolling.
-
July looks to start dry and pleasant before heat starts to build around the 4th
-
A heatwave of potentially unprecedented proportions for parts of the Pacific Northwest Region, including Oregon, Washington, and British Columbia is now in its early stages of evolving. June high temperature records will likely be shattered across much of the region. Numerous all-time high temperature records will likely be challenged or broken. On Monday, the most populated region in the Pacific Northwest could see widespread temperature anomalies more than 4 standard deviations above the normal figures. A small part of the region could experience temperatures more than 6 standard deviations above normal. Standardized Temperature Anomalies (6/28 18z): Select June, All-Time Records, Forecast Maximum Temperatures: Western sections of Oregon, Washington, and British Columbia, including Portland, Seattle, and Vancouver, will likely see the highest temperatures during the June 26-29 period. Elsewhere, exceptional warmth could persist into the opening days of July. Minimum temperatures will also approach monthly and all-time lows, especially in areas affected by the Urban Heat Island (UHI) effect, namely Portland, Seattle, and Vancouver. Climate change is increasing the frequency, magnitude, and duration of extreme heat events. One important mechanism is through wave resonance events (Mann et al., 2017). If one steps back to a larger hemispheric perspective starting near the beginning of June, one has witnessed the emergence of mega-heat domes in a "whack-a-mole" fashion in the Northern Plains, Southwest, and northern and eastern Europe (including northwestern Russia) that led to record heat, including some monthly or all-time record high temperatures. This latest heat dome is the fourth such major event this month. Updates: Recurrent Rossby Waves, Heatwaves, and Climate Change June 27, 2021: New Canadian National High Temperature Record June 28, 2021: New Canadian National High Temperature Record June 29, 2021: New Canadian National High Temperature Record Unprecedented North American Heatwave Scorches the Pacific Northwest Historic Nature of the Heatwave Attribution Study: 'Virtually Impossible' without Climate Change
-
It's coming

-
As we begin summer it looks like we'll start off the month with some heat. 90 in the normally hot spots and continued very dry the first week
-
Now the dreaded season (for me) is upon us. Heat, storms, flooding and waiting on that first cold front in September to arrive and seeing those first lows in the 40s. I don't know what the summer will bring, but we know it will be hot and humid. Severe season is already off to a bad start with the tornado outbreak that spurred a lot of fatalities last week. I know it can't be avoided but I hope we don't have any more this spring.
- 295 replies
-
- 4
-
-

-
- severe weather
- frosts
- (and 5 more)
-
More heat, humidity and thunderstorms?? Go!
-
More of the same or will we finally get a heatwave?
-
Starting tomorrow, Phoenix will experience its hottest weather so far this year. High temperatures will very likely peak above 110 degrees on multiple days. The hottest days will likely be Friday-Sunday.
-
 Meteorological Spring hits March 1st, thus begins the quiet season on the forums. This thread should suffice until fall for any long range disco. I doubt the last flakes have fallen this year but I don't really expect another widespread winter threat either. It was definitely a Plateau to Western Tennessee winter. Tough for Eastern areas not to do any better with virtually the entire month of January being BN for temps. The flood threat, as it always seems to be these days, is definitely elevated again this spring. The severe threat, I'll leave that to Jeff, Jax, and the rest of the severe gurus.
 -
Well, we are just one season away from winter. Nice to have a respite from the heat this week as the remnants of Ida depart the area. Thoughts and prayers for all of those affected by the hurricane along the Gulf Coast. Rainfall along the far eastern valley has been steady but reasonable - more as you go west I am nearly certain. This morning features light rain/drizzle and very low cloud decks. Lows in the northern valley are supposed to get into the 50s during the next few nights, and that is welcome news! Saw the first evidence of maples beginning to change color this morning. There is this one maple in our neighborhood which always changes first. Some of the dogwoods are beginning to show red in their leaves. Sycamores along the river are showing some yellow. For sure, some of that could be heat stress. Well, it is the first day of meteorological fall. I suspect this season will feature a quick snap to winter time temps late in the season. I am thinking warm early-mid fall, and then a sudden flip to cold. Somebody please fire-up an obs thread and also a banter thread for fall.
-
Might this be an interesting first half of September for late season heat and mid season Tropical cyclones into the NYC area??? Have even less clue about the latter half of September. Modeling does imply a warm first week of September, with a weakness in the Gulf States. That weakness is possibly related to tropical cyclones trying to run northward into or toward the the Gulf Coast states, and then find the weakness in the broad coast-coast southern USA 500MB ridge, tending to head northeast along or the interior of the East Coast. How far north might they travel, if this implied pattern is generally correct? Applied the NOAA.GOV CPC week 1-4 forecasts issued the 20th-22nd, and the September update from 8/15, as well as the 12z/22 GEFS 500 mb members, and 12z/22 NAEFS mean sfc temperature departure from normal for the period Aug 30-Sept 6. This does not mean NYC is heading for possibly another 10" month, but does suggest we're in a pattern that favors normal or above normal both for precip/temp this September in our NYC subforum. Long ranging beyond a week or two is not easy, and so this topic starter is just that... a tease of implied potential that can become wrong. MJO forecasts were not attempted to be applied.
-
Spring has sprung and it's brought rain again this year. After a fairly dry two weeks that actually had a few brush fires in the area the rain has returned. 2.75 inches in the last 24 hours. A 3+ inch event last week. Suddenly the "dry" March is well AN on rainfall imby with over 7 inches so far. A dry Friday looks like it's going to give way to another bout of heavy rain Saturday into Sunday. Possibly another 10 inch month this month. Had more of them in the last 24-30 months than most 10 year periods produce.
-
WAR? Will the Western Atlantic Ridge reassert itself and result in the verification of previous many long range outlooks of above to much above normal temps for August here in the NY area? And if so, when does the Atlantic Basin fire up? I see as of this 7/24 writing that our tropical topic posters seem to expect week two or three of August for activity getting going? SST ANOM's don't look exciting (to me) but these can change. Certainly the + anoms well north of HAT (especially New England) can feed or extend the life of TC's north of Hatteras.
-
We don't get a ton of activity once severe season ends, so this thread should carry us til September/Fall.
-
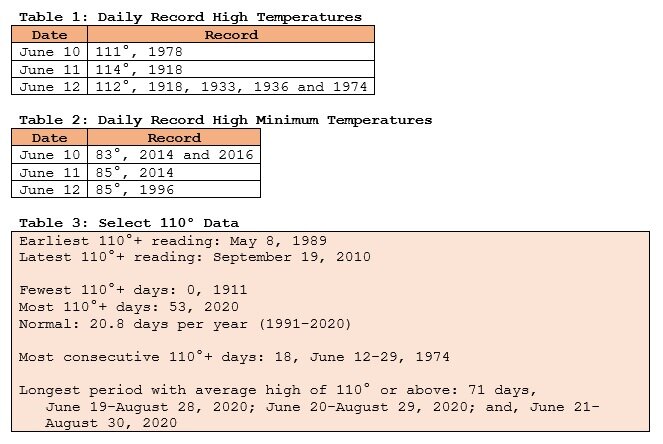
Last year, Phoenix experienced a historically hot summer. Although the extreme heat held off through May this year, a severe heatwave developed toward mid-June. The June 2021 heatwave was among Phoenix's and Tucson's most severe June heatwaves and their most severe heatwave this early in the season. This heatwave developed as an extreme upper air ridge evolved during an era of rising June temperatures and an ongoing drought. An extreme heat event commenced at Tucson on June 11 and it commenced at Phoenix on June 13. Such events are likely to become even more frequent in the years ahead. Anthropogenic warming is creating a growing likelihood of long-duration extreme events through more frequent wave resonance events (Kornhuber et al., 2016 and Mann et al., 2017). Already, the frequency and intensity of compound summertime hot extremes (events that combine daytime and nighttime heat where such temperatures are above their 90th percentile for their calendar) has been increasing especially in geographic locations that include the U.S. Southwest (Wang 2020). The increase in forcing associated with anthropogenic greenhouse gases is the dominant driver of this outcome (Wang 2020). Table 1: Phoenix's High Temperatures during June 12-20, 2021 Table 2: Phoenix's Average June Temperatures (30-Year Moving Average) Table 3: Phoenix's Record High Maximum Temperatures Table 4: Phoenix's Record High Minimum Temperatures A portion of this heatwave qualified as the 8th Extreme Heat Event (EHE) on record for June, as at least 3 days saw the maximum , temperature exceed the 97.5th percentile (Phoenix: 115° or above; Tucson: 110° or above), the high temperature average exceeded the 97.5th percentile (Phoenix: 115° or above; Tucson: 110° or above), and all high temperatures exceeded the 81st percentile (Phoenix: 110° or above; Tucson: 105° or above) in June-August high temperatures for the 1971-2000 base period (Clarke, et al.,2014). The extreme heat event began on June 11 in Tucson and June 12 at Phoenix. Table 5: Phoenix's Extreme Heat Events in June (1896-2021) Additional Records: Earliest 116° or above high temperature: June 17, 2021 (old record: June 19, 2016 and 2017) Earliest 4 consecutive 115° days: June 15-18, 2021 (old record: June 19-22, 1968) Most consecutive 115° days: 6, June 15-20, 2021 (old record: 4, June 19-22, 1968; June 25-28, 1979; June 25-28, 1990; July 26-29, 1995; July 28-31, 2020; and, August 16-19, 2020) Earliest 4-day average high temperature of 115° or above: June 14-17, 2021 (old record: June 18-21, 2017) Earliest 5-day average high temperature of 115° or above: June 14-18, 2021 (old record: June 17-21, 2017) Earliest 6-day average high temperature of 115° or above: June 13-18, 2021 (old record: June 18-23, 2017) Earliest 7-day average high temperature of 115° or above: June 13-19, 2021 (old record: June 18-24, 2017) Earliest 8-day average high temperature of 115° or above: June 13-20, 2021 (old record: June 18-25, 2017) Earliest mean temperature of 100° or above: June 15, 2021 (old record: June 17, 2008) Earliest 2-day average mean temperature of 100° or above: June 15-16, 2021 (old record: June 17-18, 2008 and 2015) Earliest 3-day average mean temperature of 100° or above: June 14-16, 2021 (old record: June 17-19, 2015) Earliest 4-day average mean temperature of 100° or above: June 14-17, 2021 (old record: June 18-21, 2017) Earliest 5-day average mean temperature of 100° or above: June 13-17, 2021 (old record: June 18-22, 2017) Earliest 6-day average mean temperature of 100° or above: June 13-18, 2021 (old record: June 18-23, 2017) Earliest 7-day average mean temperature of 100° or above: June 13-19, 2021 (old record: June 18-24, 2017) Earliest 8-day average mean temperature of 100° or above: June 12-19, 2021 (old record: June 17-24, 2017) Earliest 91° minimum temperature: June 17, 2021 (old record: June 22, 2017) Earliest 92° minimum temperature: June 18, 2021 (old record: June 25, 2017) Earliest 2 consecutive 90° low temperatures: June 16-17, 2021 (old record: June 21-22, 2017) Earliest 3 consecutive 90° low temperatures: June 16-18, 2021 (old record: June 29-July 1, 2013) Earliest 4 consecutive 90° low temperatures: June 16-19, 2021 (old record: July 8-11, 2020) Most consecutive 90° low temperatures in June: 4, June 16-19, 2021 (old record: June 26-27, 1990; June 29-30, 2013; June 26-27, 2016; June 21-22, 2017; and, June 25-26, 2017) Earliest 2-day average low temperature of 90° or above: June 16-17, 2021 (old record: June 21-22, 2017) Earliest 3-day average low temperature of 90° or above: June 16-18, 2021 (old record: June 24-26, 2017) Earliest 4-day average low temperature of 90° or above: June 16-19, 2021 (old record: July 4-7, 2018) Earliest 5-day average low temperature of 90° or above: June 16-20, 2021 (old record: June 22-26, 2017) Earliest 6-day average low temperature of 90° or above: June 16-21, 2021 (old record: June 21-26, 2017) Highest average June minimum temperature after over 4 days: 91.0°, June 16-19, 2021 (old record: 89.8°, June 24-27, 1990; June 25-28, 1990; June 26-29, 1990; June 27-30, 1990; and, June 23-26, 2017) Highest average June minimum temperature after over 5 days: 90.6°, June 16-20, 2021 (old record: 90.0°, June 26-30, 1990 and June 22-26, 2017) Tucson also experienced extreme heat. As with Phoenix, Tucson has seen a steady increase in June minimum and maximum temperatures. This outcome has increased the statistical probability of extreme heat events. Table 1: Tucson's High Temperatures during the June 11-21, 2021 Heatwave Table 2: Tucson's Average June Temperatures (30-Year Moving Average) Table 3: Tucson's Record High Maximum Temperatures Table 4: Tucson's Record High Minimum Temperatures Table 5: Tucson's Extreme Heat Events in June Additional Records: Most consecutive days with high temperatures of 110° or above: 8, June 12-19, 2021 (old record: 6, June 24-29, 1994) Most consecutive days with high temperatures of 111° or above: 7, June 13-19, 2021 (old record: 6, June 24-29, 1994) Most consecutive days with high temperatures of 112° or above: 7, June 13-19, 2021 (old record: 4, June 25-28, 1990) Highest average high temperature over 8 days: 112.5°, June 12-19, 2021 (tied record set during June 23-30, 1994) Updates: Phoenix has its hottest June on record
- 33 replies
-
- 1
-
-
- heatwave
- extreme heat event
- (and 5 more)
-
Just borrowed on some of the on-going themes for July... as written in June threads, with past 40 year temperature trends supporting some of our posted long range statistical outlooks including those of CPC through today-June 28.