All Activity
- Past hour
-
Storm total here from most recent storm: Snowfall for the event: 13.5". Was tricky to measure mid and late storm with the increasing wind and sleet mixed in at times. Changed to sleet here for no more than 30 minutes mid afternoon then went back to snow with just a few periods on intermittent sleet until it ended about 9:00 last night. I'd say 95% of the storm here was snow. Snow depth from current storm at 8 this morning was 12" even - total snow depth (includes snow on the ground prior to this event and some compaction of new snow pack) is 14". Drifts on the north side of house 20-24", even a bit higher in a few spots. Waiting on the cylinder to melt down so I can get a melted total and a ratio.
-
January 2026 Short/Medium Range Thread
Holston_River_Rambler replied to John1122's topic in Tennessee Valley
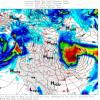
Here are the CIPS H5 analogs: I think it looks at the GFS's forecast and populates analogs from that. All CIPS has is the GFS as a base layer for comparison unfortunately. -

E PA/NJ/DE Winter 2025-26 Obs/Discussion
Duca892 replied to LVblizzard's topic in Philadelphia Region
Eagerly awaiting 12z GFS to see if it starts trending that way. Would be a biblical stretch of winter in the span of 10 days -
Damn euro is crazy and ai has been rock solid last storm…. We’re 5/6 days away
-
Went to sleep, and not only was the 0z euro good, 6z was insane too. EPS on board. Oh boy. And here I thought I’d catch up on sleep this week.
-
That’s almost exactly where the GFS had this back on Thursday last week at 977 mb
-
 2-4” is a good bet in eastern sections, regionally. More in east MA where I’d go 3-6” With -NAO and strong mid level vort never discount these little events. They surprise I’d get it if BL temps were marginal but it’s Alaska out there…
 -

-
Forky did mention a few days ago that he's looking forward to the period ending storm perhaps this is what Forky was referring to.
-

Central PA Winter 25/26 Discussion and Obs
TheClimateChanger replied to MAG5035's topic in Upstate New York/Pennsylvania
Snow depth is recorded at 7 am each day, so it won’t reflect the snow that fell after. -
Storm total here from most recent storm: Snowfall for the event: 13.5". Was tricky to measure mid and late storm with the increasing wind and sleet mixed in at times. Changed to sleet here for no more than 30 minutes mid afternoon then went back to snow with just a few periods on intermittent sleet until it ended about 9:00 last night. I'd say 95% of the storm here was snow. Snow depth from current storm at 8 this morning was 12" even - total snow depth (includes snow on the ground prior to this event and some compaction of new snow pack) is 14". Drifts on the north side of house 20-24", even a bit higher in a few spots. Waiting on the cylinder to melt down so I can get a melted total and a ratio.
-

January 24-26: Miracle or Mirage JV/Banter Thread!
adelphi_sky replied to SnowenOutThere's topic in Mid Atlantic
Quick question. Just thinking when is the best time to restock on food. If people hear the hint of another snow storm, the stores may have a small window of restocking before being ravaged again. Thinking that Tuesday may be the optimal time. Worst case, I do have tire chains if roads aren't that good yet. -
 Is that from Wiz's camcorder?
 -

E PA/NJ/DE Winter 2025-26 Obs/Discussion
Newman replied to LVblizzard's topic in Philadelphia Region
I don't know if Jan 2000 is the best analog verbatim, at least at the upper levels. That one had a southern stream shortwave that got captured by the polar jet and then swung northward up the east coast. https://www.raymondcmartinjr.com/weather/2000/25-Jan-00-500MillibarMaps.html At the surface and as far as sensible impacts go, definitely similarities. But at the upper levels, the 6z Euro output is even more anomalous. January 1966 is actually a pretty dang close analog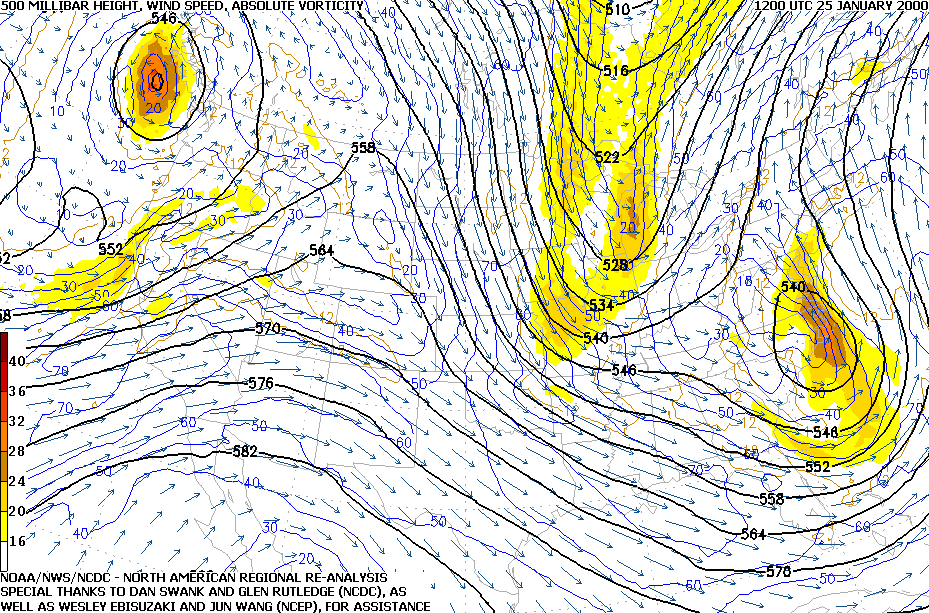
-
Pittsburgh/Western PA WINTER ‘25/‘26
Rd9108 replied to Burghblizz's topic in Upstate New York/Pennsylvania
Somebody on Facebook had a measurement in Brighton Heights (city) of 18 inches. Obviously thats a drift. The city probbaly only got between 10-12. -
The record for NYC at or below 32° is 16 days and below 32° the same at 16 days in 1961. Number of Consecutive Days Max Temperature <= 32 for NY CITY CENTRAL PARK, NY Click column heading to sort ascending, click again to sort descending. 1 16 1961-01-19 through 1961-02-03 2 15 1881-01-23 through 1881-02-06 3 14 2017-12-26 through 2018-01-08 4 13 2000-12-22 through 2001-01-03 - 13 1893-01-10 through 1893-01-22 5 12 2003-01-14 through 2003-01-25 - 12 1978-01-27 through 1978-02-07 - 12 1958-02-08 through 1958-02-19 - 12 1936-01-23 through 1936-02-03 6 11 1981-01-08 through 1981-01-18 - 11 1979-02-09 through 1979-02-19 - 11 1935-12-21 through 1935-12-31 - 11 1892-12-21 through 1892-12-31 7 10 1958-12-07 through 1958-12-16 - 10 1948-01-23 through 1948-02-01 - 10 1918-01-27 through 1918-02-05 - 10 1895-02-02 through 1895-02-11 - 10 1886-01-07 through 1886-01-16 - 10 1873-01-24 through 1873-02-02 8 9 2005-01-16 through 2005-01-24 - 9 2004-01-23 through 2004-01-31 - 9 1996-01-03 through 1996-01-11 - 9 1989-12-17 through 1989-12-25 - 9 1977-01-11 through 1977-01-19 - 9 1968-01-05 through 1968-01-13 - 9 1945-12-16 through 1945-12-24 - 9 1934-02-02 through 1934-02-10 - 9 1899-02-06 through 1899-02-14 - 9 1876-12-17 through 1876-12-25 9 8 1984-01-15 through 1984-01-22 - 8 1982-01-08 through 1982-01-15 - 8 1930-01-19 through 1930-01-26 - 8 1917-12-29 through 1918-01-05 - 8 1912-01-25 through 1912-02-01 - 8 1905-01-29 through 1905-02-05 - 8 1899-12-28 through 1900-01-04 - 8 1897-01-24 through 1897-01-31 - 8 1885-02-17 through 1885-02-24 - 8 1880-11-21 through 1880-11-28 - 8 1875-01-14 through 1875-01-21 10 7 2014-02-06 through 2014-02-12 - 7 2000-01-17 through 2000-01-23 - 7 1988-01-05 through 1988-01-11 - 7 1963-12-15 through 1963-12-21 - 7 1962-12-10 through 1962-12-16 - 7 1920-01-14 through 1920-01-20 - 7 1919-12-15 through 1919-12-21 - 7 1914-02-15 through 1914-02-21 - 7 1912-02-29 through 1912-03-06 - 7 1912-02-08 through 1912-02-14 - 7 1898-01-28 through 1898-02-03 - 7 1896-01-04 through 1896-01-10 - 7 1888-01-18 through 1888-01-24 - 7 1886-02-01 through 1886-02-07 - 7 1885-03-17 through 1885-03-23 - 7 1870-12-22 through 1870-12-28 Number of Consecutive Days Max Temperature < 32 for NY CITY CENTRAL PARK, NY Click column heading to sort ascending, click again to sort descending. 1 16 1961-01-19 through 1961-02-03 2 15 1881-01-23 through 1881-02-06 3 14 2017-12-26 through 2018-01-08 4 13 1893-01-10 through 1893-01-22 5 12 1978-01-27 through 1978-02-07 - 12 1936-01-23 through 1936-02-03 6 11 1979-02-09 through 1979-02-19 - 11 1958-02-09 through 1958-02-19 - 11 1935-12-21 through 1935-12-31 7 10 1958-12-07 through 1958-12-16 - 10 1895-02-02 through 1895-02-11 - 10 1892-12-21 through 1892-12-30 - 10 1886-01-07 through 1886-01-16 8 9 2005-01-16 through 2005-01-24 - 9 2004-01-23 through 2004-01-31 - 9 1996-01-03 through 1996-01-11 - 9 1977-01-11 through 1977-01-19 - 9 1968-01-05 through 1968-01-13 - 9 1945-12-16 through 1945-12-24 - 9 1899-02-06 through 1899-02-14 9 8 1982-01-08 through 1982-01-15 - 8 1917-12-29 through 1918-01-05 - 8 1905-01-29 through 1905-02-05 - 8 1897-01-24 through 1897-01-31 - 8 1885-02-17 through 1885-02-24 - 8 1875-01-14 through 1875-01-21 10 7 2000-01-17 through 2000-01-23 - 7 1963-12-15 through 1963-12-21 - 7 1920-01-14 through 1920-01-20 - 7 1919-12-15 through 1919-12-21 - 7 1918-01-30 through 1918-02-05 - 7 1912-02-08 through 1912-02-14 - 7 1899-12-28 through 1900-01-03 - 7 1888-01-18 through 1888-01-24 - 7 1886-02-01 through 1886-02-07 - 7 1885-03-17 through 1885-03-23 - 7 1876-12-19 through 1876-12-25 - 7 1873-01-24 through 1873-01-30
-
 Do you have this map that includes Georgia rather than New England?
 -
Its going to be fun trying to shovel my driveway
-
Apple weather already showing 9”-11” for Saturday and another 2”-4” on Sunday.
-
 16" 43.5" ytd
 -
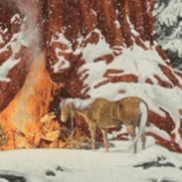
Wild event. Old Fort and most of McDowell county is a glacier. You make it to Black Mountain and you wouldn’t even know there was a storm
-
January 2026 Short/Medium Range Thread
Holston_River_Rambler replied to John1122's topic in Tennessee Valley
Well nevermind, that wasn't as hard to find as I thought: -
 As of Midnight last night. NYC - Central Park 11.4 inches - Seems about right for a change. Newark Airport 11.5 inches LGA 9.7 inches - Seems supect. Low compared to all surrounding reports Islip 12.9 inches Bridgeport 15.1 inches JFK 10.3 inches
 -
 From Snowthuen: First measurement last night shortly before 6;30 was 8.5...an additional 10.1 has fallen since then ...18.6 so far. Very light snow falling...
 -

The “I bring the mojo” Jan 30-Feb 1 potential winter storm
wxdawg10 replied to lilj4425's topic in Southeastern States
We regularly get burned but we never learn our lesson. Fantasy snow maps are like the toxic ex we can't get over.