All Activity
- Past hour
-

Occasional Thoughts on Climate Change
Typhoon Tip replied to donsutherland1's topic in Climate Change
One thing I wanna do when I have the free time - which I never do - is find the actual geophysically applied science to/and resulting publication(s) regarding the supposed feedbacks between the earth surface and air. In blunt, simple terms, I always thought that was dubious - but sort of covet that opinion more so until I see how exactly those that claim farming practices/methodology of land management can couple en masse to the extent that it causes an entire continental -scaled consequence. mmm okay. I can understand feedbacks in part. I don't believe that land management was the primary driver. There are also two distinct aspects that I think folks conflate - at least the general discussion seems to suggest. Dust storms and heat can by mutually exclusively originating. Yes, heat aids in evaporation... so the relationship is quite obviously there. But it is also not required. Example, Gobi desert spring dust storm climo; these events, triggered by the "Mongolian Cyclone" sending strong cold winds associated with Mongolian cyclones. These events are just as bad... significantly impacting air quality and visibility in just the same exact way. I'm preeeetty sure there is no farming practices in the Gobi desert lending to creating a vast heat dome in the late winter and springtime there. Ya think If all that skepticism (and sarcasm!) is true, then that logically urges that whatever pattern synergistically aroused big heat response in 1936 was actually not caused by land-air feedback as a whole mechanism. There may be, and yes obvious there was, feedback modulation going on... But the resonance of the entire seasonal event was likely super-synoptic in origin. I really feel like I need to see the wholesale science on the matter a gain an understanding of how much 'improper land management practices led to the dust storm' vs how much of that may have also just been a dry antecedent decadal signal then exacerbating dusty consequence. As far as the heat, as a Meteorologist, that starts over eastern Asia with planetary wave transmitting wave orientation across the Pacific, ultimately favoring(not favoring). -
75 / DP: 61 clear with clouds clinging to the southern half of the region into SNJ. Enough sun and the hotter places could get to 90 otherwise upper 80s max. Pretty much a 3 peat Wed-Thu-Fri before drier cooler air comes in Sat and most of Sunday although Sunday - Monday could trend warmer with the ridge to our west flexing but it looks to coincide with the next front and chance for showers/storms. The period 8/17 - 8/20 near normal then overall warmer beyond there with hints the western ridge builds heat and links with the southeast ridge with a window of some heat coming this way 8/21 - 8/25 period. Tropics pickingup but most look Atlantic formed and bound.
-

Spring/Summer 2026 Pattern Discussion Thread
John1122 replied to Carvers Gap's topic in Tennessee Valley
I'm getting a pre-storm ahead of the line of storms sweeping south. -
I slept through it but woke up to 1.55” for the day.
-
 http://mexisaferx.com/# mexico prescriptions
 -
Sunday has a chance according to CSU
-
DVN just gusted to 59mph. Should be another very nice soaker en route.
-

Augdewst 2026: Summer's Last Stand
dendrite replied to Prismshine Productions's topic in New England
Gotta love BOS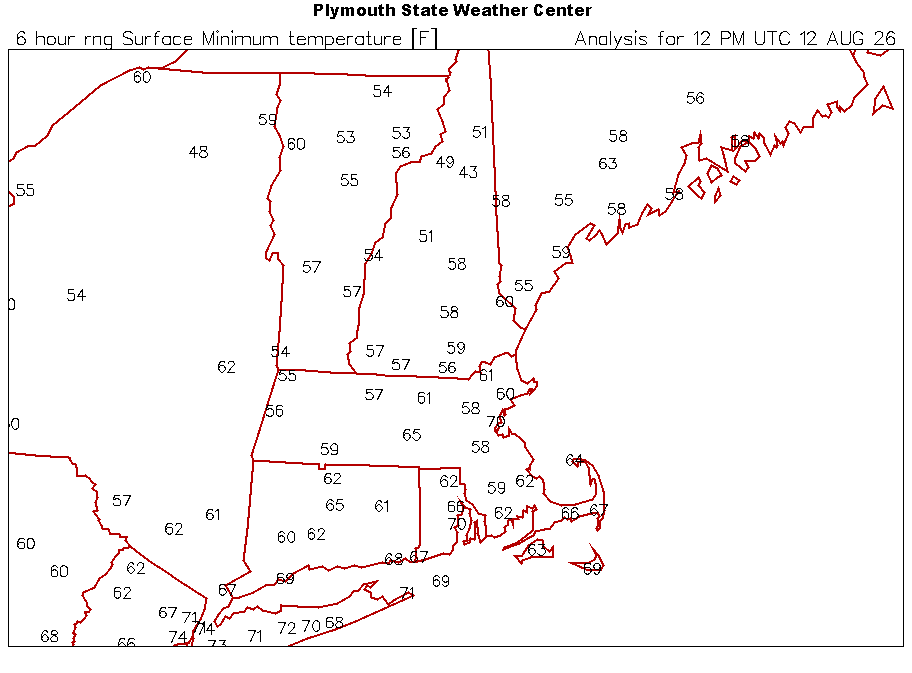
-
2026 C and E Pacific tropical activity
Kevin Reilly replied to GaWx's topic in Tropical Headquarters
My friend's plane leaves for Honolulu Hawaii Friday, August 14th. He is taking a Hawaiian island cruise around all the islands. Looks like the GFS has a 985 mb storm and the Euro 997 mb storm making a direct hit on the big island before moving west and away. Looks like this system is a legitimate threat to Hawaii. Any updates from the more seasoned tropical guys here would be great. I am able to see the models and the water vapor maps / satellites etc. looks like a bit of shear and dry air to the north limiting development for now. Looks like the legitimate threat lies at 11 N and 143 W if I am looking at it correctly but almost looks like another up there at 15N and 139 W. It looks very active out there. -
Occasional Thoughts on Climate Change
Typhoon Tip replied to donsutherland1's topic in Climate Change
Btw, Europe is quickly closing on a JJA warmest ever for a second consecutive year. I'm not sure if that's on whole, or in lesser quadratures but just a-priori on the story-line to date proooobably implicates everywhere? I dunno on that per se. interesting tho -

2026-2027 Record-breaking El Nino
jconsor replied to Stormchaserchuck1's topic in Weather Forecasting and Discussion
You can find VP anomaly from 1940s to present from JMA 3Q reanalysis here: https://ds.data.jma.go.jp/gmd/tcc/tcc/products/clisys/figures/db_hist_jun_tcc.html (10 day means) https://ds.data.jma.go.jp/gmd/tcc/tcc/products/clisys/figures/db_hist_mon_tcc.html (monthly means) In the menu on upper left under "Field", click on Tropics. Then under Element, click 200 hPa Velocity Potential. -
 I asked Gemini these three questions, italicized for clarity. You could ask any AI the same set of questions, and get the same general answers. Q: For collecting good-quality long term climate temperature data, 100 years+, describe a hypothetical location in a temperate climate. Short answer. A: A ideal hypothetical location in a temperate climate for a 100-year climate station is an isolated, protected rural valley plateau. Q: If you took the station just described, and after 100 years of data, moved it into an urban area, what would happen? Short answer. Describe the reverse case as well, where the station begins in an urban area. A: Moving a Rural Station to an Urban Area: Moving a 100-year rural station into a city causes an artificial temperature spike. A: The Reverse: Moving an Urban Station to a Rural Area: Moving a station from a city out to a rural area causes an artificial temperature drop. Q: How would you correct for the station move? A: To correct for a station move, climate scientists use a statistical process called homogenization. Here is how the correction works: Create a Reference Record: Scientists select a group of nearby, undisturbed "neighboring" stations that experienced the same regional weather but did not move. Identify the Breakpoint: They calculate the average temperature difference between the target station and the neighbor group. A sudden, permanent shift in this difference confirms the exact date of the move. Calculate the Offset: Scientists compare the data from a window of years immediately before the move to a window of years after the move against the stable neighbors to determine the exact bias (e.g., the city move made it 1.2°C warmer). Adjust the Historical Data: They apply that 1.2°C offset to the entire block of data prior to the move, lifting (or lowering) the old record so it seamlessly aligns with the new location's environment.
 -
Storms possible mainly north and west area this evening/later tonight
-
It's kinda boring not having any tropical to track this time of year. No big swells, no cone of uncertainty, no weenie NAM runs with a cat 5 into Annopoils. Nothing but dust and cobwebs.
-
There's almost a chill in the air this morning
-

Augdewst 2026: Summer's Last Stand
CoastalWx replied to Prismshine Productions's topic in New England
Thankfully we upper 60s. - Today
-

2026-2027 Record-breaking El Nino
GaWx replied to Stormchaserchuck1's topic in Weather Forecasting and Discussion
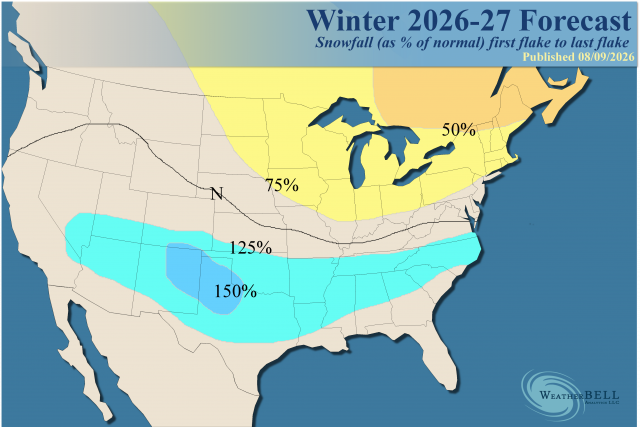
Initial WxBell Nov ‘26- Mar ‘27 forecast looks very reasonable although I’d like to see the month to month so as to see the expected large variability from early to late as I’ve just been posting about although they did say this: The bottom line is the colder part of the winter is expected to be later, rather than in December. Temps: Snowfall: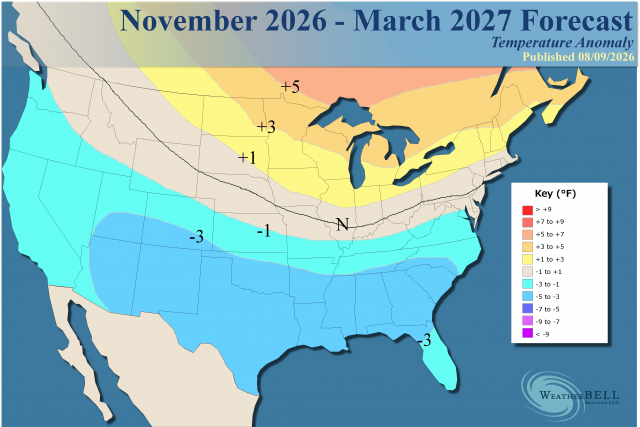
-
Augdewst 2026: Summer's Last Stand
dendrite replied to Prismshine Productions's topic in New England
Min 57.4° Coldest 8/12/2026 of my life. -
The TW following 92L is also making some noise on the models and is now a lemon although the 0Z UKMET has it just as a TW moving similarly to 92L into the E Caribbean: 8AM TWO: Now up to 20/30:3. Eastern Tropical Atlantic:A tropical wave just offshore of the coast of west Africa is producing disorganized showers and thunderstorms. Environmental conditions are forecast to be generally conducive for some development of this system during the next several days while it moves westward or west-northwestward across the eastern and central tropical Atlantic.* Formation chance through 48 hours...low...20 percent.* Formation chance through 7 days...low...30 percent.
-

2026-2027 Record-breaking El Nino
bluewave replied to Stormchaserchuck1's topic in Weather Forecasting and Discussion
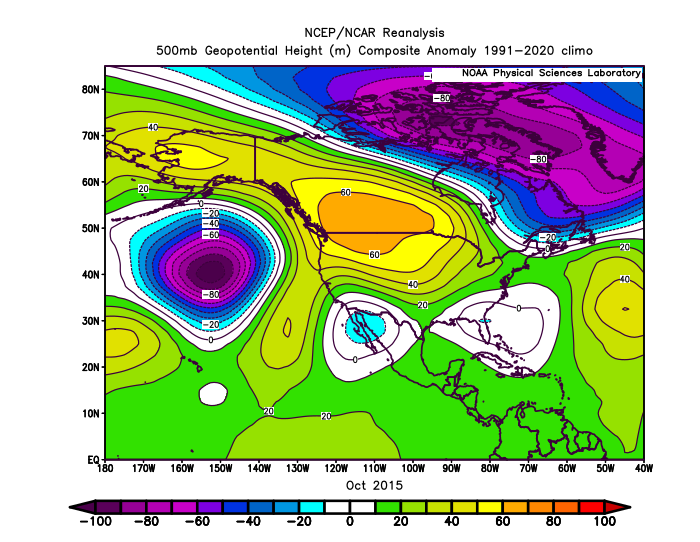
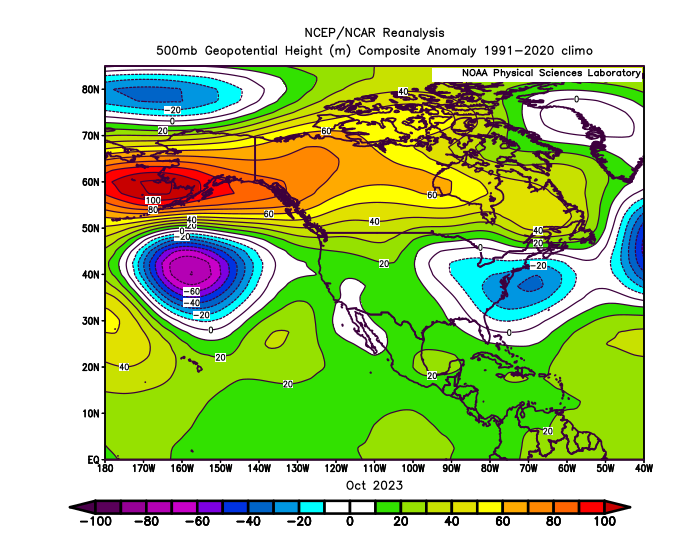
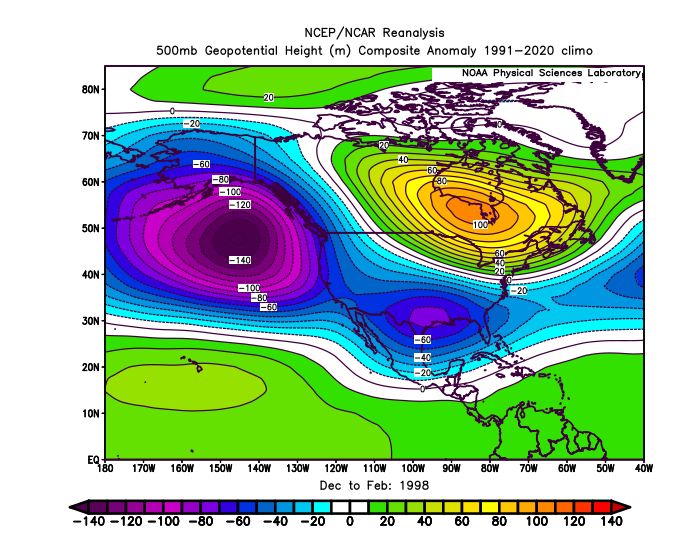
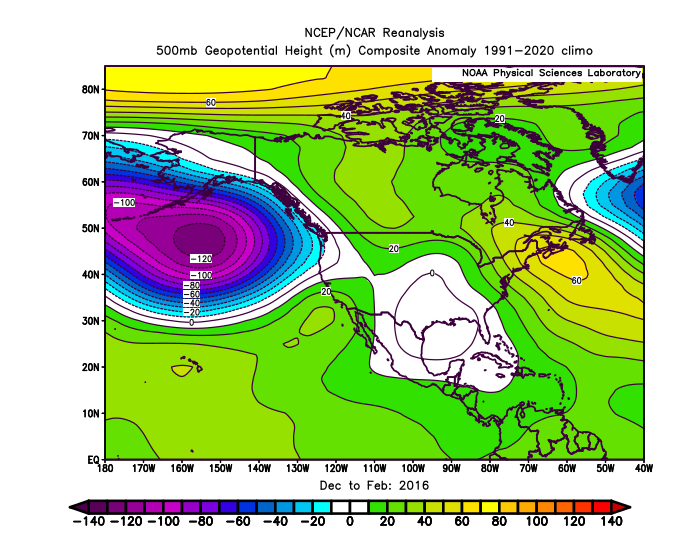
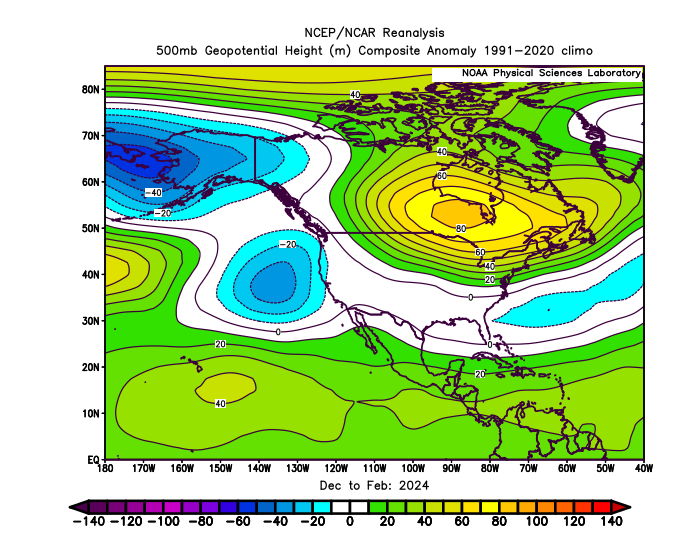
Yeah, October has been a pretty good indication of the Aleutian low strength for the winter since 1997 during super El Niño. Notice how large an area in the NEPAC during October 1997 was occupied by the Aleutian low. It actually had multiple centers. One area NW of Hawaii and the other over the EPO and PNA regions. The Southeast El Niño trough was already beginning to become established also. That winter went on to have one of the strongest and largest Aleutian low areas of all-time. In October 2015 and 2023 the Aleutian low was confined to a much smaller space in the NEPAC. Both of theses winters had smaller and more displaced Aleutian low locations than 1997-1998. This matches the 500 mb ridges becoming stronger and more expansive since 2015-2016 and the troughs becoming weaker relative to earlier years.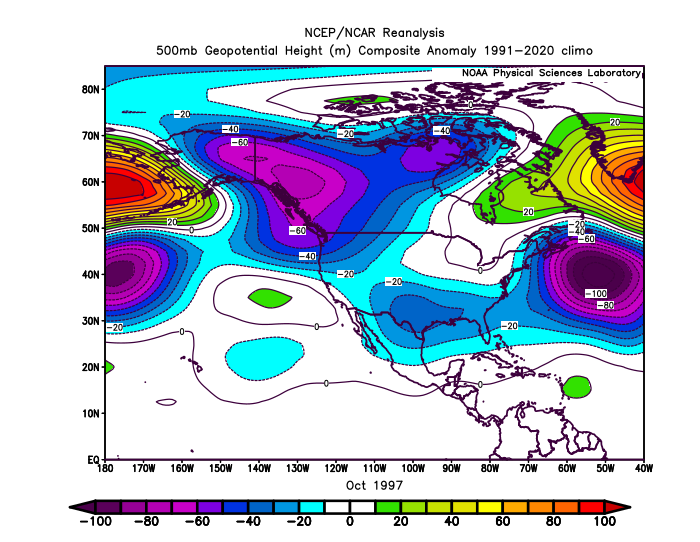
-
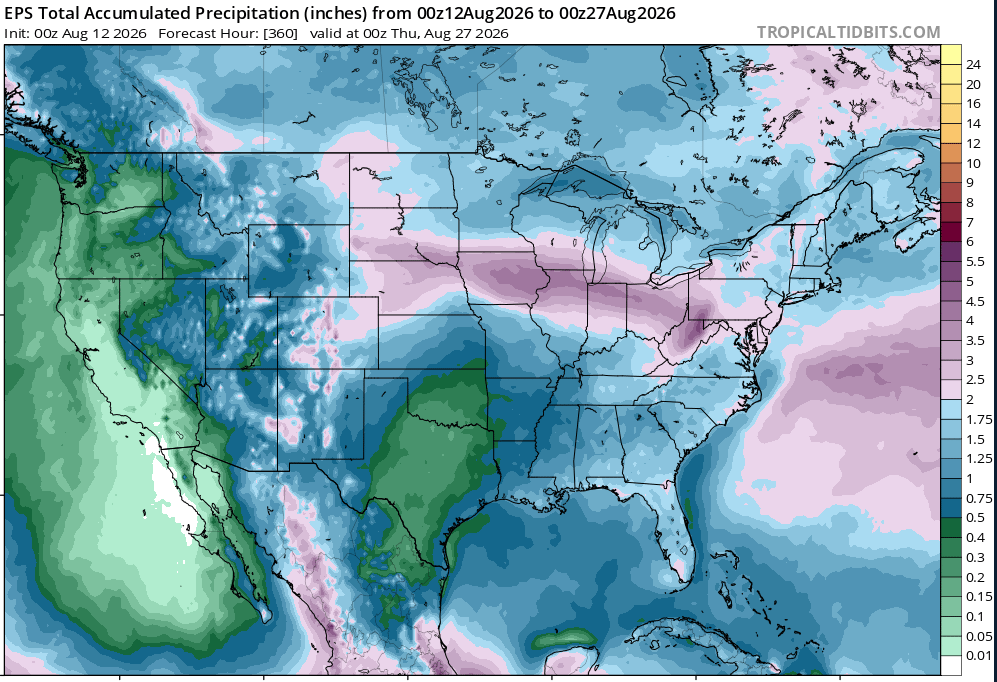
p strong agreement on more relief in droughtville
-
-
Central PA Summer 2026 Discussion/Obs Thread
pawatch replied to Voyager's topic in Upstate New York/Pennsylvania
63 degrees this morning. Fishing yesterday pretty hard downpour 6:00am for 15 minutes and some strong winds. We took fish place yesterday. Been a tough year. -
should be a safe miss south for my, not to bummed and will be nice to see the wet get spread around a bit
-
https://mapletrustrx.com/# Maple Trust Rx