LibertyBell Posted December 19, 2019 Share Posted December 19, 2019 48 minutes ago, bluewave said: These snow squalls are very location specific like summer thunderstorms. Last January for me was more extreme with stronger winds and lower visibility. So I guess you were in a better spot for this one than me. But it’s interesting how we got two such potent events this close together in time. Must be a product of the fast Pacific flow and rapid 500 mb wavelength changes. Notice how last year also had short the Arctic outbreak and temperature moderation a few days later. But the lows and highs over the next week will be less extreme. Another version of 2010’s repeating weather patterns. Data for NY CITY CENTRAL PARK, NY Click column heading to sort ascending, click again to sort descending. Date Max Temperature Min Temperature Snowfall 2019-01-30 35 6 0.4 2019-01-31 16 2 0.0 2019-02-01 21 11 0.0 2019-02-02 34 16 0.0 2019-02-03 53 33 0.0 2019-02-04 61 41 0.0 2019-02-05 65 44 0.0 Chris, could it also have to do with warmer lakes producing more prolonged plumes? In my experience these events seem to be more prevalent in December than they are in other months. Also, do you have the list of spotter reports for last night's event? Link to comment Share on other sites More sharing options...
Brasiluvsnow Posted December 19, 2019 Share Posted December 19, 2019 3 hours ago, bluewave said: Here you go. https://www.theweatherprediction.com/habyhints2/457/ Thanks Brother 1 Link to comment Share on other sites More sharing options...
MJO812 Posted December 19, 2019 Share Posted December 19, 2019 Eps has a nice look Terrible Pacific but a very good atlantic 1 Link to comment Share on other sites More sharing options...
NYCweatherNOW Posted December 19, 2019 Author Share Posted December 19, 2019 6 minutes ago, Snow88 said: Eps has a nice look Terrible Pacific but a very good atlantic It’s dead Jim. For now 1 Link to comment Share on other sites More sharing options...
MJO812 Posted December 19, 2019 Share Posted December 19, 2019 30 minutes ago, NYCweatherNOW said: It’s dead Jim. For now What's dead ? Link to comment Share on other sites More sharing options...
bluewave Posted December 19, 2019 Share Posted December 19, 2019 1 hour ago, LibertyBell said: Chris, could it also have to do with warmer lakes producing more prolonged plumes? In my experience these events seem to be more prevalent in December than they are in other months. Also, do you have the list of spotter reports for last night's event? These past 2 events were unusual for their intensity across the whole region. Snow squalls usually just affect parts of the area. It’s pretty rare to get two events in the same calendar year that don’t weaken as they cross the area. The one last winter produced the heaviest snowfall rates of the season. This time it was the heaviest rates through at least December. I can’t really remember the last time a snow squall produced the seasons peak snowfall rate. Maybe Uncle can remember if the January 1977 squall was the heaviest rate for that season. Data for NY CITY CENTRAL PARK, NY Click column heading to sort ascending, click again to sort descending. Date Max Temperature Min Temperature Precipitation Snowfall 1977-01-28 44 13 0.02 0.2 1977-01-29 13 1 0.00 0.0 1977-01-30 19 10 0.00 0.0 1977-01-31 22 8 0.00 0.0 1 Link to comment Share on other sites More sharing options...
weatherlogix Posted December 19, 2019 Share Posted December 19, 2019 6 hours ago, Brian5671 said: The blizzard came at the end of the cold snap-we were below freezing 12/25 to 1/5 or something like that. it warmed after the storm, but the snowcover did last awhile January 4, 2018. NYC had like 10" while the further east you went the higher the amounts were. E. Islip had like 16" or something like that Link to comment Share on other sites More sharing options...
White Gorilla Posted December 19, 2019 Share Posted December 19, 2019 56 minutes ago, NYCweatherNOW said: It’s dead Jim. For now Link to comment Share on other sites More sharing options...
LibertyBell Posted December 19, 2019 Share Posted December 19, 2019 16 minutes ago, bluewave said: These past 2 events were unusual for their intensity across the whole region. Snow squalls usually just affect parts of the area. It’s pretty rare to get two events in the same calendar year that don’t weaken as they cross the area. The one last winter produced the heaviest snowfall rates of the season. This time it was the heaviest rates through at least December. I can’t really remember the last time a snow squall produced the seasons peak snowfall rate. Maybe Uncle can remember if the January 1977 squall was the heaviest rate for that season. Data for NY CITY CENTRAL PARK, NY Click column heading to sort ascending, click again to sort descending. Date Max Temperature Min Temperature Precipitation Snowfall 1977-01-28 44 13 0.02 0.2 1977-01-29 13 1 0.00 0.0 1977-01-30 19 10 0.00 0.0 1977-01-31 22 8 0.00 0.0 I remember a late season event that did that at JFK..... April 3 or 4 in 2006, NYC only got 0.1" (but that got them to 40.0 for 4 years in a row- unprecedented!) and JFK got 1.5" or 2". It happened during the day, was that a snow squall? It wasn't the heaviest snowfall rate event at NYC since they got that in the Feb 2006 blizzard, but it sure was at JFK, where there was about half the snow in the Feb 2006 blizzard. Link to comment Share on other sites More sharing options...
LibertyBell Posted December 19, 2019 Share Posted December 19, 2019 12 minutes ago, weatherlogix said: January 4, 2018. NYC had like 10" while the further east you went the higher the amounts were. E. Islip had like 16" or something like that You didn't have to go that far, JFK had 15" and Rockville Centre had 18" Link to comment Share on other sites More sharing options...
uncle W Posted December 19, 2019 Share Posted December 19, 2019 56 minutes ago, bluewave said: These past 2 events were unusual for their intensity across the whole region. Snow squalls usually just affect parts of the area. It’s pretty rare to get two events in the same calendar year that don’t weaken as they cross the area. The one last winter produced the heaviest snowfall rates of the season. This time it was the heaviest rates through at least December. I can’t really remember the last time a snow squall produced the seasons peak snowfall rate. Maybe Uncle can remember if the January 1977 squall was the heaviest rate for that season. Data for NY CITY CENTRAL PARK, NY Click column heading to sort ascending, click again to sort descending. Date Max Temperature Min Temperature Precipitation Snowfall 1977-01-28 44 13 0.02 0.2 1977-01-29 13 1 0.00 0.0 1977-01-30 19 10 0.00 0.0 1977-01-31 22 8 0.00 0.0 was it January 16th 1977?...there was some big squalls on January.18th 1994...The earliest one I can remember was on January 23, 1963 as an arctic front passed... Link to comment Share on other sites More sharing options...
MJO812 Posted December 19, 2019 Share Posted December 19, 2019 Winter really starts in January for SNJ northward according to CPC. Link to comment Share on other sites More sharing options...
weatherpruf Posted December 19, 2019 Share Posted December 19, 2019 1 hour ago, LibertyBell said: You didn't have to go that far, JFK had 15" and Rockville Centre had 18" And just west across the Hudson we struggled to hit 8, I think we had 6 locally. Link to comment Share on other sites More sharing options...
rclab Posted December 19, 2019 Share Posted December 19, 2019 1 hour ago, Snow88 said: What's dead ? Pretty soon, the salt encrusted sycamore in front of my row house. As always ..... Link to comment Share on other sites More sharing options...
rclab Posted December 19, 2019 Share Posted December 19, 2019 41 minutes ago, Snow88 said: Winter really starts in January for SNJ northward according to CPC. Considering how events work out, I believe CPK could be the out of region Vatican for the Mid Atlantic Forum. Link to comment Share on other sites More sharing options...
gravitylover Posted December 19, 2019 Share Posted December 19, 2019 3 hours ago, CPcantmeasuresnow said: I would disagree with that. A 15.2 inch storm would tie for 20th place on NYC's list of greatest snow storms. To me an HECS, with the emphasis on the H for historic, would have to be a top 5 storm which in NYC's case would be 21.0 or more inches to break the top 5. But hey to each his own. I don't think you can put a number to it like that. IMO historic is a combination of things that combine to create a very high impact event. For instance, that May frontal passage that spawned all of those tornadoes that devastated areas around here, that March storm two years ago that knocked the power out for a week here or 4/1/97 where I got 17" in less than 3 hours and hundreds of trees came down and the streets were blocked for 2 days so that I couldn't even get out of my dead end or more than 2 blocks in any direction after me and the neighbors cut the trees out of our street. We were super hungry by the time we could get out to get food. 1 hour ago, bluewave said: These past 2 events were unusual for their intensity across the whole region. Snow squalls usually just affect parts of the area. It’s pretty rare to get two events in the same calendar year that don’t weaken as they cross the area. The one last winter produced the heaviest snowfall rates of the season. This time it was the heaviest rates through at least December. I can’t really remember the last time a snow squall produced the seasons peak snowfall rate. Maybe Uncle can remember if the January 1977 squall was the heaviest rate for that season. Data for NY CITY CENTRAL PARK, NY Click column heading to sort ascending, click again to sort descending. Date Max Temperature Min Temperature Precipitation Snowfall 1977-01-28 44 13 0.02 0.2 1977-01-29 13 1 0.00 0.0 1977-01-30 19 10 0.00 0.0 1977-01-31 22 8 0.00 0.0 I was walking home from school in Oceanside when that hit. Vis went from normal to 150 feet in seconds, the whole world went silent, cars started sliding off the road into front yards and it was a huge mess. If my memory is right it really only lasted about 20 minutes but we got a few inches. It was 15 years after that before I saw those kinds of snowfall rates again in Lake Tahoe where 10-12"/hr happened several times the winter I lived there and I spent 6 years in the Rockies before that and never saw more than 5-6"/hr. 1 Link to comment Share on other sites More sharing options...
NYCweatherNOW Posted December 19, 2019 Author Share Posted December 19, 2019 1 hour ago, Snow88 said: Winter really starts in January for SNJ northward according to CPC. I mean if today isn’t winter I don’t know what is Ant Link to comment Share on other sites More sharing options...
MJO812 Posted December 19, 2019 Share Posted December 19, 2019 2 minutes ago, NYCweatherNOW said: I mean if today isn’t winter I don’t know what is Ant You know what I mean lol 1 Link to comment Share on other sites More sharing options...
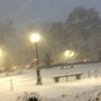
JerseyWx Posted December 19, 2019 Share Posted December 19, 2019 5 hours ago, LibertyBell said: that was my best snow squall EVER, it snowed at varying rates for 7 hours, from 4 PM to 11 PM and all the roads here were snow covered multiple times! I've seen better, but not a bad squall. I was more surprised by the several bouts of wind blown snow we had, despite getting maybe .50" or so. 1 Link to comment Share on other sites More sharing options...
ForestHillWx Posted December 19, 2019 Share Posted December 19, 2019 56 minutes ago, rclab said: Pretty soon, the salt encrusted sycamore in front of my row house. As always ..... Ha. Typical sycamore and London plane are incredibly hardy. They do suffer from early spring anthracnose on foliage. Link to comment Share on other sites More sharing options...
EasternLI Posted December 19, 2019 Share Posted December 19, 2019 2 minutes ago, Snow88 said: You know what I mean lol Cheer up. It seems like things are coming together nicely. Just not yet. Watch what happens when we start getting into January. Link to comment Share on other sites More sharing options...
NorthShoreWx Posted December 19, 2019 Share Posted December 19, 2019 2 hours ago, bluewave said: These past 2 events were unusual for their intensity across the whole region. Snow squalls usually just affect parts of the area. It’s pretty rare to get two events in the same calendar year that don’t weaken as they cross the area. The one last winter produced the heaviest snowfall rates of the season. This time it was the heaviest rates through at least December. I can’t really remember the last time a snow squall produced the seasons peak snowfall rate. Maybe Uncle can remember if the January 1977 squall was the heaviest rate for that season. Data for NY CITY CENTRAL PARK, NY Click column heading to sort ascending, click again to sort descending. Date Max Temperature Min Temperature Precipitation Snowfall 1977-01-28 44 13 0.02 0.2 1977-01-29 13 1 0.00 0.0 1977-01-30 19 10 0.00 0.0 1977-01-31 22 8 0.00 0.0 It wasn't 1/28/77. That was the arctic front and wave that caused a real emergency and buried Buffalo (only about 4" of synoptic snow, no lake effect to speak of off the frozen lake, but 75 mph wind gusts from the WSW blew massive amounts of snow sitting on the Lake Erie ice pack miles inland creating enormous drifts and taking quite a toll. In NYC / LI with morning temperatures well down in the teens and forecasts of a few inches of snow and near blizzard conditions accompanying the arctic front, it was quite a disappointment to snow lovers. Temps spiked to 44 ahead of the front and light rain in the evening ended as a coating of snow as temps fell back to 13 by midnight. 1 Link to comment Share on other sites More sharing options...
NorthShoreWx Posted December 19, 2019 Share Posted December 19, 2019 8 minutes ago, bluewave said: Which date did the above account occur on? I know Erie froze over early and the powder collecting for a month blowing into Buffalo. But Ontario was still open. Most of my memories from that winter were of extreme cold. 1/28/77. The windblown snow was packed rock hard. It was like cars and homes getting buried in an avalanche: https://en.wikipedia.org/wiki/Blizzard_of_1977 Link to comment Share on other sites More sharing options...
doncat Posted December 20, 2019 Share Posted December 20, 2019 26/15 temp split today...monthly departure now at -2.2°. Link to comment Share on other sites More sharing options...
donsutherland1 Posted December 20, 2019 Share Posted December 20, 2019 Despite ample sunshine, most of the region saw its coldest December temperatures since December 31, 2017. Select low temperatures included: Boston: 15° (lowest since March 7); Bridgeport: 17° (lowest since March 8); Islip: 17° (lowest since December 8); New York City: 16° (lowest since February 2); Newark: 16° (lowest since March 7); and, Philadelphia: 19° (lowest since March 7). Beginning this weekend, a milder pattern will commence. Overall, the final 10 days of December will likely have above normal temperatures, with perhaps a few somewhat cooler days. Colder air could return during the first week of January. However, some of the guidance has shifted away from that idea. The progression of the MJO in concert with the teleconnections could be crucial in determining whether most of North America's cold air stays bottled up north of the Canada-U.S. border beyond the first week of January or comes south and eastward into the region just after the start of 2020. The ENSO Region 1+2 anomaly was +0.5°C and the Region 3.4 anomaly was +0.5°C for the week centered around December 4. For the past six weeks, the ENSO Region 1+2 anomaly has averaged -0.05°C and the ENSO Region 3.4 anomaly has averaged +0.53°C. These recent conditions are consistent with a weak El Niño. Nevertheless, a neutral ENSO remains the base case for Winter 2019-20. The SOI was -6.90 today. Today, the preliminary Arctic Oscillation (AO) figure was -1.408. No significant stratospheric warming event appears likely through December 28, but some warming above 3 mb could develop near the end of the forecast period. Moderate Wave 2 activity could occur after December 20, likely leading to some upper stratospheric warming. Overall, most of the stratosphere is forecast to remain cold into the closing days of December on the EPS. On December 18, the MJO was in Phase 4 at an amplitude of 0.621 (RMM). The December 17-adjusted amplitude was 0.769. Based on sensitivity analysis applied to the latest guidance, there is an implied 54% probability that December will wind up colder than normal in New York City. That probability has fallen sharply in recent days, as the guidance has made large adjustments to the warmer side for the final seven days of December. 2 2 Link to comment Share on other sites More sharing options...
Cfa Posted December 20, 2019 Share Posted December 20, 2019 27/17 here today....5th coldest day of the year. 1. Jan 31st ~ 10.5°F 2. Jan 21st ~ 10.8°F 3. Feb 1st ~ 16.6°F 4. Jan 22nd ~ 21.3°F 5. Dec 19th ~ 21.8°F Link to comment Share on other sites More sharing options...
NorthShoreWx Posted December 20, 2019 Share Posted December 20, 2019 5 hours ago, bluewave said: I was talking about the account from gravitylover. I was walking home from school in Oceanside when that hit. Vis went from normal to 150 feet in seconds, the whole world went silent, cars started sliding off the road into front yards and it was a huge mess. If my memory is right it really only lasted about 20 minutes but we got a few inches. It was 15 years after that before I saw those kinds of snowfall rates again in Lake Tahoe where 10-12"/hr happened several times the winter I lived there and I spent 6 years in the Rockies before that and never saw more than 5-6"/hr. Got it. I don't have anything for Oceanside, but 1/25/77 looks like a candidate. Mineola jackpot might be a clue (last column is snowfall): Bridgehampton 1977 1 25 0.27 0.5 Greenport 1977 1 25 0.2 0.6 Islip LI Macarthur AP 1977 1 25 0.09 0.5 Mineola 1977 1 25 0.1 2.6 New York JFK Intl AP 1977 1 25 0.1 1.1 New York La Guardia AP 1977 1 25 0.11 1.3 NY City Central Park 1977 1 25 0.03 0.3 Patchogue 2 N 1977 1 25 0.18 2.0 Riverhead Rsrch Farm 1977 1 25 0.14 1.5 Setauket Strong 1977 1 25 0.12 1.0 Syosset 1977 1 25 0.8 2 Link to comment Share on other sites More sharing options...
NorthShoreWx Posted December 20, 2019 Share Posted December 20, 2019 5 hours ago, bluewave said: I was talking about the account from gravitylover. I was walking home from school in Oceanside when that hit. Vis went from normal to 150 feet in seconds, the whole world went silent, cars started sliding off the road into front yards and it was a huge mess. If my memory is right it really only lasted about 20 minutes but we got a few inches. It was 15 years after that before I saw those kinds of snowfall rates again in Lake Tahoe where 10-12"/hr happened several times the winter I lived there and I spent 6 years in the Rockies before that and never saw more than 5-6"/hr. Snowfall records from Syosset 1/1/76 - 12/31/78. 3 Link to comment Share on other sites More sharing options...
CIK62 Posted December 20, 2019 Share Posted December 20, 2019 The next 8 days are averaging 38degs., or about 3degs. AN. Month to date is -2.2[37.1]. Should be about -0.6[37.4] by the 28th. 23* here at 6am. 25* by 9am. 29* by Noon. 32* by 2pm. All remaining 5-Day Dec. periods appear to be AN for T's into Jan. on the GEFS. A little better for the GEPS. EURO Weeklies look AN for us in Jan., and opposite to the CFS appearance. Not a runaway AN setup (yet). Draw a line N-S from Dakotas to Texas and west of it is BN---we are an island of near Normal in a sea of AN T's. Maybe the 46-Day snow total of about 15" is saving us. Pick your Christmas gift high T here: GEM 31, GFS 45, EURO 51. 1 Link to comment Share on other sites More sharing options...
bluewave Posted December 20, 2019 Share Posted December 20, 2019 Looks we are still on track for our annual warm up right before Christmas. The weather also dries out over the next week. So good shopping and holiday travel conditions. NEW YORK CITY-CENTRAL PARK KNYC GFSX MOS GUIDANCE 12/20/2019 0000 UTC FHR 24| 36 48| 60 72| 84 96|108 120|132 144|156 168|180 192 FRI 20| SAT 21| SUN 22| MON 23| TUE 24| WED 25| THU 26| FRI 27 CLIMO X/N 33| 26 37| 32 48| 39 53| 42 50| 38 45| 38 44| 34 44 28 41 2 Link to comment Share on other sites More sharing options...

Recommended Posts
Create an account or sign in to comment
You need to be a member in order to leave a comment
Create an account
Sign up for a new account in our community. It's easy!
Register a new accountSign in
Already have an account? Sign in here.
Sign In Now