All Activity
- Past hour
-
RDU also got in 30's for first time this season. 39.9
-

2026-2027 Record-breaking El Nino
GaWx replied to Stormchaserchuck1's topic in Weather Forecasting and Discussion
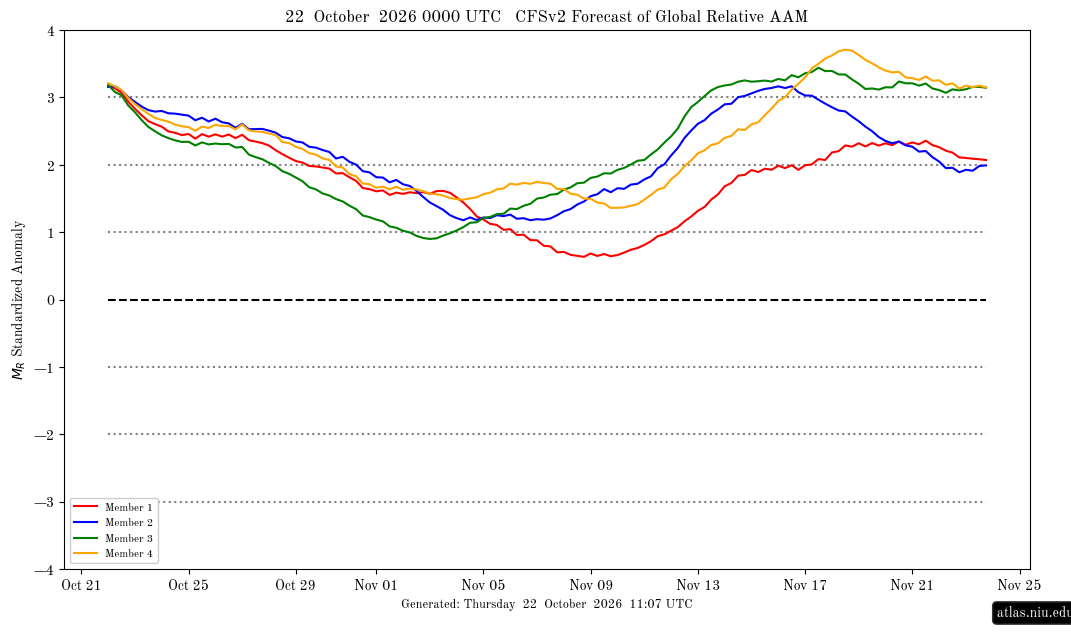
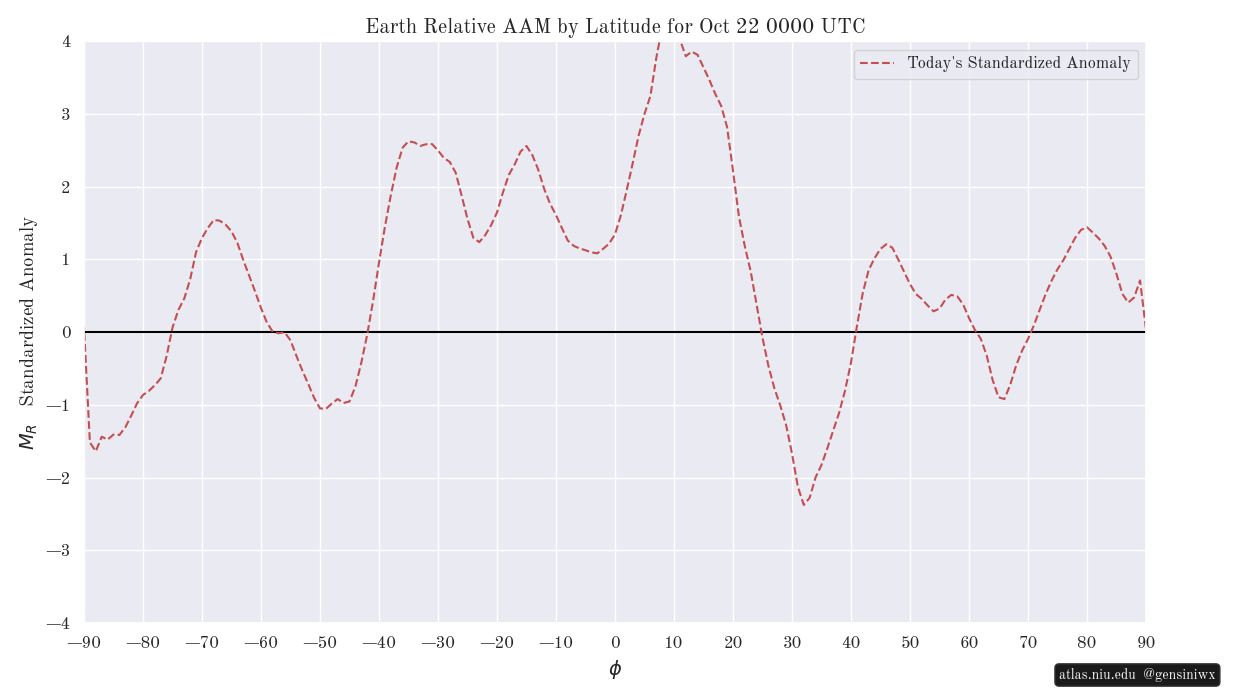
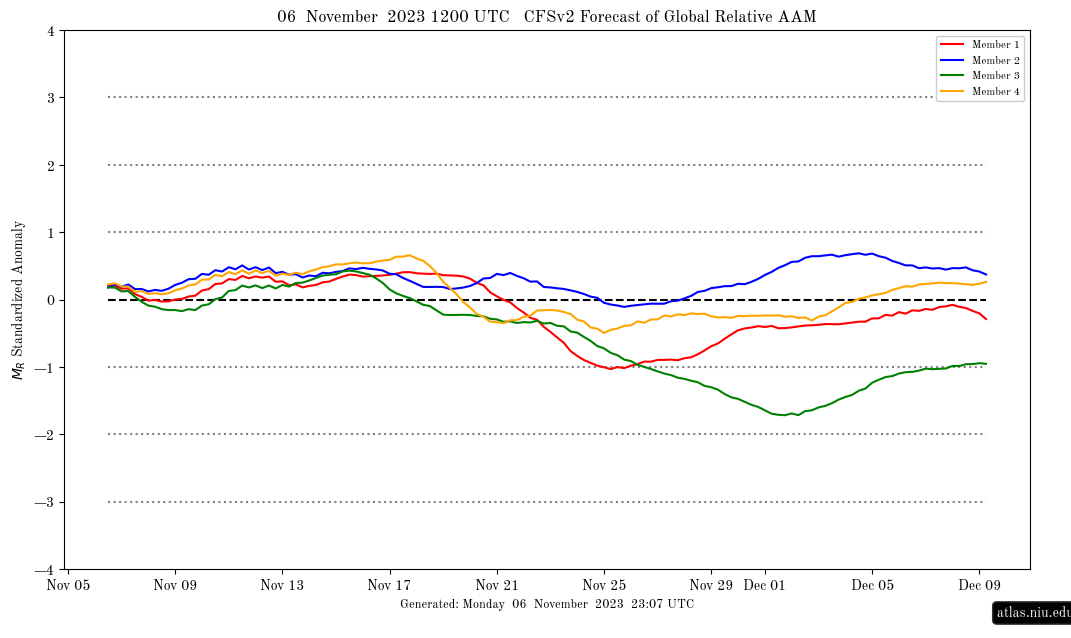
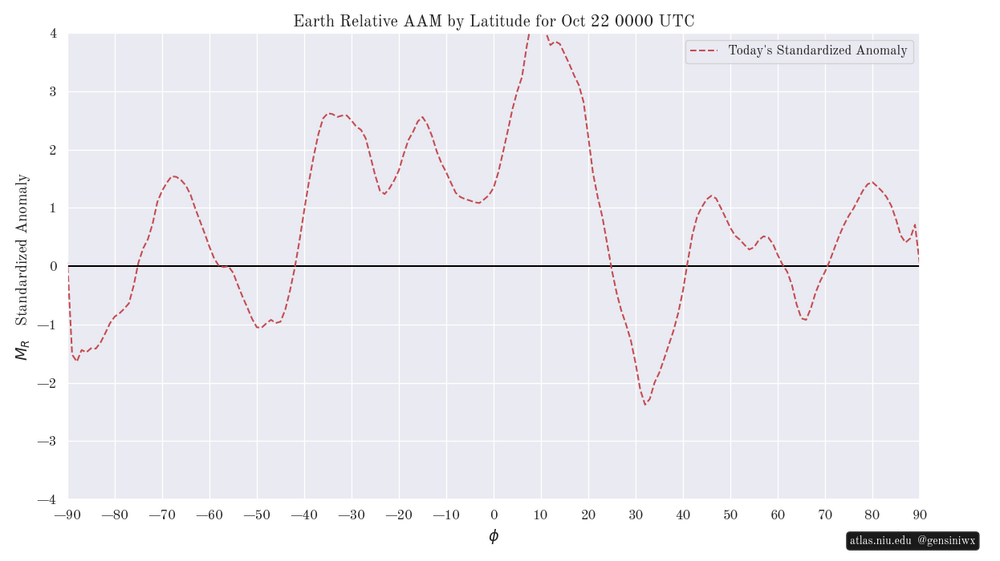
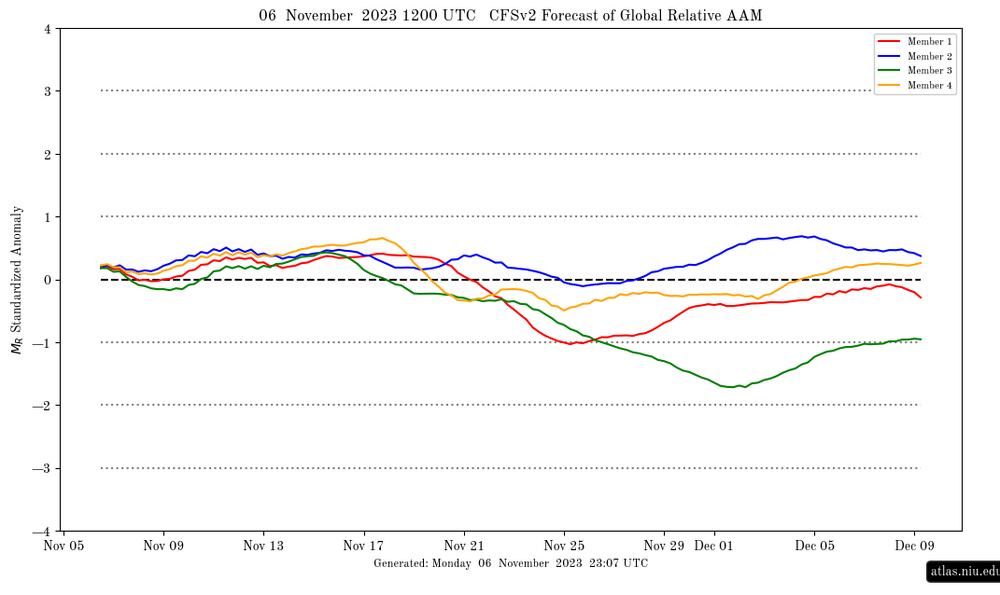
Today’s CFSv2 GLAAM forecast (see top image below): currently extremely high at +3 SD; though very high, Oct is not as high as record-breaking Sep (keep in mind that it amazingly exceeded +4 SD 9/17-23, which may not happen again for decades): By latitude: similar pattern that has dominated for awhile with the strongest positive anomalies S of 20N: In contrast, 2023 was nothing of the sort: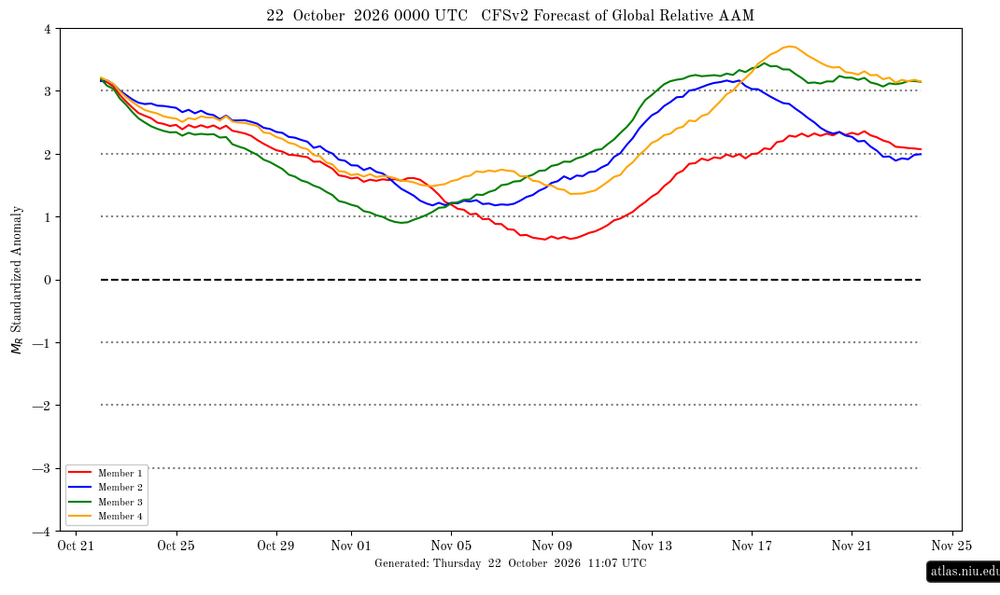
-
I don’t have anything against him personally but I do think Forky needs a break. I don’t entirely disagree with his views on this upcoming winter, but his thinking has gotten way too inflexible. Cognitive rigidity impedes creativity and it narrows your world.
-
Isn't there a recurving typhoon in the Pacific? Waiting for a @jaxjagmandownstream update and perhaps another to give their take on the Euro Weeklies showcasing a different look second half of November. At least the mornings/evenings feel glorious as we wait for the pattern to flip. It's already Thanksgiving for the Four Corners.
-

2026-2027 Record-breaking El Nino
michsnowfreak replied to Stormchaserchuck1's topic in Weather Forecasting and Discussion
Ohhh there will be lots of forecasts, and "forecasts", that will be fun to score. (And i too think the quoted forecast is too cold). -
3 of the 4 last super ninos were 20-25" here and that included the 2 closest analogs, 82-83 and 97-98. So yes I would lean much below normal snowfall and above normal temps. It is going to take luck to get above those values especially with a background state of losing snow in general over the recent years. We had favorable enso setups and it didnt help us.
-
Hope your wrong on the weather, but congratulations!!!!
-
I agree the rusty colors of post peak can sometimes put on their own show. If the leaf drop is not horrible, Smugglers Notch can put on a good post peak show as I recall. This was a shot I got back on 10/17/2015:
-

2026-2027 Record-breaking El Nino
snowman19 replied to Stormchaserchuck1's topic in Weather Forecasting and Discussion
And it’s getting even more of a boost from the +IOD now -

2026-2027 Record-breaking El Nino
George001 replied to Stormchaserchuck1's topic in Weather Forecasting and Discussion
Forky, it’s time to take a break. I am saying this as someone who agrees with you about our winter prospects, I’m expecting mostly a non-winter locally. If other people have different viewpoints, they are entitled to that and we need to be respectful of that. -

2026-2027 Record-breaking El Nino
bluewave replied to Stormchaserchuck1's topic in Weather Forecasting and Discussion
New all-time GLAAM record to add to the list of firsts with this historic event. -
What a beautiful October in progress
-
2026-2027 Fall/Winter Mountain Thread
Maggie Valley Steve replied to BlueRidgeFolklore's topic in Southeastern States
35° and frost this morning. -
Central PA Autumn 2026
Mount Joy Snowman replied to canderson's topic in Upstate New York/Pennsylvania
Makes me wonder if my grandma in Cave Creek, AZ got hit with anything noteworthy, I'll have to reach out to her. Low of 39 here. Onward. -
Still not too impressed with the AI models, but I honestly haven't looked at any verification scores.
-
Surprisingly frosty in the always cold beltsville farm fields
-
AI FTL on this one
-
0.00" would've been a nice blue ball storm in winter..with a few models teasing right until the end before the rug pull
-
Said I'll be Steined till November, I'll be Steined till November You tell my girl I'll be Steined till November, I'll be Steined till November I'll be Steined 'til November, you tell my girl yo I'll be Steined till November January, February, March, April, May Grass I see you dyin' but no time to spray I'll be Steined till November, I'll be Steined till November
-
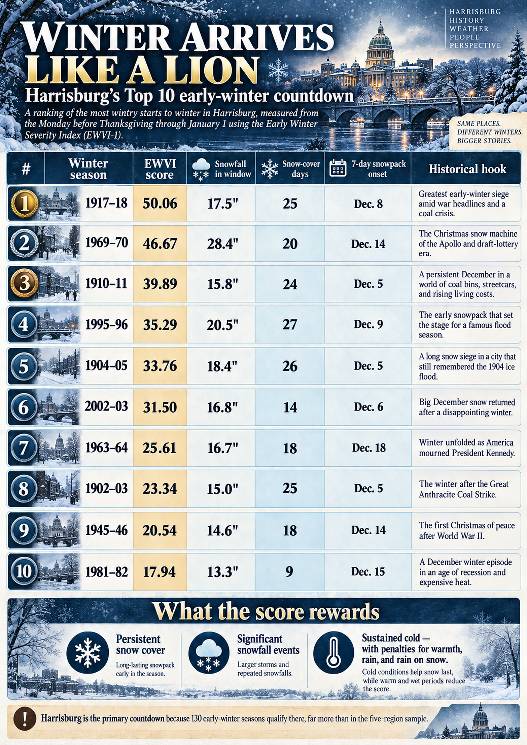
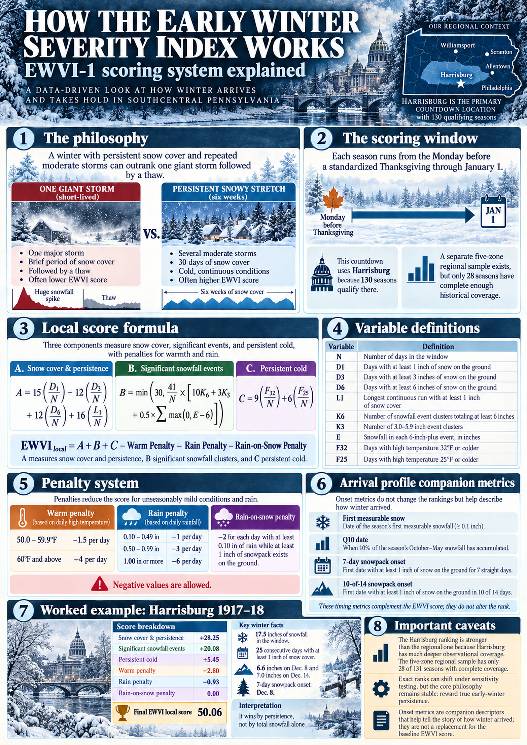
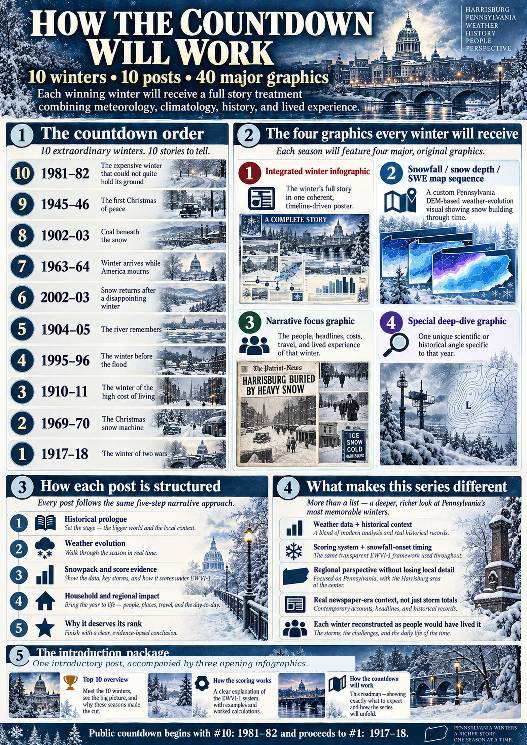
WINTER ARRIVES LIKE A LION Ten of Harrisburg's Most Wintry Starts to Winter, 1895–2026 TWO DECEMBERS. TWO VERY DIFFERENT WAYS TO REMEMBER WINTER. Imagine it is December 1917, and Christmas is approaching in Harrisburg, Pennsylvania. The United States is at war. Headlines speak of battles overseas, troop mobilization, and a newly declared war against Austria-Hungary. At home, people have a much more immediate concern: COAL. For many families, coal is not a quaint old-fashioned detail or a decorative fireplace accessory. It is what keeps the house warm. The warnings have been building for weeks. On November 26, the Harrisburg Telegraph reports that city officials are considering coal cards to manage an anthracite shortage. On December 4, it announces a 35-cent-per-ton increase in domestic anthracite prices. By December 18, the paper is reporting promised coal-car shipments for Harrisburg and Steelton, while ice on the Susquehanna interferes with river coal deliveries. Now think about what that means in a household with a coal-burning furnace. It is not even Christmas. The question is no longer whether the holiday will be white. It is whether the next coal delivery will come before the bin runs too low, and whether the household can afford it when it does. And the weather is not cooperating. Harrisburg records 6.6 inches of snow on December 8, followed by 7.0 inches on December 14. Snow cover establishes itself on December 8 and survives 25 consecutive days through New Year's Day, every one of those days maintaining at least three inches on the ground. There is a kind of winter that delivers a beautiful holiday scene. And then there is a winter that takes possession of the landscape while the people living in it are wondering how they're going to keep warm. Keep that December in mind for a moment. Now jump forward almost a century, to December 19, 2009. For many weather enthusiasts around central and southeastern Pennsylvania, the great pre-Christmas snowstorm is still a treasured memory. The Harrisburg station in our study measured 8.8 inches from that storm, with far greater totals farther southeast. For a little while, winter seemed to have arrived in spectacular fashion. But our full Thanksgiving-to-New-Year's analysis tells a surprising second story. Harrisburg accumulated 14.1 inches of snowfall during that 2009–10 scoring window, yet had only 11 days with at least an inch of snow on the ground, and its longest uninterrupted snow-covered stretch was seven days. Warmth, rain, and rain falling on snow outweighed much of the snowfall's positive contribution. Its final score was −4.88, placing it 44th among 130 eligible early winters. The December 2009 storm was memorable. The entire early-winter period was something else altogether. THAT IS THE CONTRAST AT THE HEART OF THIS PROJECT. One tremendous storm can make memories for a generation, while an older winter with less total snowfall can establish itself so thoroughly that the snow, the cold, the transportation problems, and even the fear of running short of heating fuel become part of everyday life. We're not ranking which storm was the most spectacular. We're asking something different: WHICH YEARS DID WINTER TRULY ARRIVE LIKE A LION, TAKE HOLD BEFORE THE NEW YEAR, AND REFUSE TO LET GO? HOW WE INVESTIGATED IT We examined 131 Thanksgiving-to-New-Year's periods, from 1895–96 through 2025–26, and found 130 with sufficient Harrisburg-area observations for our primary ranking. For consistency, each scoring window begins on the Monday before a standardized fourth-Thursday Thanksgiving and continues through January 1, inclusive. We use that calendar rule even in historical years when Thanksgiving was observed on a different day. We developed the Early Winter Severity Index (EWVI-1). Rather than simply adding up snowfall, it rewards three things. SNOW COVER AND STAYING POWER (UP TO 55 POSITIVE POINTS) Days with at least 1, 3, or 6 inches on the ground, plus the longest uninterrupted snow-covered run. SIGNIFICANT SNOWFALL EVENTS (UP TO 30 POSITIVE POINTS) Especially accumulating clusters of six inches or more. These clusters are defined from daily observations and are not automatically the same thing as individual meteorological storms. PERSISTENT COLD (UP TO 15 POSITIVE POINTS) Days when the high temperature remains at or below freezing, with additional credit for highs of 25°F or colder. Then the index subtracts points for strong warm-ups, confidently classified rainfall, and rain falling on existing snow cover. An otherwise impressive storm can belong to a disappointing overall early winter. Scores can even be negative, as our 2009 example shows. We also developed a separate winter-arrival profile. This examines the first measurable snow, the date by which 10% of the eventual October–May snowfall has accumulated, and the first confirmed seven-consecutive-day snowpack. Those are different clocks. A winter can deliver snow early without establishing lasting cover, and it can establish lasting cover before the bulk of the season's snow has arrived. These timing measurements add insight without changing the original EWVI rankings. This is a specific Harrisburg-area index, not a declaration about the ten greatest full winters in Pennsylvania history. A wider five-region investigation exists, but only 28 of 131 seasons currently meet its full overlapping data requirements. We'll use trustworthy regional observations to enhance the stories, without allowing missing early historical records to erase well-observed Harrisburg winters. WHAT THE THREE OPENING INFOGRAPHICS SHOW INFOGRAPHIC 1: THE HARRISBURG TOP 10 All ten ranked seasons, their EWVI scores, snowfall within the scoring window, number of snow-covered days, verified snowpack onset, and a glimpse of each year's historical setting. The rankings are revealed upfront. The countdown articles will explain how each winter earned its place. INFOGRAPHIC 2: HOW THE SCORING WORKS The actual equations, event definitions, snow-cover thresholds, cold points, warmth and rain deductions, and a worked example for our highest-scoring winter. It also shows how the separate onset measurements complement the main index. INFOGRAPHIC 3: THE COUNTDOWN ROADMAP Our plan is to travel from #10 to #1, one winter at a time, with four substantial high-resolution graphics for each year. Every winter will receive: 1) AN INTEGRATED MASTER INFOGRAPHIC Weather, historical setting, the exact score, and a coherent dated timeline woven together into one visually unified story. 2) A PENNSYLVANIA SNOWFALL, SNOW DEPTH, AND SWE PROGRESSION Using a custom Pennsylvania digital elevation model, we'll show the evolution of snowfall and snow cover through dated observations. Snow-water equivalent will be included where measurements or a defensible, clearly labeled model support it. Scattered station values will not be disguised as a fully observed statewide snowpack. 3) A HISTORICAL NARRATIVE GRAPHIC We'll explore contemporary headlines, transportation, heating, prices, and the human experience of that particular winter. 4) A SPECIAL DEEP DIVE UNIQUE TO THAT YEAR Whether it's a coal emergency, an extraordinary snow-cover streak, a succession of Christmas storms, or the flood risks lurking beyond the New Year, each winter will have its own distinctive story. WEATHER DOESN'T HAPPEN OUTSIDE HISTORY We will enter each year as though we do not already know what happens next. We'll examine the previous winter, summer, and fall, then follow the weather one day at a time through the contemporary world people actually inhabited. A family in 1902 had different heating problems, wages, travel options, and forecast information from a family in 1981 or a weather enthusiast online in 2002. That matters. So do the details. What did a ton of coal cost? What could a dollar buy? Were streets and railroads passable? What were families reading at breakfast? What could they reasonably have expected from tomorrow's weather? Original newspaper reporting and historical photographs will be distinguished from illustrations and narrative reconstruction. Weather station readings will be distinguished from estimates. Where the surviving records cannot support a claim, we'll say so. AND NOW, THE COUNTDOWN We begin with #10: 1981–82, a winter that gave Harrisburg nine consecutive snow-covered days in December before the snowpack retreated. Eventually we will arrive at #1: 1917–18, where those wartime coal headlines and the extraordinary December snowpack await us again, in their full historical setting. TEN WINTERS. TEN JOURNEYS INTO THE PAST. FORTY MAJOR GRAPHICS. Some winters give you one great storm to remember. Others take over your roads, your calendar, your landscape, and, in an era of fuel shortages, your thoughts about whether there's enough coal left to get through the next cold night. Let's find out which winters really arrived like a lion. RESEARCH AND SOURCE NOTES The 1917 coal-shortage context comes from contemporary Harrisburg Telegraph reporting on November 26, December 4, and December 18, 1917. These reports document rationing discussions, price increases, shipment efforts, and ice-related delivery difficulties. They do not establish that all or most Harrisburg households had exhausted their entire heating-fuel supply by Christmas. Historical newspaper sources: November 26, 1917: https://newspaperarchive.com/harrisburg-telegraph-nov-26-1917-p-1/ December 4, 1917: https://newspaperarchive.com/harrisburg-telegraph-dec-04-1917-p-1/ December 18, 1917: https://newspaperarchive.com/harrisburg-telegraph-dec-18-1917-p-1/ Snowfall totals, snow-cover runs, EWVI scores, and the 2009–10 rank come from the project's Harrisburg station analysis and EWVI-1 scoring tables. The three introductory posters contain interpretive winter and historical imagery. They are not archival photographs or measured statewide historical snow fields. Dated observations, reconstructions, and source methods will be documented throughout the series. Sent from my SM-S731U using Tapatalk
-

2026 Atlantic Hurricane Season
OSUmetstud replied to Stormchaserchuck1's topic in Tropical Headquarters
Josephine sustained deep convection within the rmw for about 18 to 24 hours. Looks like its more open this morning as it goes over a colder eddy and begins extratropical transition. -
Not much going on for the foreseeable future
-
 zithromax pill and zithromax cost australia order zithromax without prescription http://images.google.al/url?sa=t&url=https://zpacksupply.com zithromax drugand https://kamayegaindia.com/user/ukiybcvaky/?um_action=edit generic zithromax azithromycin [url=http://maps.google.ml/url?q=https://zpacksupply.com]order zithromax without prescription[/url] zithromax 500 tabletand [url=http://lostfilmhd.com/user/hyagzzgecy/]how to buy zithromax online[/url] order zithromax without prescription
-
Frost wouldn’t phase it either
-
That is awesome! Sure they will ensure it is polished before making it operational, however. Sounds great, though!