OSUmetstud
-
Posts
16,533 -
Joined
-
Last visited
About OSUmetstud

- Birthday 04/21/1985
Recent Profile Visitors
.thumb.jpg.ad3a2e31d30aff035044689b311a0540.jpg)




.thumb.jpg.a628c2147efdff1c820341d5143d9237.jpg)


-
2026-2027 Record-breaking El Nino
OSUmetstud replied to Stormchaserchuck1's topic in Weather Forecasting and Discussion
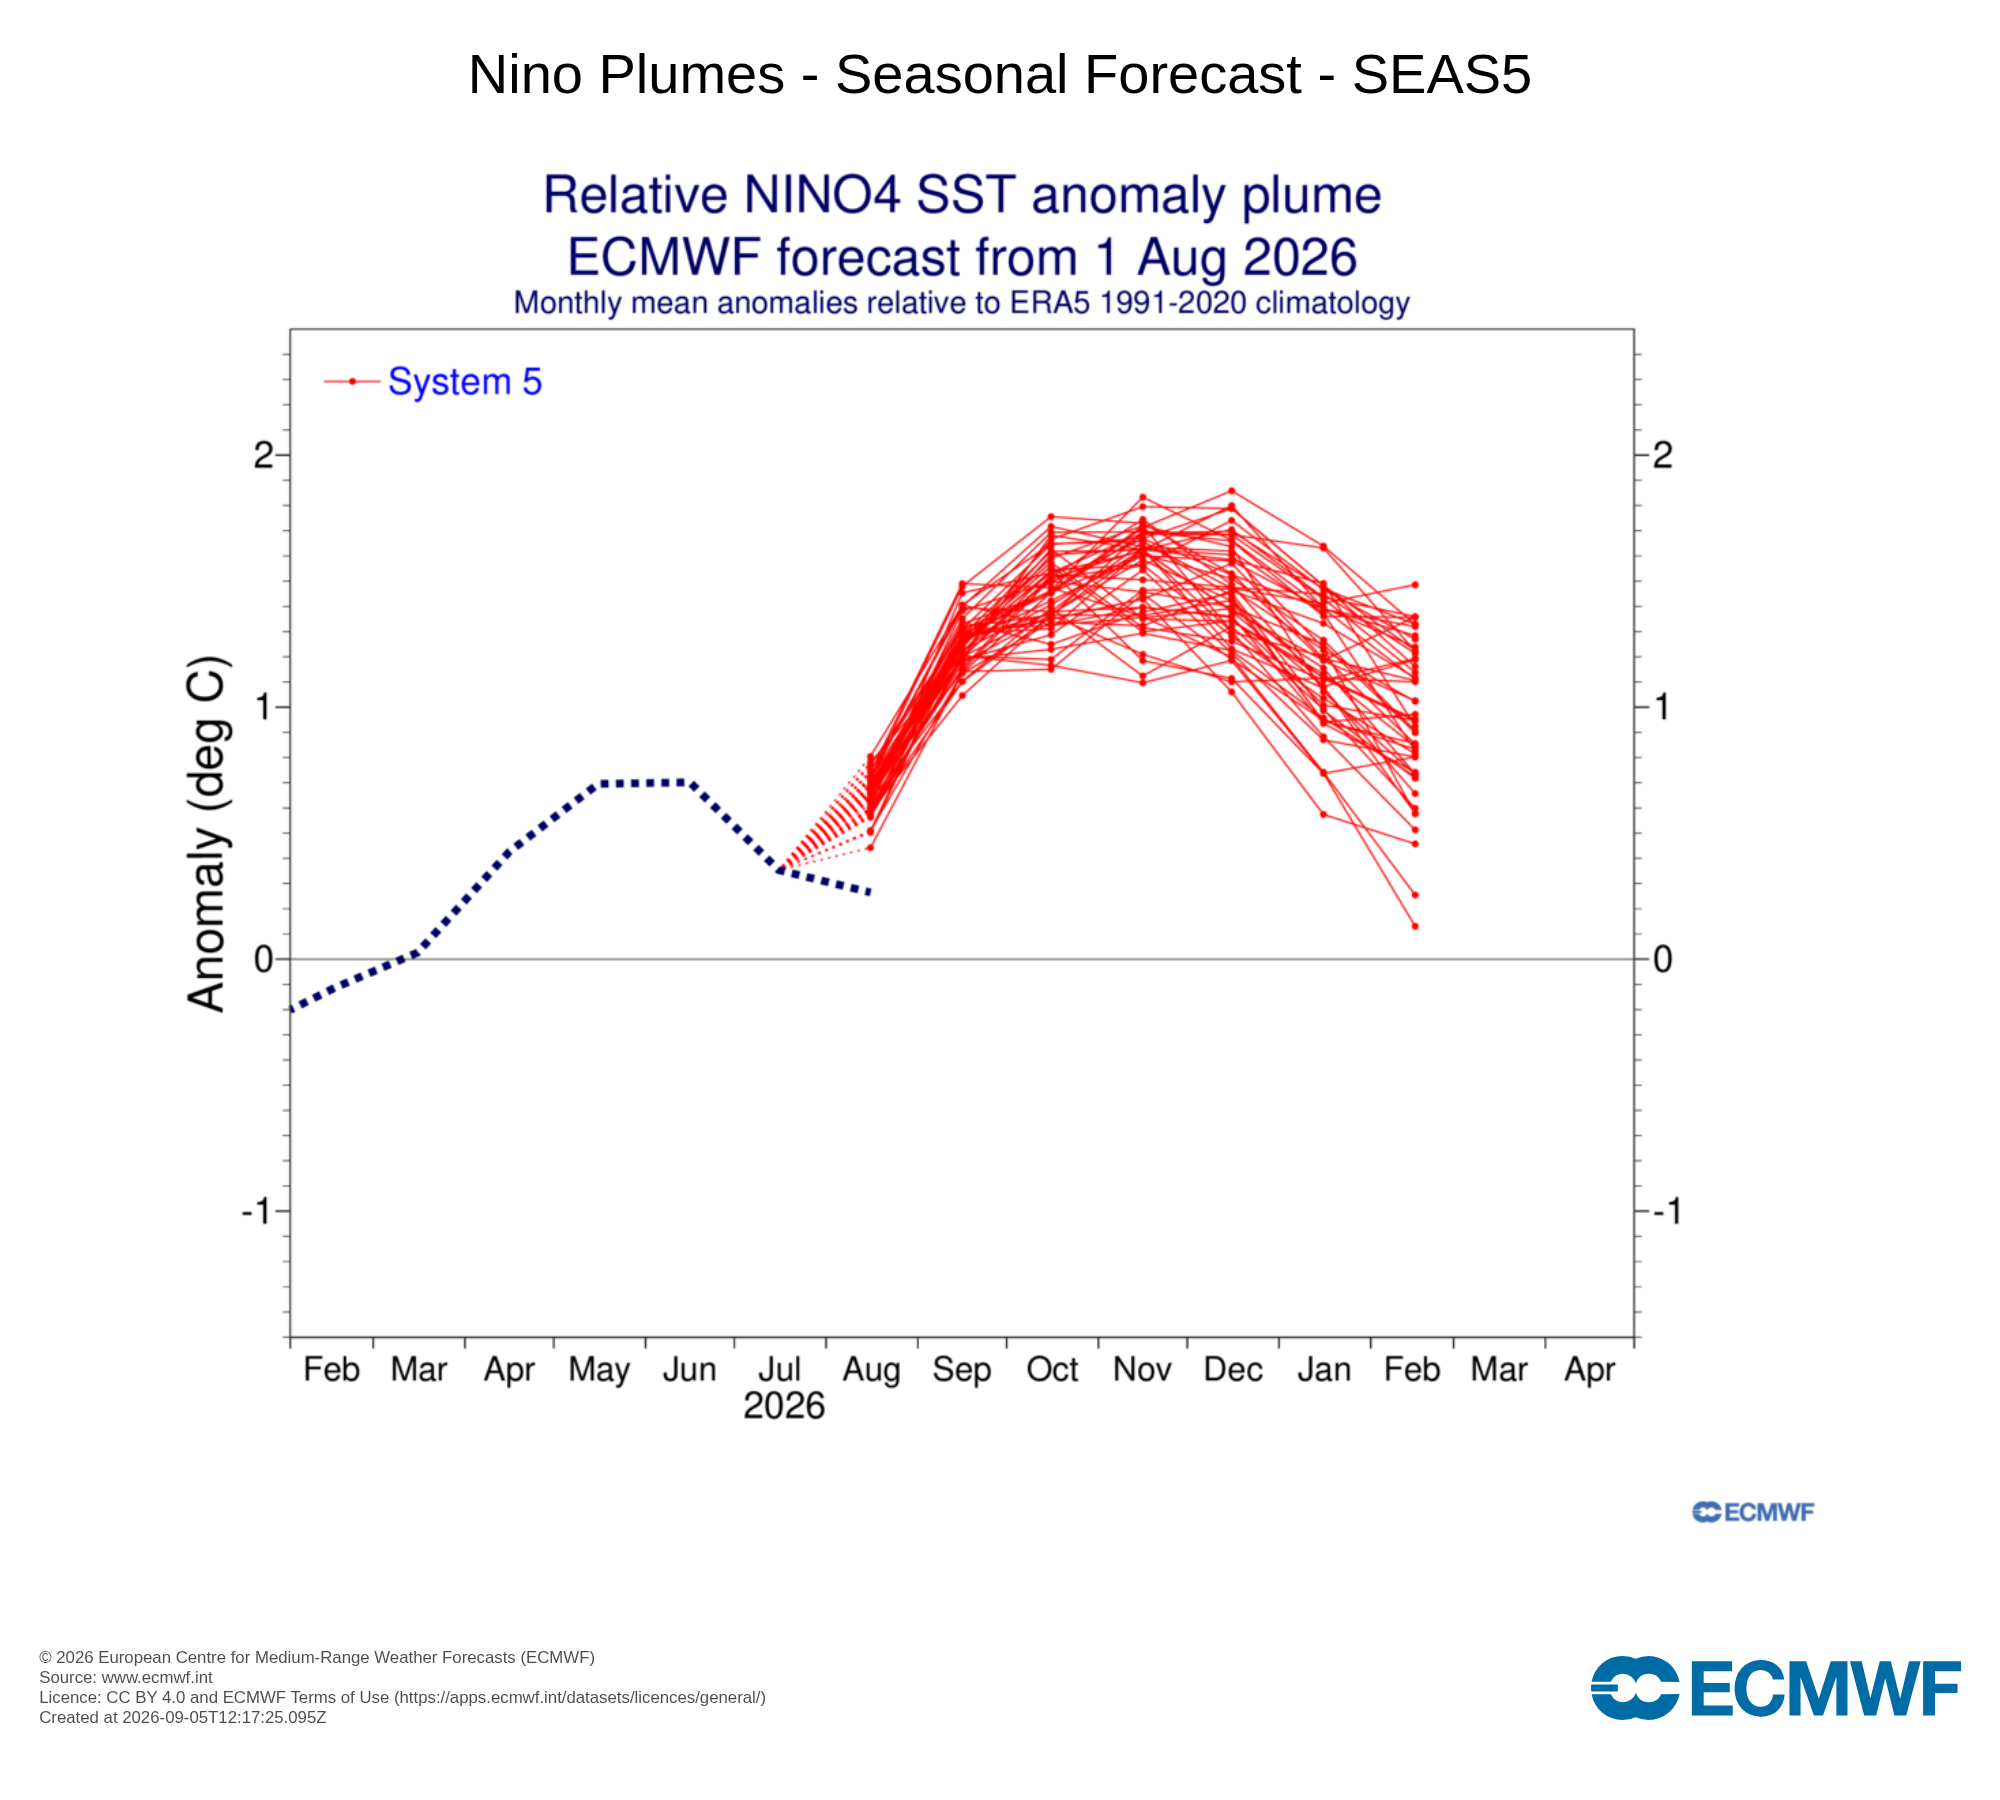
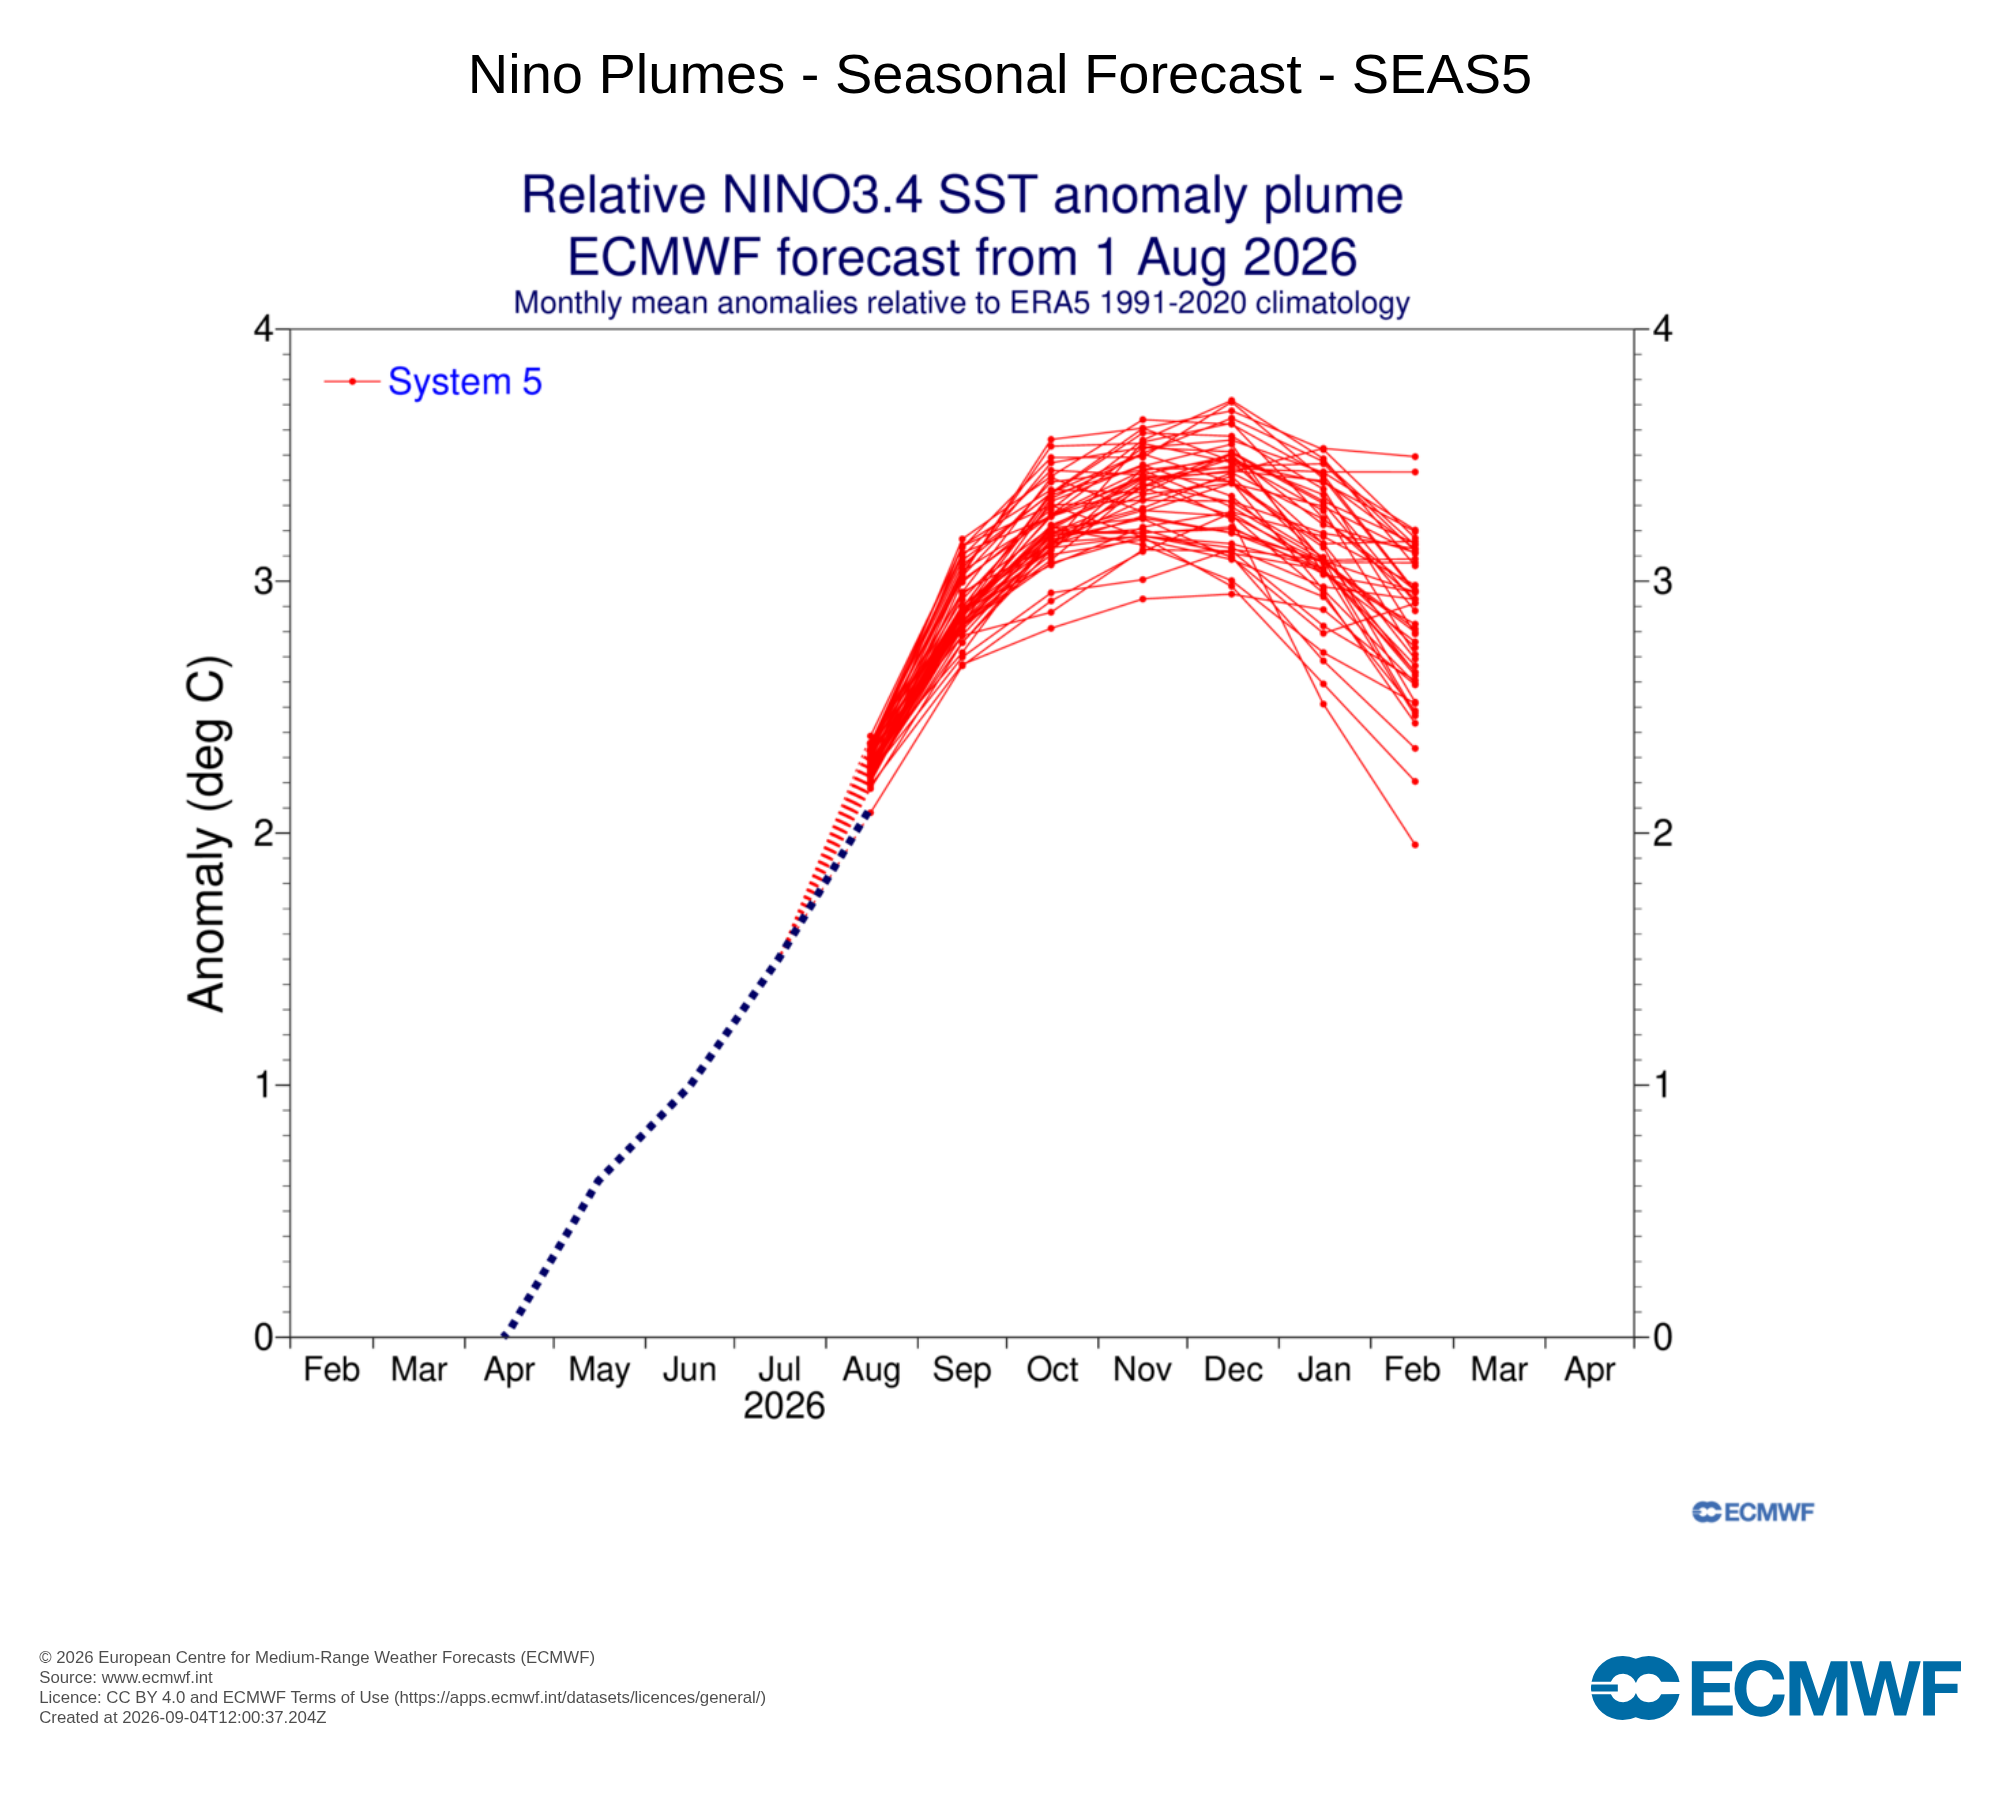
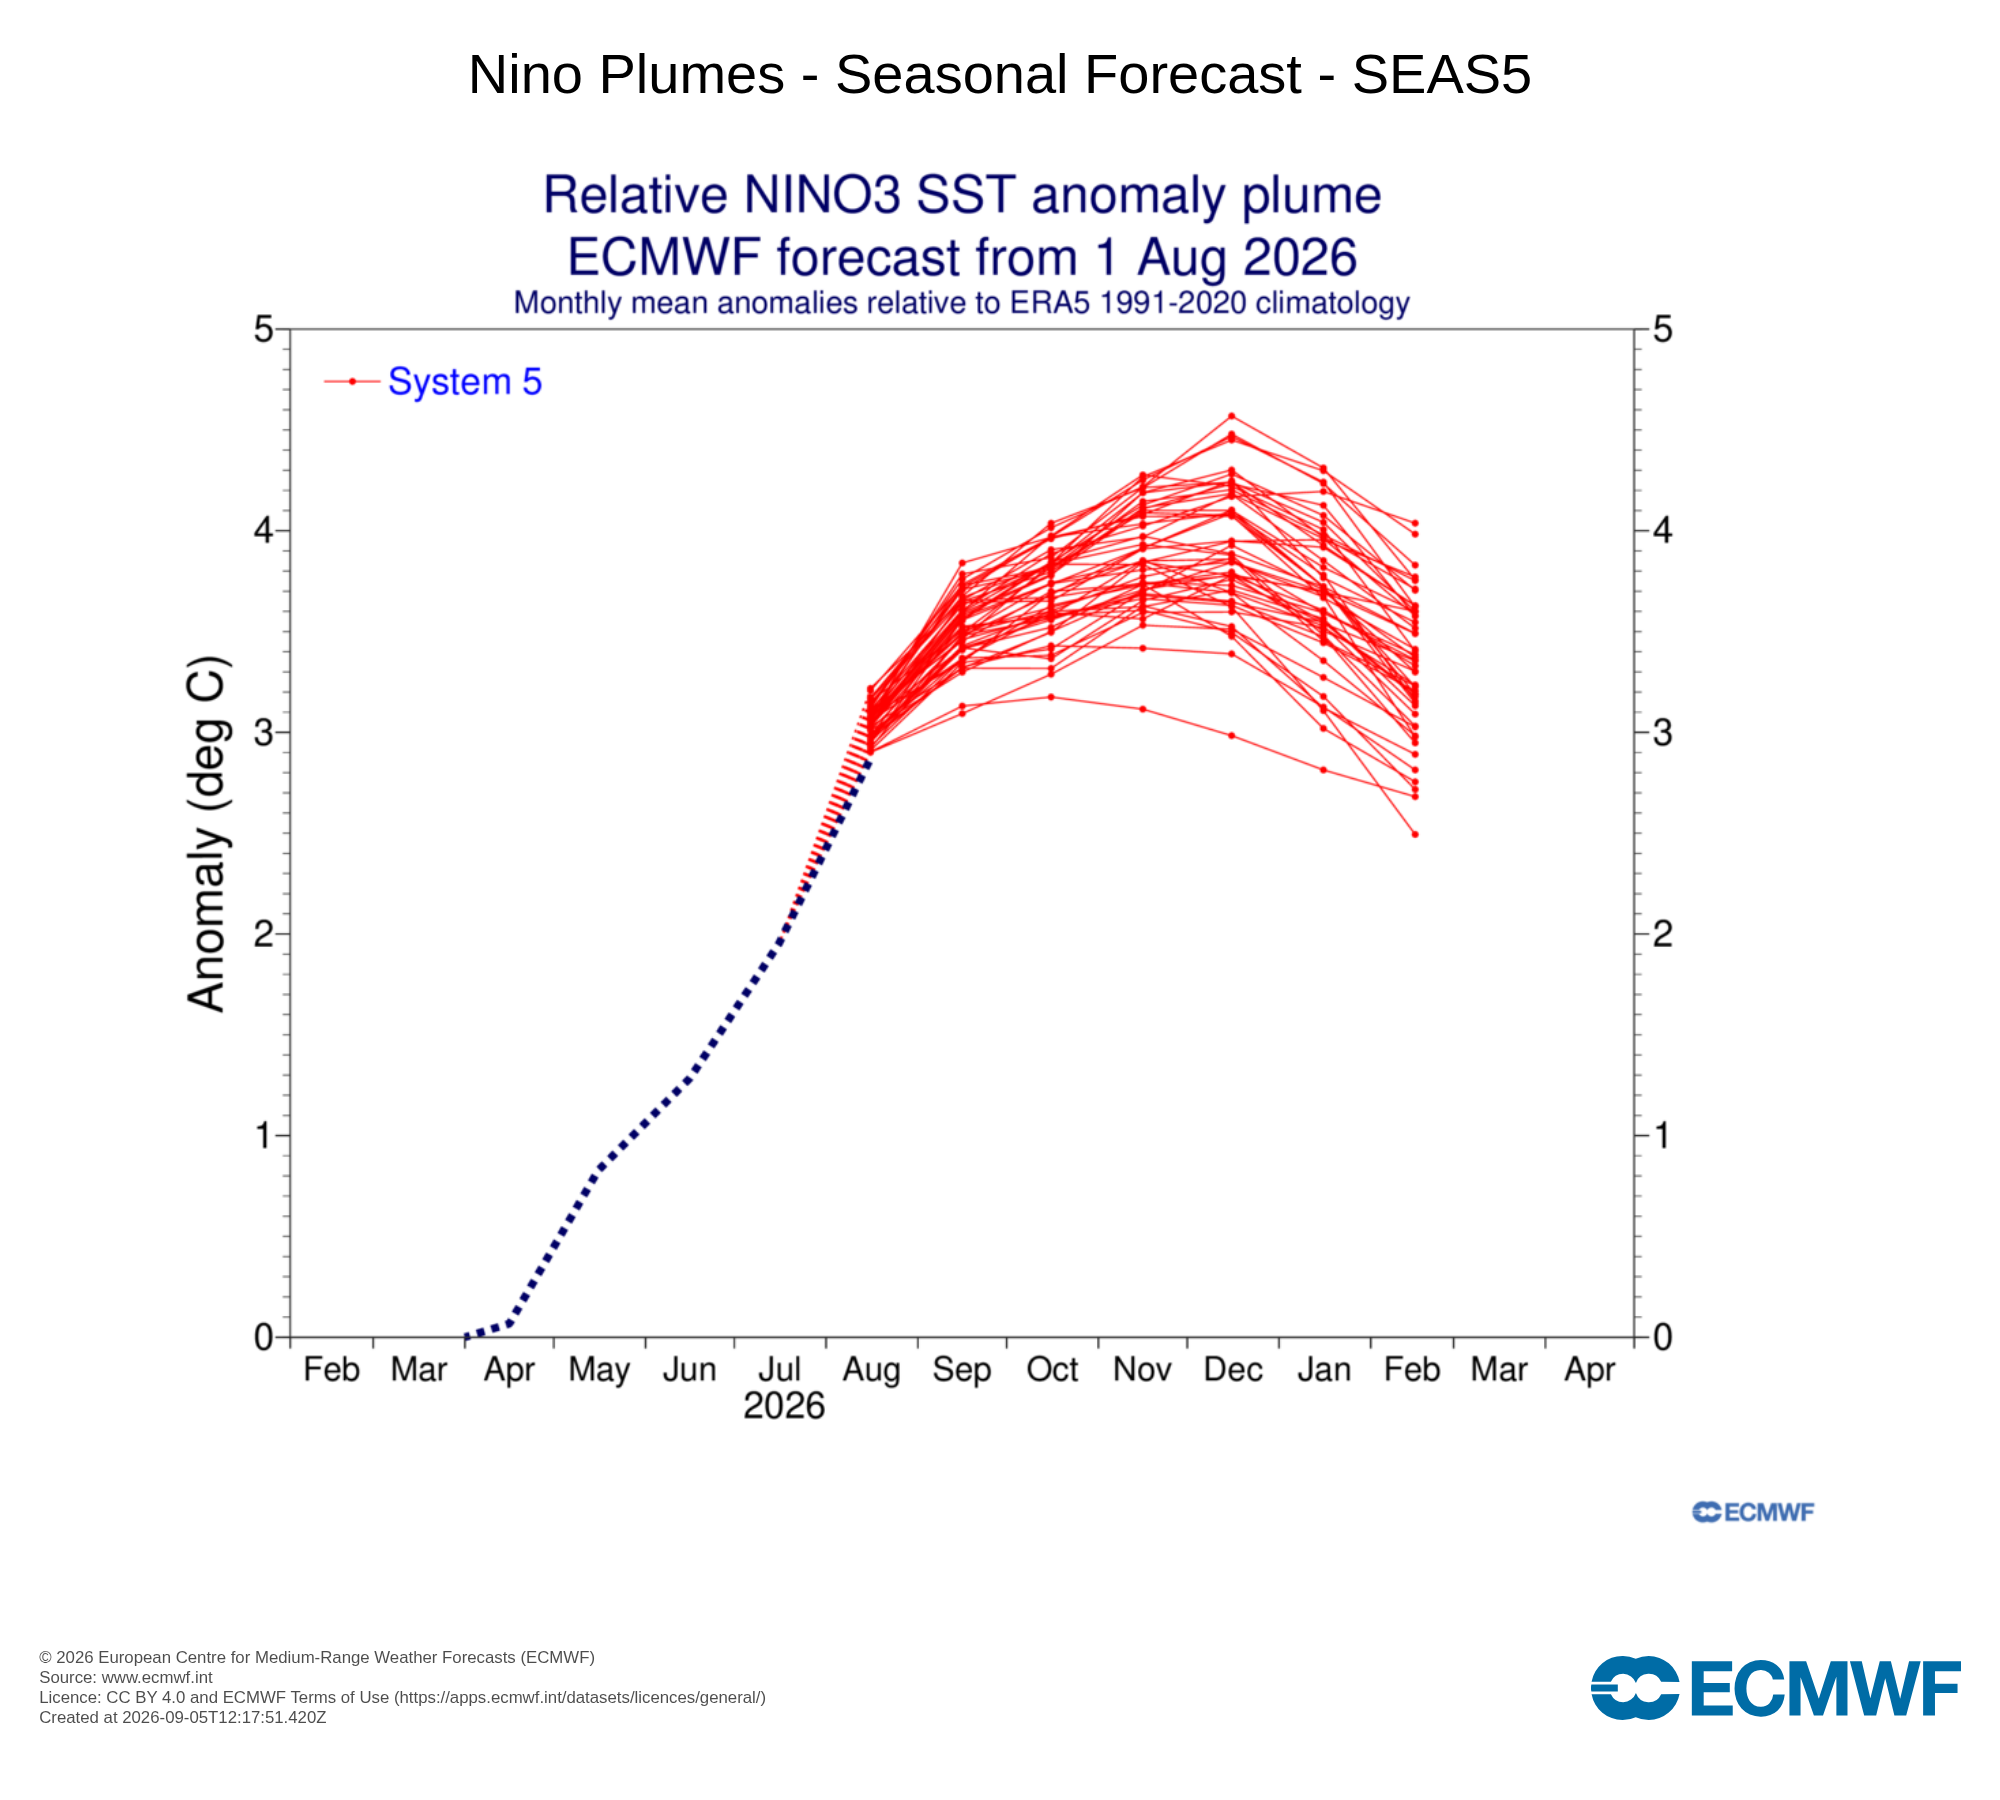
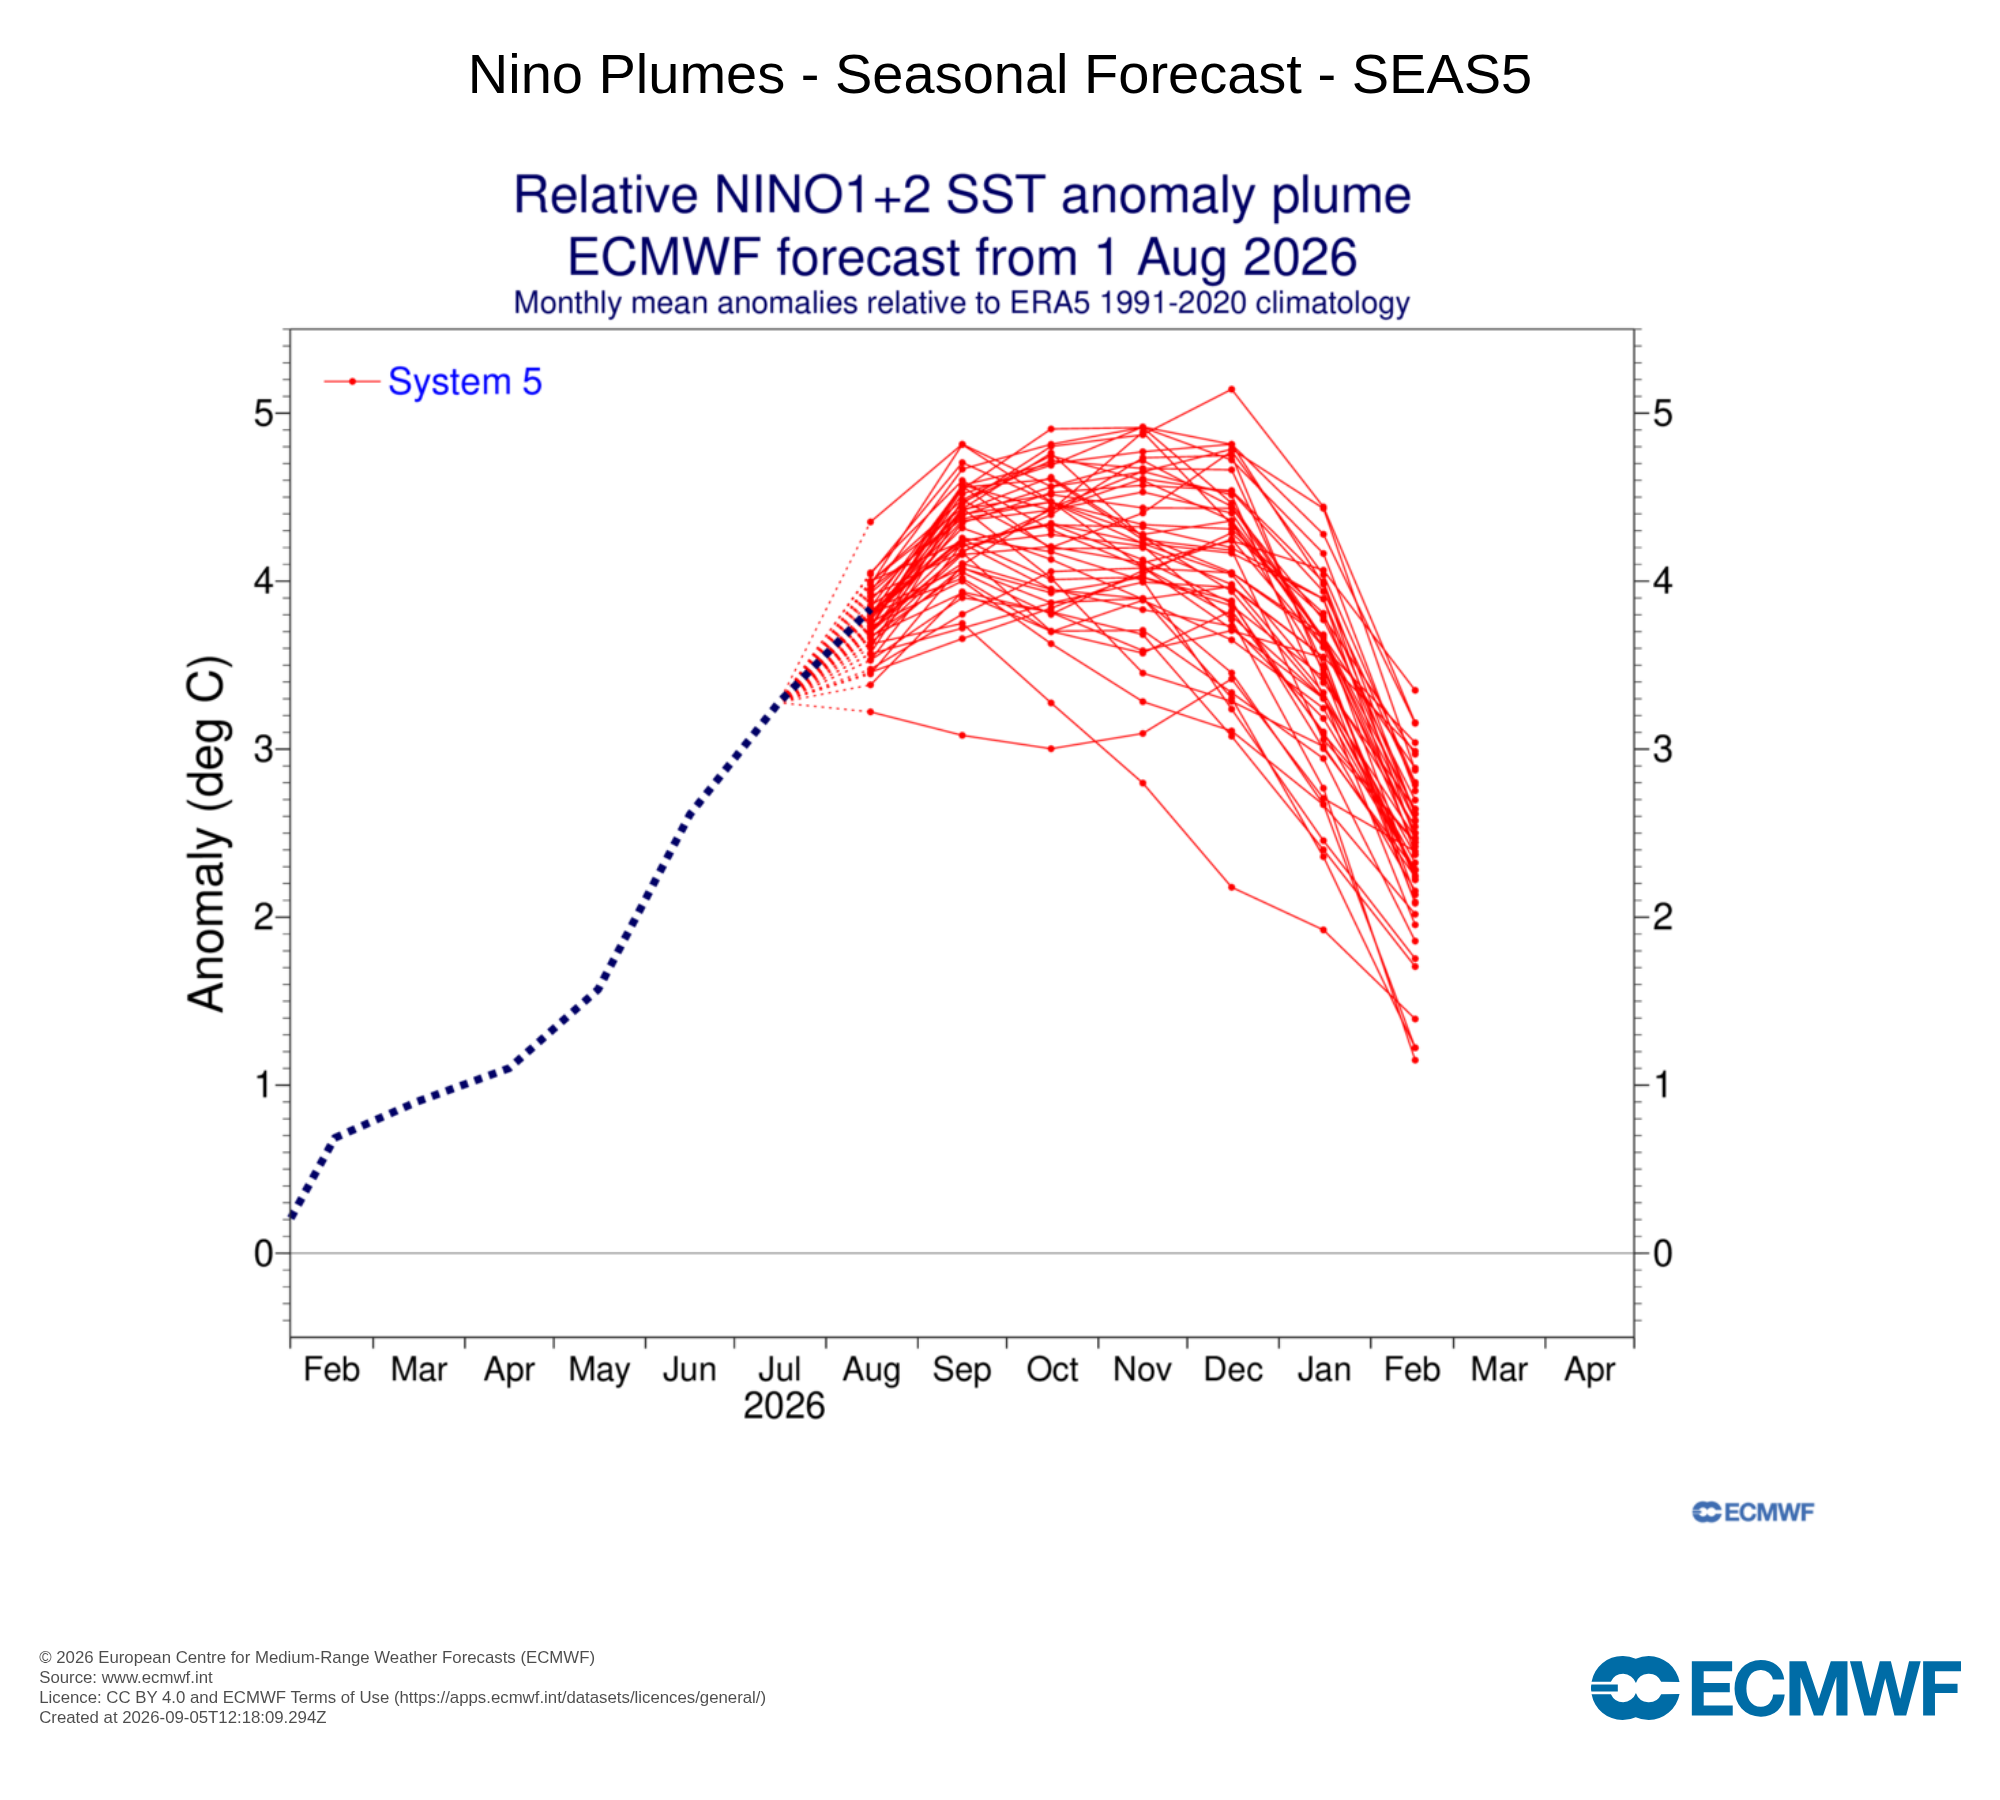
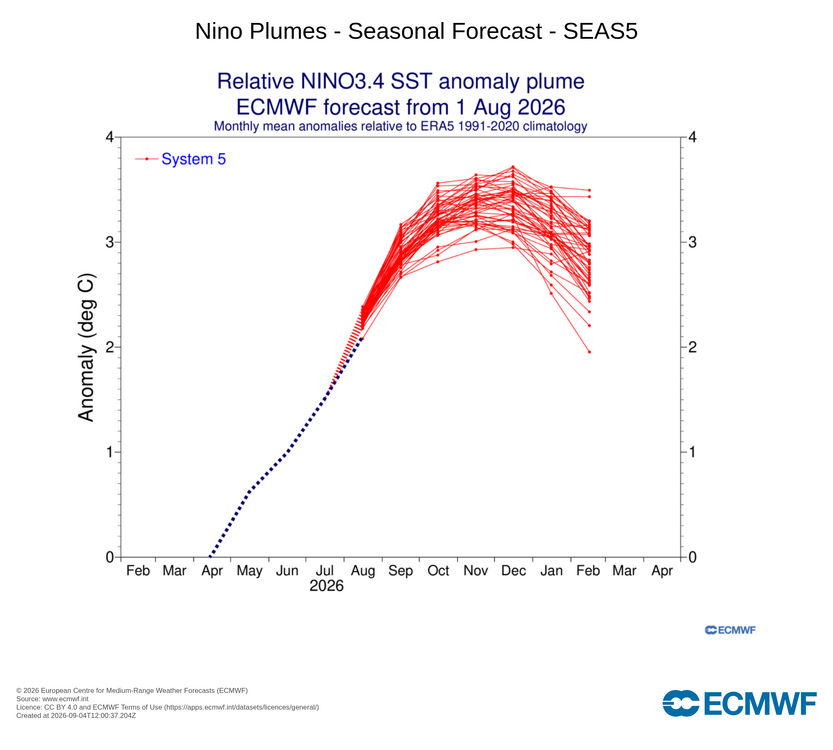
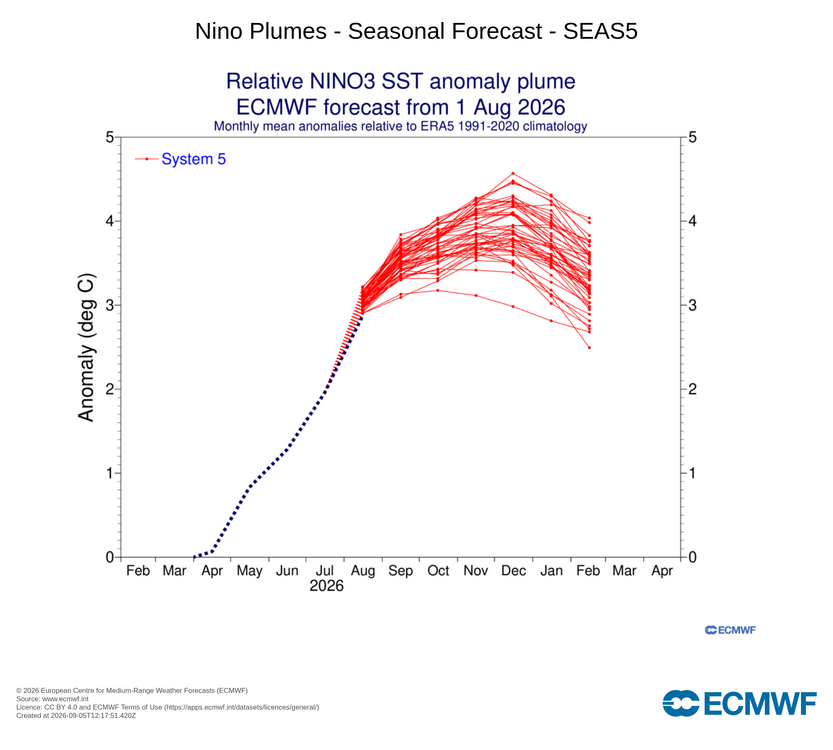
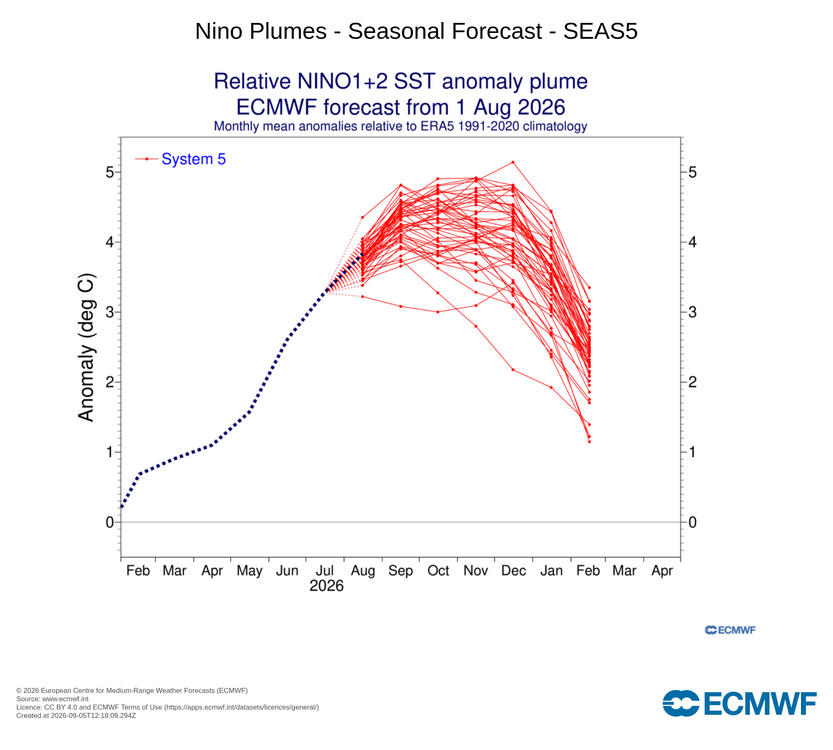
Nino 1+2 end up on the higher side of the average. The decreasing warm anomaly in Nino 4 was a big miss...falling completely outside of the ensemble spread. The forecasts for both Nino 3 and Nino 3.4 were near the bottom of guidance. RONI makes a difference but the sst analysis/database matters a lot too. ERA5/OSTIA puts the Nino 3.4 RONI around 2.1C whereas NOAA ERSSTv6 puts it at 1.7C. This is due to both very high resolution (0.05 degrees) and the inclusions of satellite-based SST analysis. The best forecasts from ECMWF from today and CPC/IRI plumes from late August still show this as a clearly record breaking Nino event with a RONI peak between 3 and 3.5C.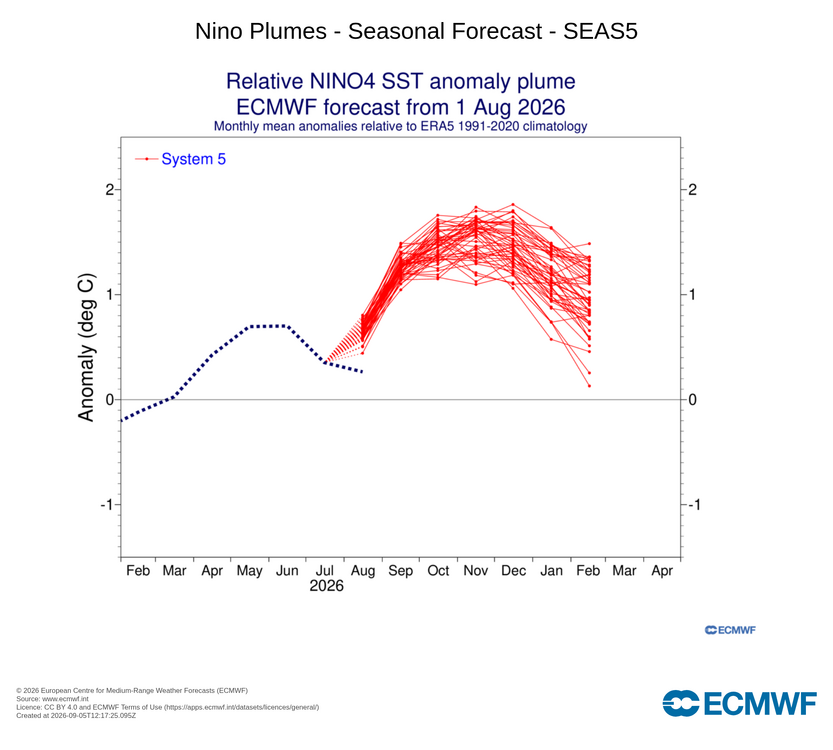
-
2026-2027 Record-breaking El Nino
OSUmetstud replied to Stormchaserchuck1's topic in Weather Forecasting and Discussion
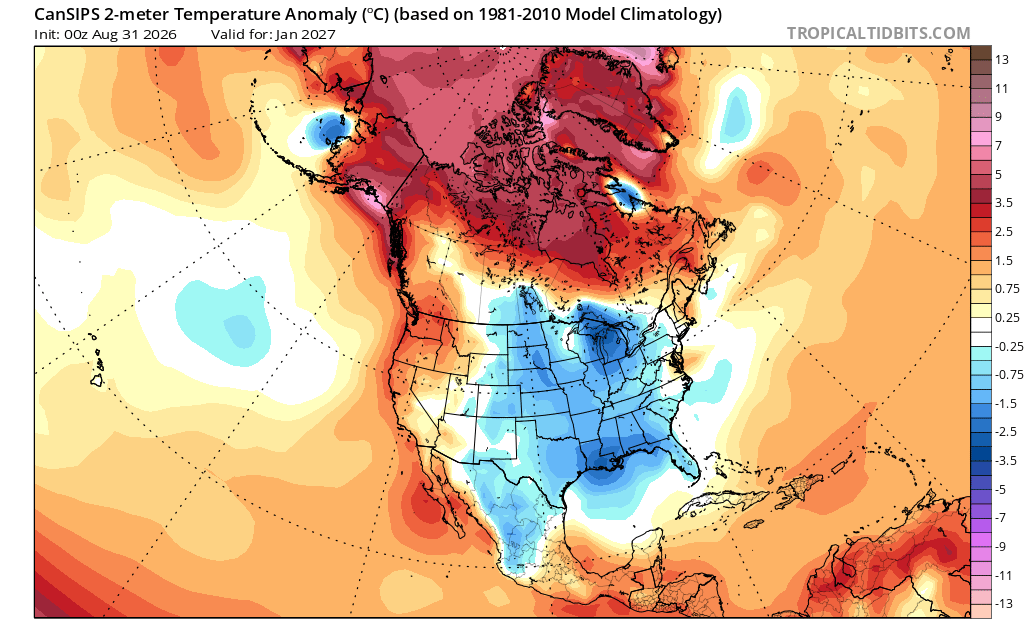
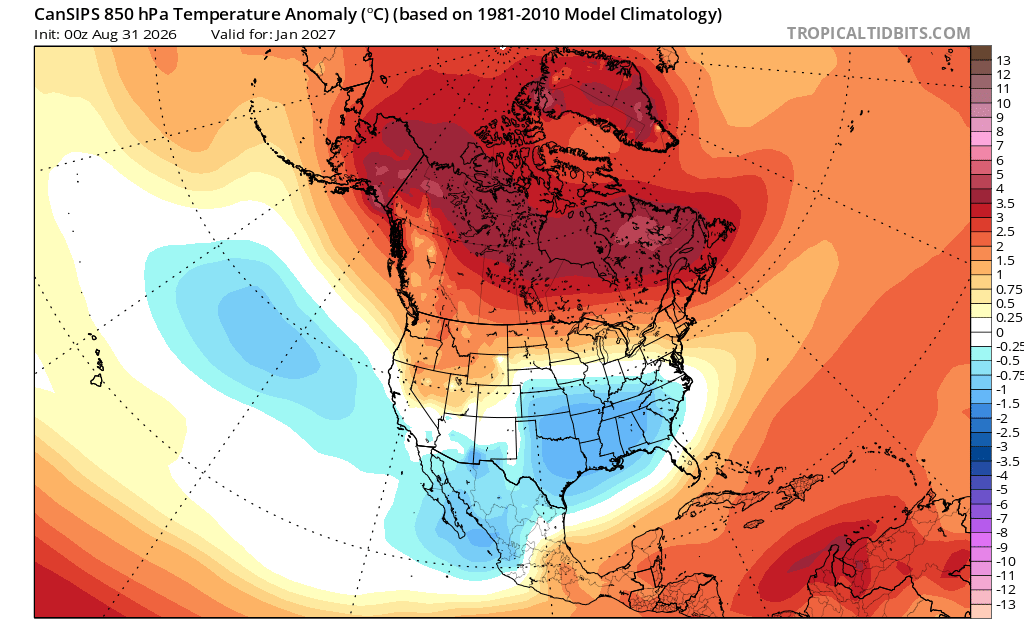
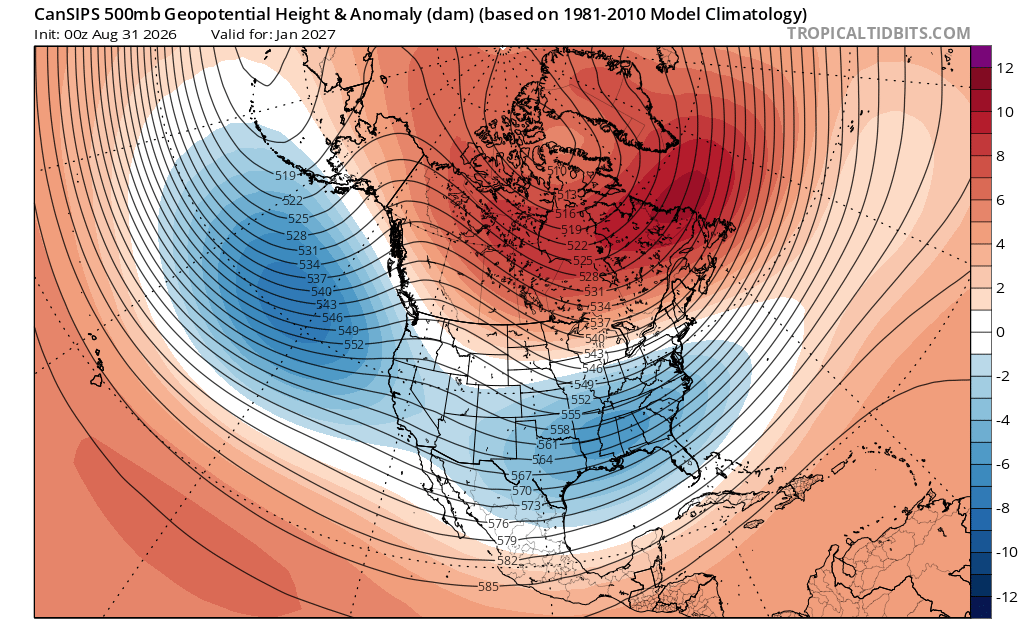
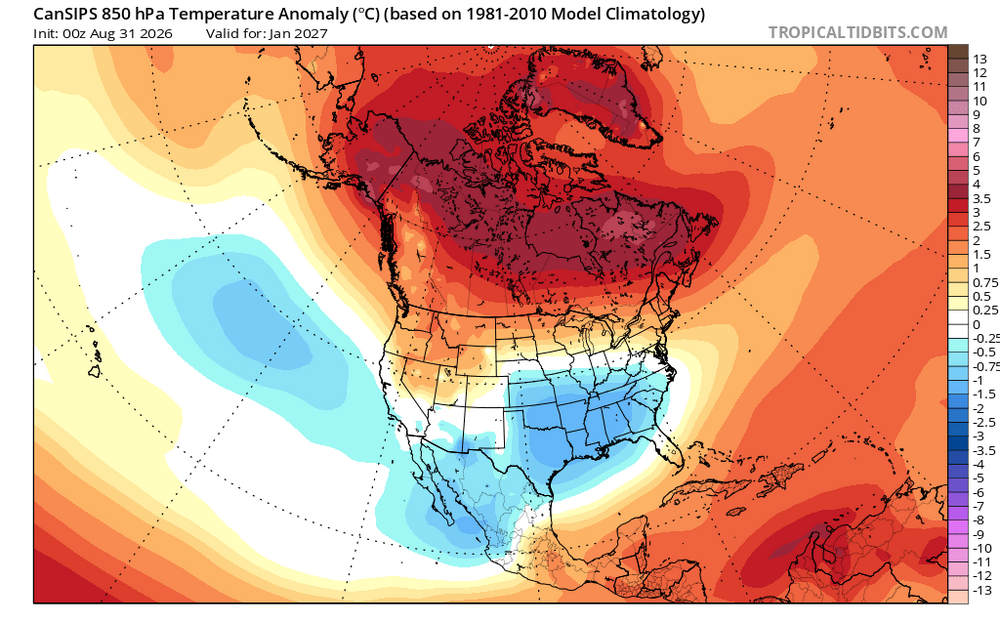
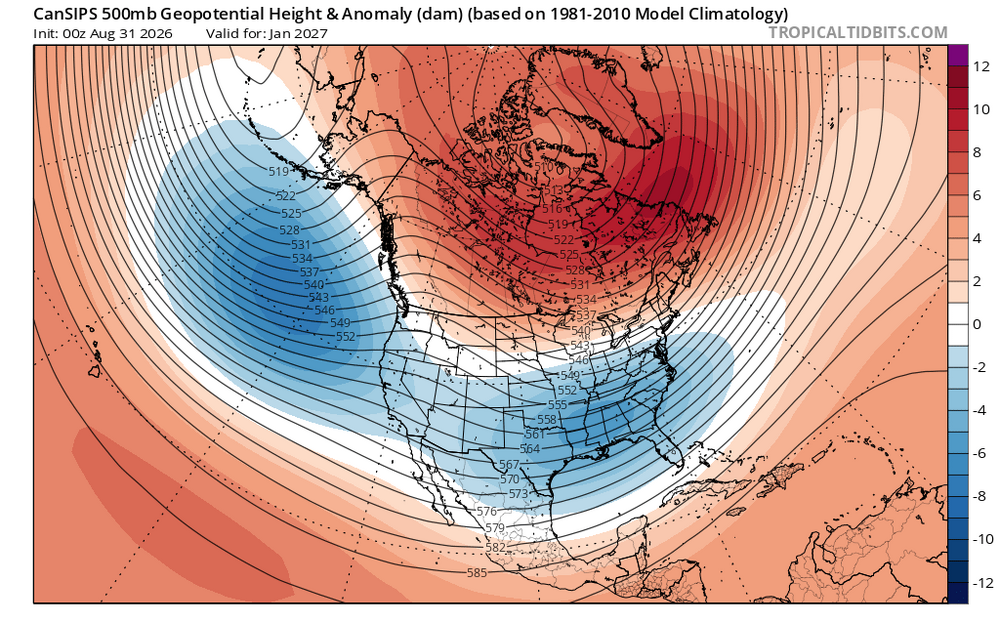
There's far too much disconnect with the 2m temp and 850mb temp on the CANSIPS over the Great Lakes. Maybe some sort of model issue?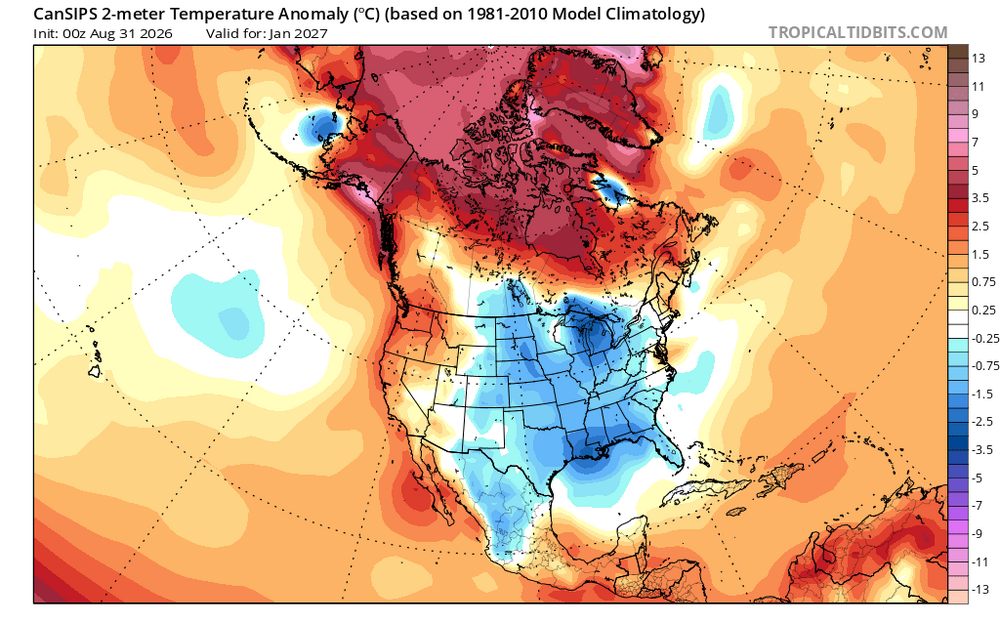
-
2026-2027 Record-breaking El Nino
OSUmetstud replied to Stormchaserchuck1's topic in Weather Forecasting and Discussion
Because of this, the offical NOAA monthly data will likely be in the neighborhood of maybe like 2.2C for non-relative nino 3.4 and 1.8C for relative for August. BOM, UKMET, and ECMWF data may run warmer because of the difference in sst analysis and the integration of high resolution sst data that noaa is not doing. -
2026-2027 Record-breaking El Nino
OSUmetstud replied to Stormchaserchuck1's topic in Weather Forecasting and Discussion
Ahh..okay. So the main disconnect im seeing with the cooler relative noaa data is the actually the difference in sst analysis. The non-relative oisstv2.1 is running considerably warmer than the non-relative ersstv6. This is because of the courser nature of ersstv6 and the lack of satellite data integration. The ersstv6 is best for historical comparisons but it will tend to not see the real warmest anomalies because of its nature. -
2026-2027 Record-breaking El Nino
OSUmetstud replied to Stormchaserchuck1's topic in Weather Forecasting and Discussion
Mid point on the multi systems and the ecmwf plumes for rino 3.4 in August is about 2.2 C. I think the official noaa value should be fairly close to that number. That's an approximate warming of between 0.7 and 0.8C month over month. The funny thing in all this is some of this possible first month that nino doesnt beat nearly all forecasts thing is because the greatest surface and subsurface anomaly is located east of Nino 3.4. Thats not evidence of weakness. -
2026-2027 Record-breaking El Nino
OSUmetstud replied to Stormchaserchuck1's topic in Weather Forecasting and Discussion
I believe the weekly nino 3.4 sst data by the cpc does not apply the scaling factor that's used in the monthly/trimonthly offical nino 3.4 data. The scaling factor for August is 1.16/1.17 per the RONI paper. So the monthly RONI Nino 3.4 data for August should be in the neighborhood of ~2.2C as opposed to ~1.8C. Its at the very least a different data set. -
2026-2027 Record-breaking El Nino
OSUmetstud replied to Stormchaserchuck1's topic in Weather Forecasting and Discussion
The reduction from traditional nino to relative nino seems different on various sources. The August forecast from the ecmwf had about a 0.8 reduction between the 2. The current noaa weekly sst data is reducing the relative nino by about 0.9 compared to traditional (1.8 v. 2.7). BOM has 2.3 v. 2.8 and the cyclonicwx site has 2.2 v. 2.6. I dont think this means much to the weather or the climate generally but could make a difference when it comes to records and such. Its probably something to do with sst data set differences and perhaps some differences on how it adjusts for the 50 year variance. -
2026-2027 Record-breaking El Nino
OSUmetstud replied to Stormchaserchuck1's topic in Weather Forecasting and Discussion
The June monthly OISST data was actually adjusted by 0.51. (1.55 v 1.04). -
2026-2027 Record-breaking El Nino
OSUmetstud replied to Stormchaserchuck1's topic in Weather Forecasting and Discussion
I believe because the nino itself is increasing the 20N-20S SSTs. -
2026-2027 Record-breaking El Nino
OSUmetstud replied to Stormchaserchuck1's topic in Weather Forecasting and Discussion
Roundy mentioned some issues with this method that sort of make sense to me. Im paraphrasing of course but its like youre punishing the el nino thats partially responsible for the increase of SSTs in the 20S-N band in the first place. There may be better ways to normalize the agw signal in the calculation. -
2026-2027 Record-breaking El Nino
OSUmetstud replied to Stormchaserchuck1's topic in Weather Forecasting and Discussion
The main difference is that NOAAs RONI reduction is larger. The raw weekly anomaly is 2.3. They subtracted 0.8. -
2026-2027 Record-breaking El Nino
OSUmetstud replied to Stormchaserchuck1's topic in Weather Forecasting and Discussion
The TNI is the more typical way to look at it and with Nino 4 historically warm right now it's going to be hard to more east-based than 1997. -
Helene is not east of 84 w anyway. It's latest position is 84.2.
-
I don't really understand the question. The spaghetti models are not wholly separate from the global models. The global models are here on these plots...they're just adjusted for the current position of the hurricane in time. These are the models the nhc has used for years. The same ones.
-
The northern eyewall is the only part producing lightning. The southern eyewall is likely not open but it's also weaker.