All Activity
- Past hour
-
 Up to 74* under full July sun at 1:00pm. coc
 -
Obnoxious how this pattern hit right after the point of no return for 1/3 of my grass. Pete (my robot mower) is working his a** off to keep up to no avail. He hates working on Sundays but he’s about to get sent into the fog of war again.
-
SPC has marginal risk out for 5% damaging wind for the aforementioned mcs diving down from the north today possibly potentially .
-
(002).thumb.png.6e3d9d46bca5fe41aab7a74871dd8af8.png) @chubbs below is some more detailed research and some solid evidence below to find if the single station NCEI applied cooling adjustments to Coatesville 1SW are supported by surrounding stations. For site moves and TOB changes. The final finding is that the clean evidence points to a real, still-unexplained cooling signal during at least the 1952-1982 portion of this period -- not caused by a location move or TOB change (neither was validated), Also Station relocation, across the 88-year period with usable NCEI-adjusted data (1895-1982) spanning the station's six relocations, never shows up as an independent, validated driver of any adjustment on its own. Take a look at the below and let me know what this analysis is missing? This is only for Coatesville 1SW raw vs the NCEI adjusted for that individual station. Based on this I will look to see if the other NCEI station adjustments to the raw data are valid and supported by the data. I have much more supporting data so feel free to ask and I will provide more data. Coatesville 1SW: Overall Testing Approach and Findings Overall Testing Approach 1. Pulled Coatesville 1SW's exact location and observation-time history from NCEI's HOMR database -- six site relocations and five distinct observation-schedule eras spanning 1888-1982, independently verified against the live HOMR page and a user-provided satellite image of the final site. 2. Initially tested using NCEI's own adjustment as the yardstick (comparing how the adjustment changed before/after each documented event). This is where standard time-of-observation-bias (TOB) theory first looked promising, then broke down: an all-morning schedule (1946-1982) should need little or no adjustment under TOB theory, not the sustained cooling actually applied. 3. Switched to raw-data-only testing -- the methodologically correct approach, since testing against NCEI's own output can't establish whether that output was justified in the first place. For each of Coatesville's 7 documented events, compared Coatesville's raw record against every available nearby raw-data station in clean, non-overlapping before/after windows. 4. Required cross-validation across independent references -- an event only counted as a real, validated discontinuity if multiple neighbor stations agreed on the direction of the shift, not just one. This is the key filter separating genuine breaks from ordinary weather noise. Expanded from 2 to up to 4 reference stations (West Chester 2 NW, Phoenixville 1E, Kennett Square, Sadsburyville) depending on era. 5. Result: only 3 of 7 documented events passed. 1916, 1922, and 1946 showed real, multi-station-confirmed shifts. 1902, 1910, 1930, and 1948 did not -- either unconfirmable (no second reference available) or references actively disagreeing (the signature of noise, not a real break). 6. Built a raw-justified adjustment chain using only those 3 validated steps, anchored to the stable, unchanged 1946-1982 era as a zero baseline, and compared it decade-by-decade against NCEI's actual adjustment, with formal significance testing at each step. Overall Finding NCEI's adjustment ran colder than the raw evidence supports in every single decade from the 1890s through the 1980s, with no exceptions. Restricting to the 8 complete decades (1900s-1970s), 6 of 8 reach conventional statistical significance (1900s, 1910s, 1930s, 1940s, 1950s, 1960s); the other two (1920s, 1970s) don't reach significance individually but still point the same direction. Pooled across all 88 years, the effect is overwhelming (p < 0.0001). The size of the over-cooling does not trend over time -- it is a persistent, roughly steady bias, not something that worsened or improved across the record. See "Raw vs NCEI vs Corrected Trend" for the full year-by-year data, decade table, and significance tests. Adjustment Broken Out by Rationale (all 7 documented events) Of NCEI's stated PHA rationale categories, only station relocation and observation-time change could be directly tested here. Only 3 of the 7 documented events show real, cross-validated evidence. Event Rationale Category Validated? Contribution to the Adjustment Chain 1902 Location move No -- single reference, unconfirmable 0 (no independent step; folded into the 1902-1915 era) 1910 TOB change No -- 2 references disagree in direction 0 (no independent step; folded into the 1902-1915 era) 1916 Location move + TOB shift (simultaneous) Yes -- 4 references agree +0.36°F, partially OFFSETTING (applies to 1902-1915 only; can't attribute to either cause alone) 1922 TOB change (location unchanged) Yes -- 3 references agree -1.28°F, the entire step applied to 1922-1945 1930 Location move No -- 2 references disagree in direction 0 (no step between 1922-1945 and 1946-1982) 1946 TOB change (location unchanged) Yes -- 2 references agree (thin sample) Combined with 1922: the entire -2.11°F applied to 1916-1921 1948 Location move No -- 2 references disagree in direction 0 (1946-1982 treated as one continuous baseline era) PRACTICAL ANSWER: of all 7 documented events, only 3 (1916, 1922, 1946) show real, cross-validated raw discontinuities -- 2 of those 3 (1922, 1946) are TOB changes with no location change; the third (1916) is an inseparable combined event. The 4 location-related events (1902, 1910, 1930, 1948) show no validated evidence at all. Station relocation, across the 88-year period with usable NCEI-adjusted data (1895-1982) spanning the station's six relocations, never shows up as an independent, validated driver of any adjustment on its own. Important: What "TOB" Explains Here, and What It Does Not The "TOB" label in the table above explains why the RECONSTRUCTED adjustment chain steps DOWN between eras (e.g. why 1922-1945 sits 1.28°F below the 1946-1982 baseline) -- it describes validated ONE-TIME transitions in Coatesville's own raw record relative to its neighbors. It does NOT mean TOB explains or justifies NCEI's actual, continued adjustment behavior within any era, including 1946-1982. If anything, classic TOB theory says a single MORNING reading (used throughout 1946-1982) should need a mild WARMING correction, not the sustained cooling NCEI actually applied that whole period (-0.82°F in the 1950s down to -0.21°F in the 1980s). That makes NCEI's continued cooling during 1946-1982 LESS justified under TOB theory, not more -- see "No Basis Found for Any Cooling Adjustment During 1946-1982" below, which is a separate, additional finding from the step-transition analysis above, not an extension of it. Important Caveat: What "Corrected" Does and Does Not Establish The "Corrected" series treats the 1946-1982 era as a zero-adjustment baseline because it is the final, most stable era with no further validated events. This is a standard homogenization convention (adjust the past to match the present), but it is NOT the same as proving 1946-1982 is itself free of bias. Under classic TOB theory, a single MORNING reading (used throughout 1946-1982) should carry a mild COLD bias, not be bias-free -- meaning the true fully-corrected record might need the entire chain shifted warmer, including the baseline era, which would make the required cooling for the earlier eras SMALLER than calculated here, not larger. This analysis establishes the RELATIVE size of each validated step; it does not establish an absolute, bias-free zero point. No Basis Found for Any Cooling Adjustment During 1946-1982 Separately from the baseline-anchoring question above, a cleaner and more direct claim: within the 1946-1982 period itself, location and observation schedule were BOTH stable throughout (no validated events of either kind). An additional check for undetected drift WITHIN this period (not just at its boundaries), using every available overlapping reference station, found no consistent evidence either: Devault 1W and Morgantown each show a significant COOLING drift relative to Coatesville (-1.15 and -0.26 F/decade), while West Chester 2 NW shows a significant WARMING drift in the OPPOSITE direction (+0.52 F/decade), and Phoenixville 1E shows no significant drift at all. By the same cross-validation standard used throughout this investigation, this disagreement means no validated drift exists either. CONCLUSION: with no validated location change, no validated TOB change, and no validated drift anywhere in this 36-year window, there is no raw-data basis found for ANY of NCEI's cooling adjustment during 1946-1982 -- not the varying decade-by-decade amounts NCEI actually applied (ranging from -0.82°F in the 1950s to -0.21°F in the 1980s), and not a flat adjustment either. This covers what could be directly tested here -- station moves and TOB, two of NCEI's four stated PHA rationale categories. No evidence of an undocumented instrument or land-use change was found either, but the available data could not specifically rule those out. Reference Station Confound Check (added later) The cross-validation method above assumed the reference stations (West Chester 2 NW, Phoenixville 1E, Kennett Square, Sadsburyville, Devault 1W, Morgantown) were themselves stable during the windows used to test Coatesville. Checking each one's own HOMR history directly found this was not fully true. Reference Station Own HOMR History Confound Found? West Chester 2 NW Moved slightly in early 1921; further moves in 1936, 1955, 1970, 1998, 2009, 2016 YES -- 1921 move overlaps the 1922 test's "before" window (1918-1921); 1955/1970 moves fall inside the 1946-1982 interior-drift window Phoenixville 1E Stable 1915 to 1948-05-01, then moved PARTIAL -- clean for 1922/1930/1946; its 1948 move falls inside the 1946-1982 interior-drift window Kennett Square Moved between 1916-11-30 and 1919-01-01 YES -- overlaps the 1916 test's "after" window (1917-1920) Sadsburyville Single location, entire 1910-1922 operating life None -- clean Devault 1W Single location, entire 1951-1989 operating life None -- clean Morgantown Single location, entire 1951-1987 operating life None -- clean REVISED CONCLUSIONS: (1) The 1916 finding still holds -- Sadsburyville (fully clean) and West Chester (clean for this specific window) both independently confirm it; only 1 of its 4 supporting references (Kennett Square) has a confound. (2) The 1946 finding is unaffected -- both its supporting references were stable throughout that specific window. (3) The 1922 finding is WEAKER than originally presented: it only ever had 2 supporting references, and the West Chester one is now known to be confounded by West Chester's own 1921 move. Phoenixville alone remains clean and still shows the same direction, but that is one clean reference, not the two-station cross-validation required elsewhere in this analysis -- treat 1922 as a lower-confidence, single-reference finding, not a fully cross-validated one. (4) MOST IMPORTANTLY, this partially reverses the "No Basis Found for Any Cooling Adjustment During 1946-1982" conclusion above: the earlier interior-drift check found 4 references disagreeing and read that as noise, but 2 of those 4 (West Chester, Phoenixville) turned out to have their own undocumented moves inside that exact window, while the 2 clean references (Devault 1W, Morgantown) both agreed on a real cooling drift (-1.15 and -0.26 F/decade). Once the confounded stations are set aside, the clean evidence points to a real, still-unexplained cooling signal during at least the 1952-1982 portion of this period -- not caused by a location move or TOB change (neither was validated), but a genuine physical signal nonetheless, not simply noise as previously stated.
@chubbs below is some more detailed research and some solid evidence below to find if the single station NCEI applied cooling adjustments to Coatesville 1SW are supported by surrounding stations. For site moves and TOB changes. The final finding is that the clean evidence points to a real, still-unexplained cooling signal during at least the 1952-1982 portion of this period -- not caused by a location move or TOB change (neither was validated), Also Station relocation, across the 88-year period with usable NCEI-adjusted data (1895-1982) spanning the station's six relocations, never shows up as an independent, validated driver of any adjustment on its own. Take a look at the below and let me know what this analysis is missing? This is only for Coatesville 1SW raw vs the NCEI adjusted for that individual station. Based on this I will look to see if the other NCEI station adjustments to the raw data are valid and supported by the data. I have much more supporting data so feel free to ask and I will provide more data. Coatesville 1SW: Overall Testing Approach and Findings Overall Testing Approach 1. Pulled Coatesville 1SW's exact location and observation-time history from NCEI's HOMR database -- six site relocations and five distinct observation-schedule eras spanning 1888-1982, independently verified against the live HOMR page and a user-provided satellite image of the final site. 2. Initially tested using NCEI's own adjustment as the yardstick (comparing how the adjustment changed before/after each documented event). This is where standard time-of-observation-bias (TOB) theory first looked promising, then broke down: an all-morning schedule (1946-1982) should need little or no adjustment under TOB theory, not the sustained cooling actually applied. 3. Switched to raw-data-only testing -- the methodologically correct approach, since testing against NCEI's own output can't establish whether that output was justified in the first place. For each of Coatesville's 7 documented events, compared Coatesville's raw record against every available nearby raw-data station in clean, non-overlapping before/after windows. 4. Required cross-validation across independent references -- an event only counted as a real, validated discontinuity if multiple neighbor stations agreed on the direction of the shift, not just one. This is the key filter separating genuine breaks from ordinary weather noise. Expanded from 2 to up to 4 reference stations (West Chester 2 NW, Phoenixville 1E, Kennett Square, Sadsburyville) depending on era. 5. Result: only 3 of 7 documented events passed. 1916, 1922, and 1946 showed real, multi-station-confirmed shifts. 1902, 1910, 1930, and 1948 did not -- either unconfirmable (no second reference available) or references actively disagreeing (the signature of noise, not a real break). 6. Built a raw-justified adjustment chain using only those 3 validated steps, anchored to the stable, unchanged 1946-1982 era as a zero baseline, and compared it decade-by-decade against NCEI's actual adjustment, with formal significance testing at each step. Overall Finding NCEI's adjustment ran colder than the raw evidence supports in every single decade from the 1890s through the 1980s, with no exceptions. Restricting to the 8 complete decades (1900s-1970s), 6 of 8 reach conventional statistical significance (1900s, 1910s, 1930s, 1940s, 1950s, 1960s); the other two (1920s, 1970s) don't reach significance individually but still point the same direction. Pooled across all 88 years, the effect is overwhelming (p < 0.0001). The size of the over-cooling does not trend over time -- it is a persistent, roughly steady bias, not something that worsened or improved across the record. See "Raw vs NCEI vs Corrected Trend" for the full year-by-year data, decade table, and significance tests. Adjustment Broken Out by Rationale (all 7 documented events) Of NCEI's stated PHA rationale categories, only station relocation and observation-time change could be directly tested here. Only 3 of the 7 documented events show real, cross-validated evidence. Event Rationale Category Validated? Contribution to the Adjustment Chain 1902 Location move No -- single reference, unconfirmable 0 (no independent step; folded into the 1902-1915 era) 1910 TOB change No -- 2 references disagree in direction 0 (no independent step; folded into the 1902-1915 era) 1916 Location move + TOB shift (simultaneous) Yes -- 4 references agree +0.36°F, partially OFFSETTING (applies to 1902-1915 only; can't attribute to either cause alone) 1922 TOB change (location unchanged) Yes -- 3 references agree -1.28°F, the entire step applied to 1922-1945 1930 Location move No -- 2 references disagree in direction 0 (no step between 1922-1945 and 1946-1982) 1946 TOB change (location unchanged) Yes -- 2 references agree (thin sample) Combined with 1922: the entire -2.11°F applied to 1916-1921 1948 Location move No -- 2 references disagree in direction 0 (1946-1982 treated as one continuous baseline era) PRACTICAL ANSWER: of all 7 documented events, only 3 (1916, 1922, 1946) show real, cross-validated raw discontinuities -- 2 of those 3 (1922, 1946) are TOB changes with no location change; the third (1916) is an inseparable combined event. The 4 location-related events (1902, 1910, 1930, 1948) show no validated evidence at all. Station relocation, across the 88-year period with usable NCEI-adjusted data (1895-1982) spanning the station's six relocations, never shows up as an independent, validated driver of any adjustment on its own. Important: What "TOB" Explains Here, and What It Does Not The "TOB" label in the table above explains why the RECONSTRUCTED adjustment chain steps DOWN between eras (e.g. why 1922-1945 sits 1.28°F below the 1946-1982 baseline) -- it describes validated ONE-TIME transitions in Coatesville's own raw record relative to its neighbors. It does NOT mean TOB explains or justifies NCEI's actual, continued adjustment behavior within any era, including 1946-1982. If anything, classic TOB theory says a single MORNING reading (used throughout 1946-1982) should need a mild WARMING correction, not the sustained cooling NCEI actually applied that whole period (-0.82°F in the 1950s down to -0.21°F in the 1980s). That makes NCEI's continued cooling during 1946-1982 LESS justified under TOB theory, not more -- see "No Basis Found for Any Cooling Adjustment During 1946-1982" below, which is a separate, additional finding from the step-transition analysis above, not an extension of it. Important Caveat: What "Corrected" Does and Does Not Establish The "Corrected" series treats the 1946-1982 era as a zero-adjustment baseline because it is the final, most stable era with no further validated events. This is a standard homogenization convention (adjust the past to match the present), but it is NOT the same as proving 1946-1982 is itself free of bias. Under classic TOB theory, a single MORNING reading (used throughout 1946-1982) should carry a mild COLD bias, not be bias-free -- meaning the true fully-corrected record might need the entire chain shifted warmer, including the baseline era, which would make the required cooling for the earlier eras SMALLER than calculated here, not larger. This analysis establishes the RELATIVE size of each validated step; it does not establish an absolute, bias-free zero point. No Basis Found for Any Cooling Adjustment During 1946-1982 Separately from the baseline-anchoring question above, a cleaner and more direct claim: within the 1946-1982 period itself, location and observation schedule were BOTH stable throughout (no validated events of either kind). An additional check for undetected drift WITHIN this period (not just at its boundaries), using every available overlapping reference station, found no consistent evidence either: Devault 1W and Morgantown each show a significant COOLING drift relative to Coatesville (-1.15 and -0.26 F/decade), while West Chester 2 NW shows a significant WARMING drift in the OPPOSITE direction (+0.52 F/decade), and Phoenixville 1E shows no significant drift at all. By the same cross-validation standard used throughout this investigation, this disagreement means no validated drift exists either. CONCLUSION: with no validated location change, no validated TOB change, and no validated drift anywhere in this 36-year window, there is no raw-data basis found for ANY of NCEI's cooling adjustment during 1946-1982 -- not the varying decade-by-decade amounts NCEI actually applied (ranging from -0.82°F in the 1950s to -0.21°F in the 1980s), and not a flat adjustment either. This covers what could be directly tested here -- station moves and TOB, two of NCEI's four stated PHA rationale categories. No evidence of an undocumented instrument or land-use change was found either, but the available data could not specifically rule those out. Reference Station Confound Check (added later) The cross-validation method above assumed the reference stations (West Chester 2 NW, Phoenixville 1E, Kennett Square, Sadsburyville, Devault 1W, Morgantown) were themselves stable during the windows used to test Coatesville. Checking each one's own HOMR history directly found this was not fully true. Reference Station Own HOMR History Confound Found? West Chester 2 NW Moved slightly in early 1921; further moves in 1936, 1955, 1970, 1998, 2009, 2016 YES -- 1921 move overlaps the 1922 test's "before" window (1918-1921); 1955/1970 moves fall inside the 1946-1982 interior-drift window Phoenixville 1E Stable 1915 to 1948-05-01, then moved PARTIAL -- clean for 1922/1930/1946; its 1948 move falls inside the 1946-1982 interior-drift window Kennett Square Moved between 1916-11-30 and 1919-01-01 YES -- overlaps the 1916 test's "after" window (1917-1920) Sadsburyville Single location, entire 1910-1922 operating life None -- clean Devault 1W Single location, entire 1951-1989 operating life None -- clean Morgantown Single location, entire 1951-1987 operating life None -- clean REVISED CONCLUSIONS: (1) The 1916 finding still holds -- Sadsburyville (fully clean) and West Chester (clean for this specific window) both independently confirm it; only 1 of its 4 supporting references (Kennett Square) has a confound. (2) The 1946 finding is unaffected -- both its supporting references were stable throughout that specific window. (3) The 1922 finding is WEAKER than originally presented: it only ever had 2 supporting references, and the West Chester one is now known to be confounded by West Chester's own 1921 move. Phoenixville alone remains clean and still shows the same direction, but that is one clean reference, not the two-station cross-validation required elsewhere in this analysis -- treat 1922 as a lower-confidence, single-reference finding, not a fully cross-validated one. (4) MOST IMPORTANTLY, this partially reverses the "No Basis Found for Any Cooling Adjustment During 1946-1982" conclusion above: the earlier interior-drift check found 4 references disagreeing and read that as noise, but 2 of those 4 (West Chester, Phoenixville) turned out to have their own undocumented moves inside that exact window, while the 2 clean references (Devault 1W, Morgantown) both agreed on a real cooling drift (-1.15 and -0.26 F/decade). Once the confounded stations are set aside, the clean evidence points to a real, still-unexplained cooling signal during at least the 1952-1982 portion of this period -- not caused by a location move or TOB change (neither was validated), but a genuine physical signal nonetheless, not simply noise as previously stated. -
Message from NAM and RGEM at this point is watch out for locally excessive totals. The location will remain the question until nowcast time. If mesos start picking up on those kind of totals tomorrow the confidence goes up. At this point I would not be shocked to see local totals of 5” someplace in this sub forum. Hopefully not out this way.
-
 Leaves already looking leathery despite only being out for six weeks.
 -

2026-2027 Super El Nino
Maestrobjwa replied to Stormchaserchuck1's topic in Weather Forecasting and Discussion
It literally has been--and it happens to be every other one too: 65-66 yes, 72-73 no, 82-83 yes, 97-98 no, 15-16 yes...so are we about to be no again according to that pattern? Lol -

2026-2027 Super El Nino
GaWx replied to Stormchaserchuck1's topic in Weather Forecasting and Discussion
“Snowy” in ATL can be ~3”+ as the average SN/IP is ~2”. Thus snowy in ATL can easily be from just one storm. More often than not, “snowy” in any particular location in the SE US away from the mountains is mainly from just one major storm along with possibly one+ minor hits. Another thing about a place like ATL or even RDU vs Marquette: a much larger % of the wintry precip is sleet or ZR when averaged out over the decades. I roughly estimate 1” of sleet is equivalent to 2.5” of snow on average. So, for example, ATL got ~4” of sleet in 2/1979 and 1/1988. They had the water equivalent, impact, and staying power of ~10” of snow. In addition, ZR doesn’t even measure as S/IP as we know. So, the 2” ATL avg tends to understate to an extent its avg wintry precip vs, say, a straight 2” avg snow. -
There's a chance for another head fake then?
-
Nice change for them following the warmest July 1st through 4th. Time Series Summary for WESTCHESTER CO AP, NY Warmest July 1st through 4th Click column heading to sort ascending, click again to sort descending. 1 2026-07-04 84.5 0 2 1966-07-04 82.1 0 3 2002-07-04 81.6 0 4 2018-07-04 81.3 0 - 1964-07-04 81.3 0 5 1955-07-04 80.4 0
- Today
-
Svr wx possible around the Northland tonight. But there is a cap in play, so we'll see what can break that.
-

2026-2027 Super El Nino
LakePaste25 replied to Stormchaserchuck1's topic in Weather Forecasting and Discussion
I’d put the mid atlantic under “equal chances” IMO. Super Ninos are usually hit or miss there, dependent on 1 storm. It’s close to 50% likelihood given the sample size. -
My grass is growing like it would in Vietnam at this point
-
 buying prescription drugs in mexico: MedSelect Mexico - overseas online pharmacy
 -
July 26 1981: A chilly morning occurs across the Northland, with 33 degrees at Roseau and Wannaska. For Sunday, July 26, 2026 1819 - Twin cloudbursts of fifteen inches struck almost simultaneously at Catskill, NY, and Westfield, MA. Flash flooding resulted in enormous erosion. (David Ludlum) 1943 - Tishomingo, OK, baked in the heat as the mercury soared to 121 degrees, a state record. (The Weather Channel) 1960 - The temperature at Salt Lake City, UT, hit 107 degrees, an all-time record high for that location. (The Weather Channel) 1987 - Thunderstorms developing along a cold front produced hail two inches in diameter in McHenry County, IL, and wind gusts to 70 mph at Auburn, ME. A wind gust of 90 mph was recorded at Blairstown, NJ, before the anemometer broke. The high winds were associated with a small tornado. The record high of 88 degrees at Beckley, WV, was their sixth in a row. (The National Weather Summary) (Storm Data) 1988 - Thunderstorms produced large hail and damaging winds in the Middle Atlantic Coast Region, and in the south central U.S. Eight cities in the northwestern and north central U.S. reported record high temperatures for the date. Salem, OR, hit 103 degrees. (The National Weather Summary) 1989 - Morning thunderstorms produced heavy rain in southeastern Texas, with more than three inches reported at the Widllife Refuge in southwestern Chambers County. Evening thunderstorms produced severe weather in Montana, with wind gusts to 62 mph reported at Helena. Eight cities from Maine to Minnesota reported record high temperatures for the date, including Newark, NJ, with a reading of 99 degrees. (The National Weather Summary) (Storm Data) Observances: 26 Sun Uncle and Aunt Day 26 Sun Parents' Day 26 Sun National Disability Independence Day 26 Sun Auntie's Day 26 Sun Holistic Therapy Day 26 Sun National All or Nothing Day 26 Sun National Bagelfest Day 26 Sun National Coffee Milkshake Day 26 Sun National Saint Day 26 Sun One Voice Day 26 Sun World Mangrove Day 26 Sun World Tofu Day 26 Sun National Aunt and Uncle Day
-
RGEM too-although more localized.
-
Cloudy morning. Suppose to be sunny today with stms tonight. Heat adv out. DLH is under Heat warning. Yesterday was 80 with a 70 dew. Muggy, but comfortable. We'll see if it warms more today. Point has 82.
-
 ...while methuen ends up .25.....
 -
1.04'' this morning. Up to 12.34'' for the month.
-

2026-2027 Super El Nino
michsnowfreak replied to Stormchaserchuck1's topic in Weather Forecasting and Discussion
Just a suggestion if you guys make future snow maps closer to winter. It usually helps if you give a rough % of average to go in line with your thinking. I knew what raindance was getting at with the snow map (admittedly just a preliminary joke map rough idea) but it always looks funny when you see something like "snowy" in Atlanta and "not snowy" in Marquette. -
 do you want to fuck her like every other climate change denier
 -
2026 Mid-Atlantic Severe Storm General Discussion
high risk replied to Kmlwx's topic in Mid Atlantic
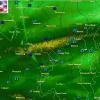
I'd usually agree with you. But as we now move into CAM range, recognizing that the U.S. CAMs all have some influence of the GFS, the solutions seem to be favoring the GFS more. The idea of a deep sfc low over the St Lawrence Valley isn't dead in the Euro, but even its AI version likes a secondary low in the Mid-Atlantic. Verbatim, some pretty strong forcing rolls through during the morning and midday hours, which screams flash flooding more than severe. That said, 1) a surface low will be nearby, so you always need to watch for a tornado threat, especially if we can heat up before the forcing arrives 2) there is time to change some of the synoptic details- 1,477 replies
-
- 2
-

-
- severe
- thunderstorms
- (and 7 more)
-
2026-2027 Super El Nino
40/70 Benchmark replied to Stormchaserchuck1's topic in Weather Forecasting and Discussion
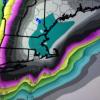
If I had a snowfall map right now, it would look like raindance's. -
2026-2027 Super El Nino
40/70 Benchmark replied to Stormchaserchuck1's topic in Weather Forecasting and Discussion
I could not agree with raindance more....my QBO composite is a bit different, but he just echoed that premise of my write up last night with absolute surgical precision in just a far more condensed manner. Here an excerpt from my work: Key Factors to Potentially Fuel More Active Second Half than Currently Forecast The preliminary Eastern Mass Weather polar composite is littered with seasons that underwent a notable transition from a benign December-January period to a rather frenzied February and/or March, as El Niño peaks and undergoes a subtle change in orientation. It was mentioned that this is a signal that is emergent among some seasonal guidance. It was postulated that these forecasts are overstated and exaggerated, and are likely to be transient in nature. However, it was also asserted that the forecast unprecedented intensity of El Niño should be of sufficient magnitude to at long last shift the western Pacific warm pool, which has been a fixture for a over a decade, further to the east. The question is whether it simply shifts to the dateline and acts as a Modoki, or even further east, which would heighten the odds of a very mild outcome, per the intense/east-based El Niño composites. Another option is for it to not move enough, which may produce an outcome similar to the MC-oriented 2023-2024 season, which is viewed was the least likely outcome. At the very least, the European seasonal guidance is supporting the current forecast for a mid season transition to greater volatility, but it looks to be even more exaggerated given it's assessment of the January polar domain. Perhaps the eruption of Mount Agung was not justification for the outright dismissal of the 1963-1964 QBO analog from the polar composite, however, there is plenty of time to assess that decision as subsequent trends are modeled and future data is digested. -
Enhanced for wi