
LakePaste25
-
Posts
1,376 -
Joined
-
Last visited




-

2026-2027 Record-breaking El Nino
LakePaste25 replied to Stormchaserchuck1's topic in Weather Forecasting and Discussion
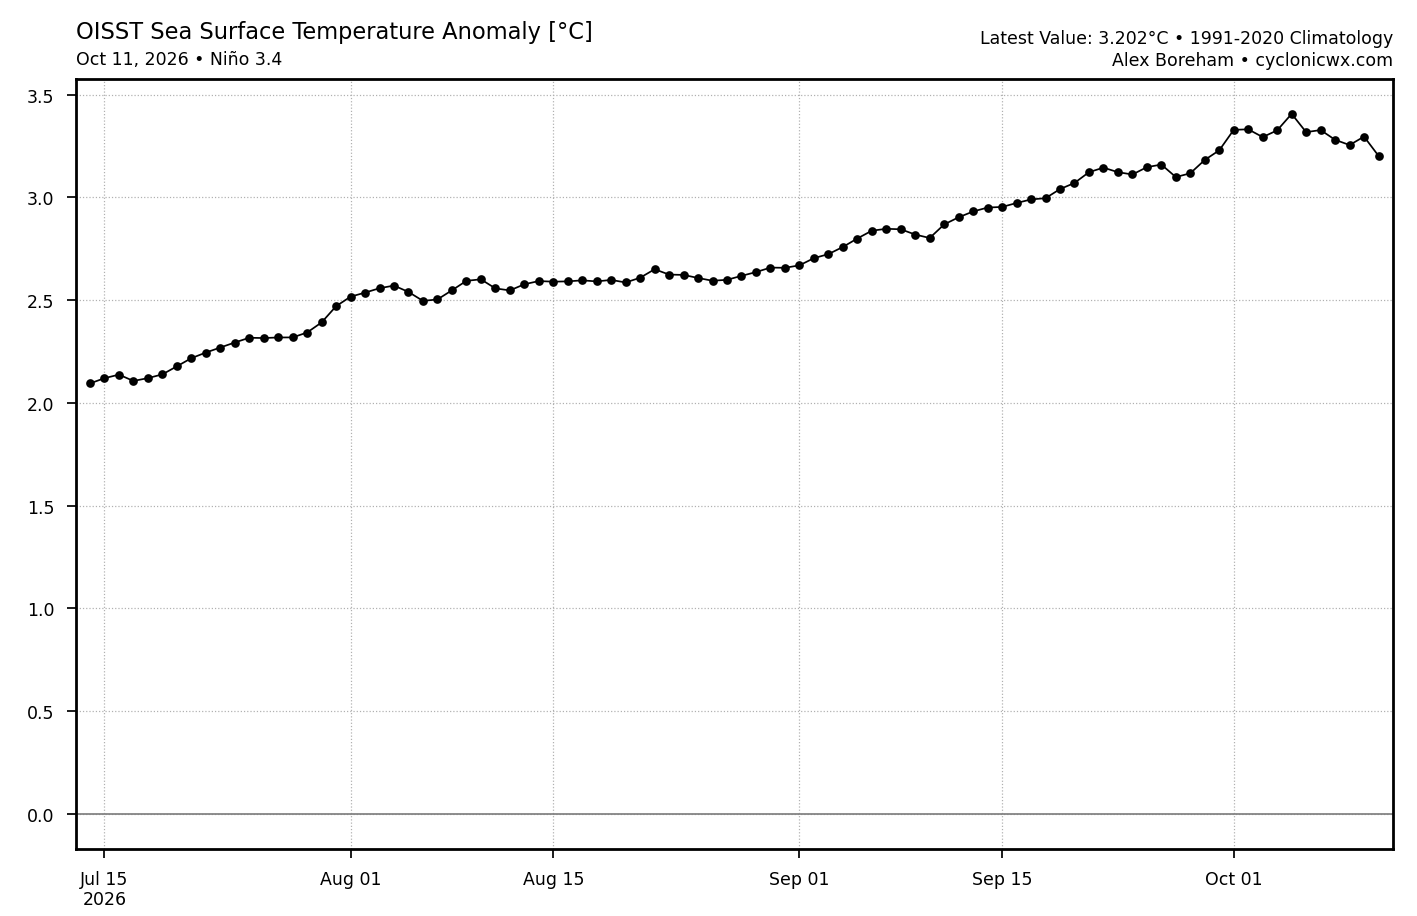
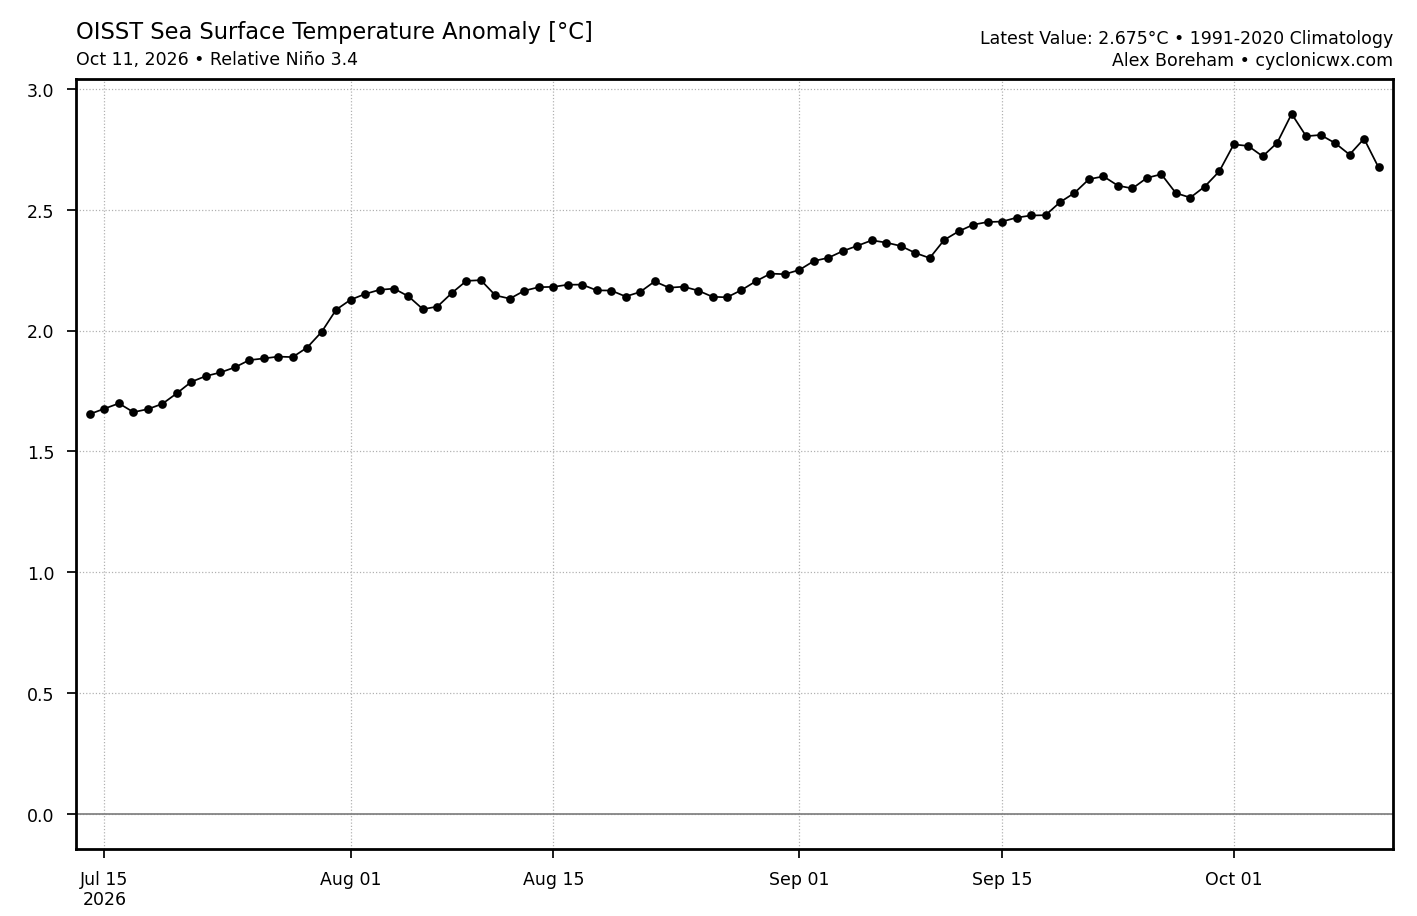
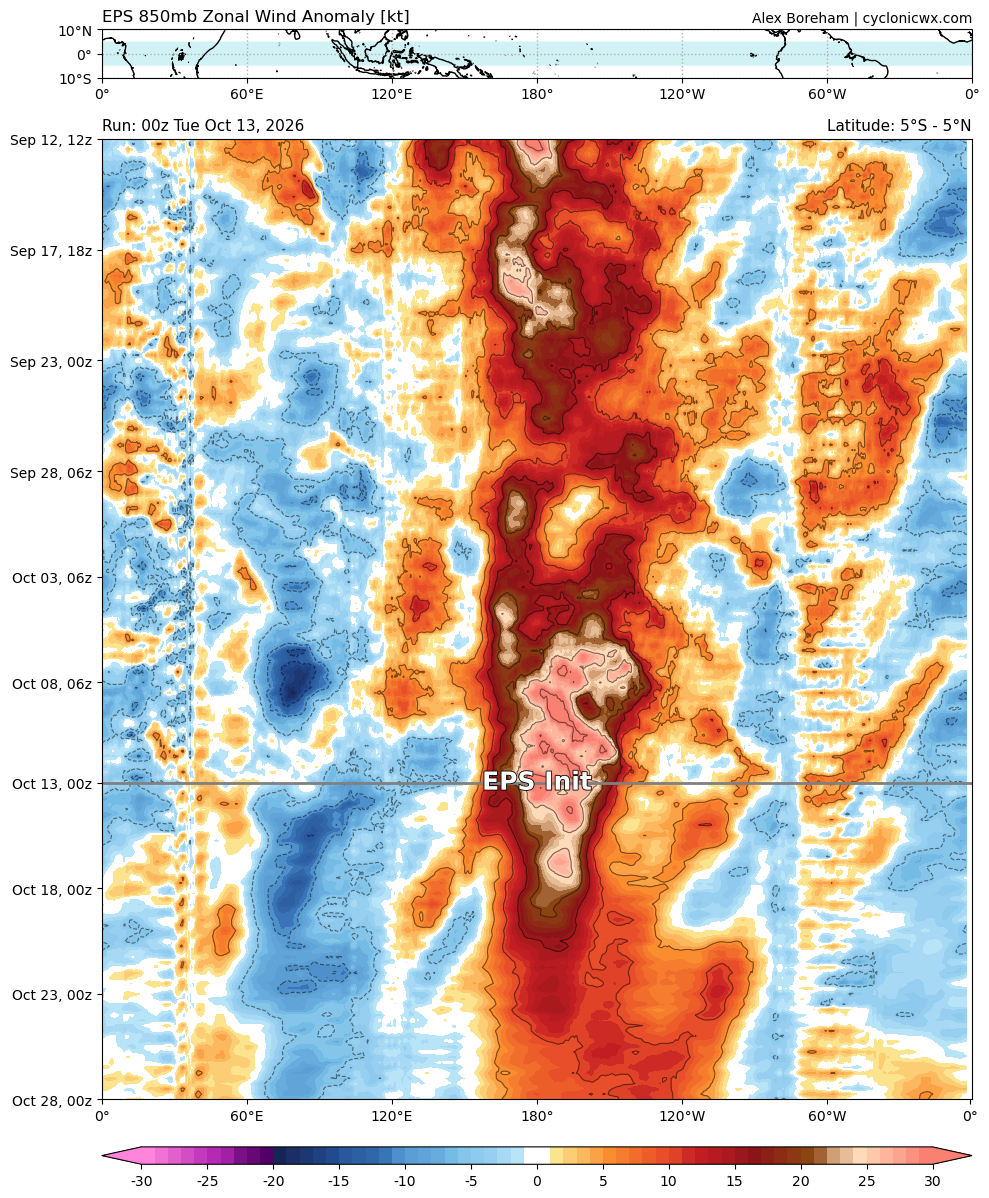
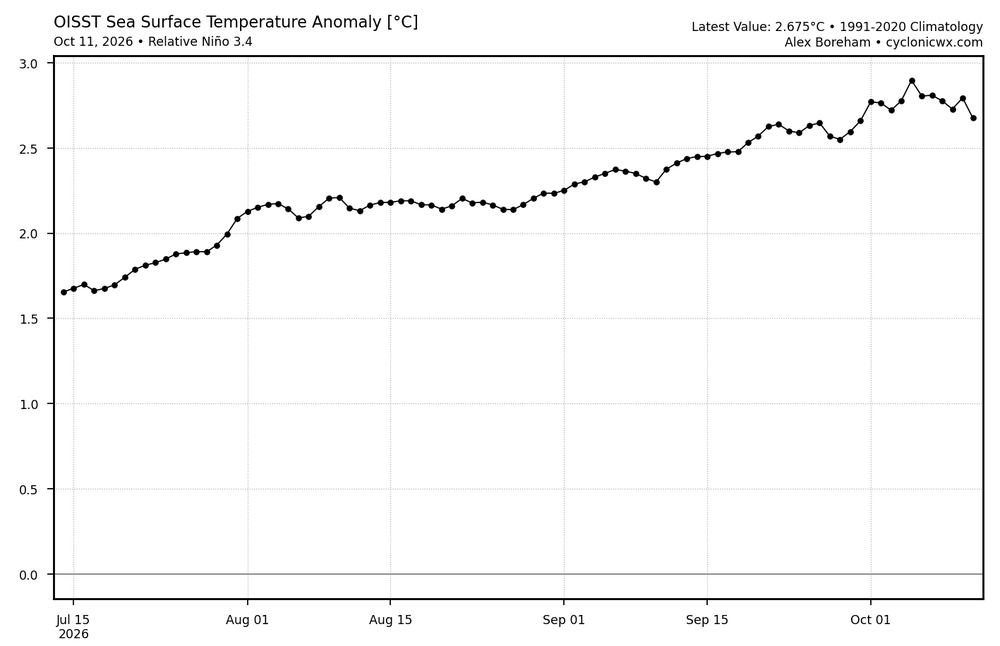
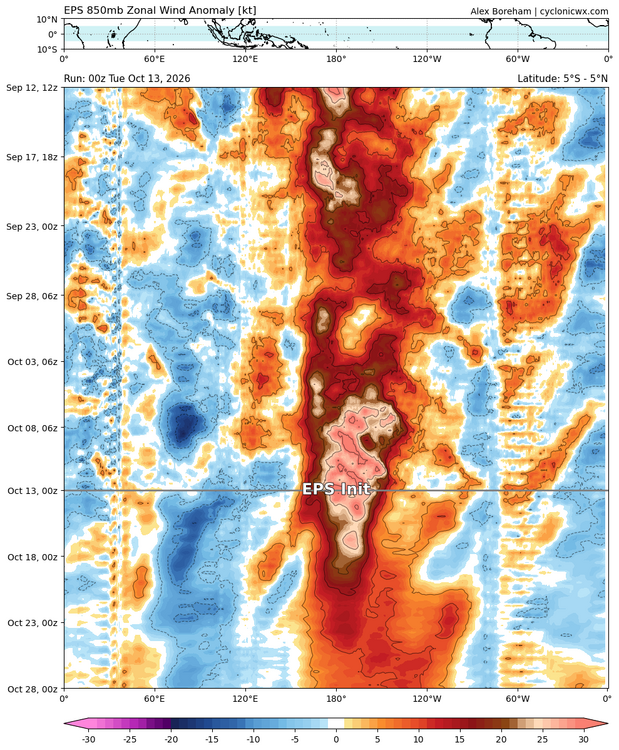
Typical short-term temporary drop of 3.4/r3.4 due to the evaporative cooling induced by strong WWBs. Once that settles in a week or two, they should start shooting to the moon again.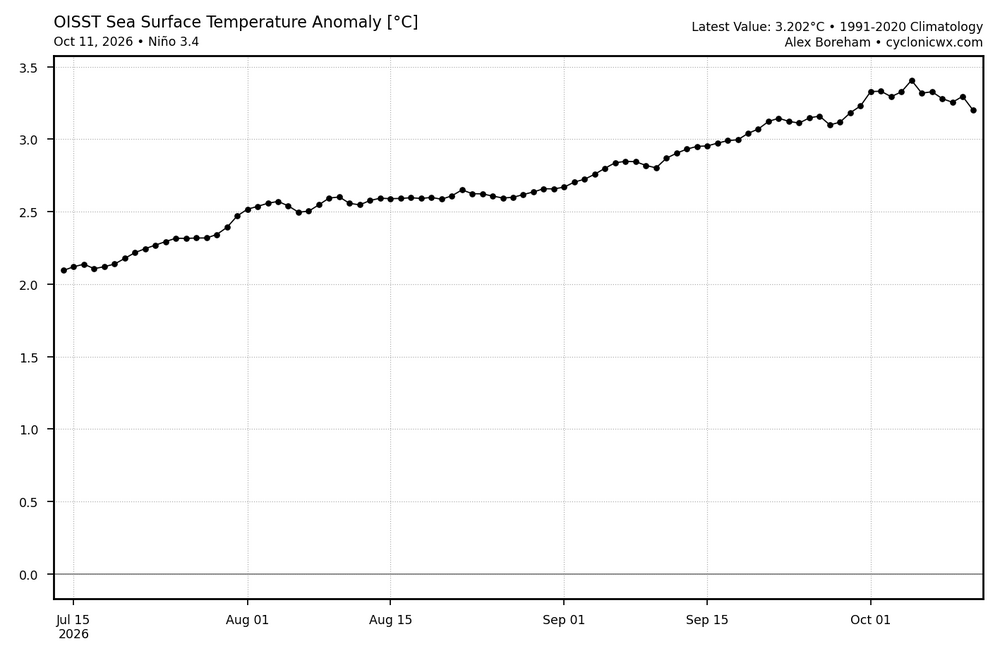
-
2026-2027 Record-breaking El Nino
LakePaste25 replied to Stormchaserchuck1's topic in Weather Forecasting and Discussion
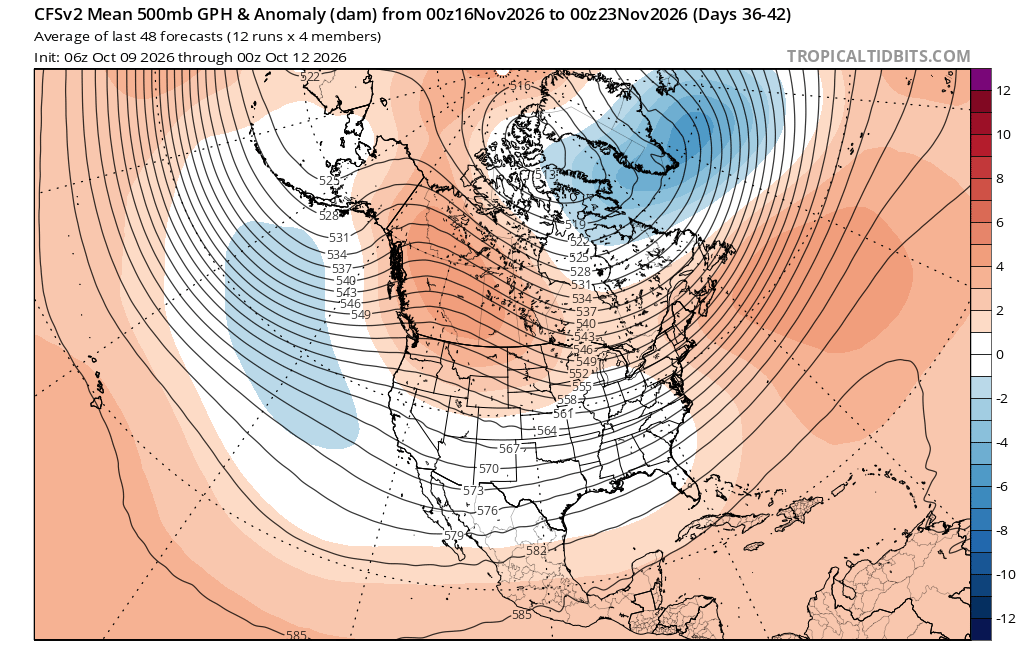
The fact that models are trying to usher in the pattern in November when we typically don’t see it until later in December the earliest is actually attributed to it being the strongest Nino on record. -
2026-2027 Record-breaking El Nino
LakePaste25 replied to Stormchaserchuck1's topic in Weather Forecasting and Discussion
-
2026-2027 Record-breaking El Nino
LakePaste25 replied to Stormchaserchuck1's topic in Weather Forecasting and Discussion
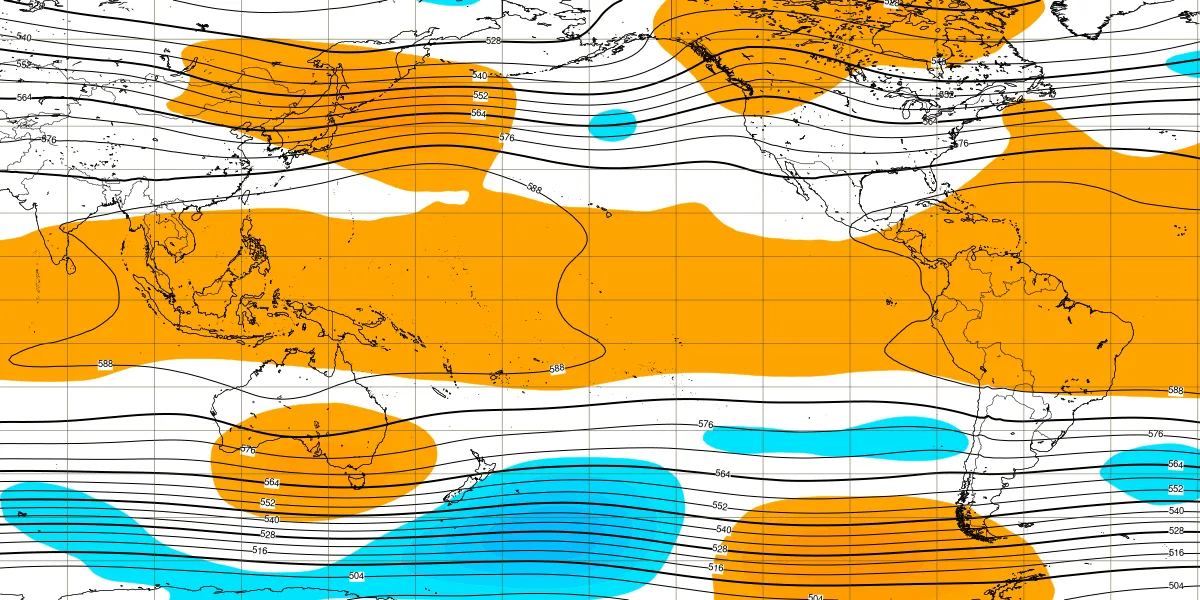
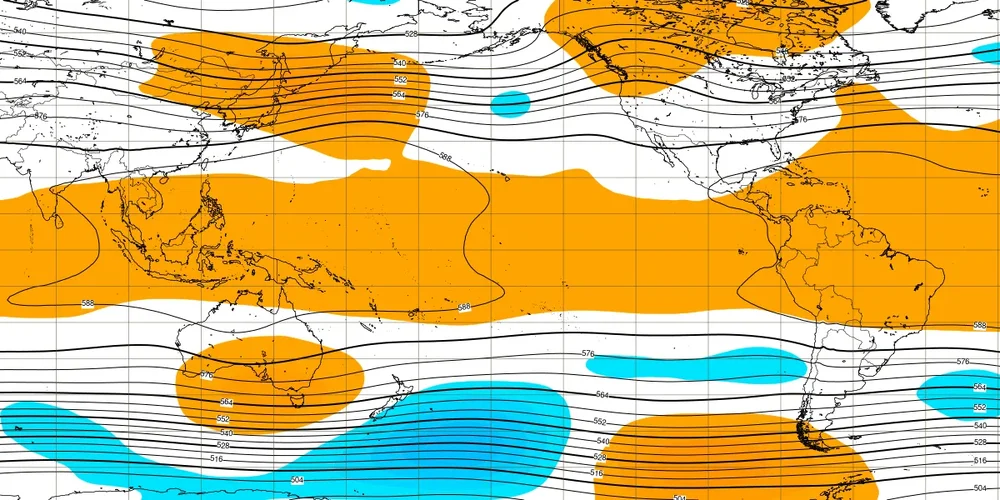
Way out there but the sub seasonals begin to show more of a cool season Nino H5 pattern in November.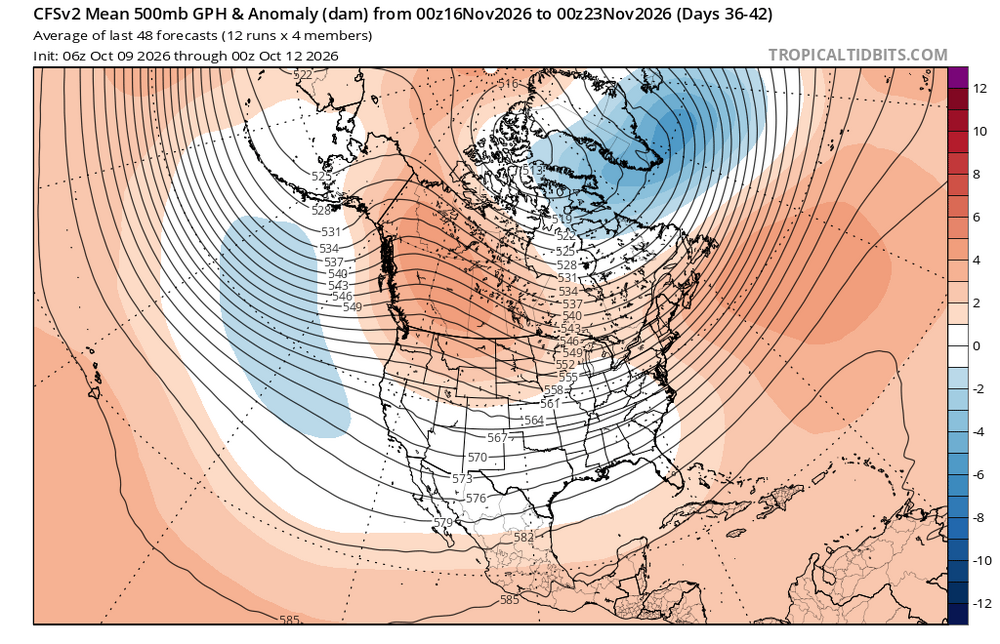
-
2026-2027 Record-breaking El Nino
LakePaste25 replied to Stormchaserchuck1's topic in Weather Forecasting and Discussion
There could be brief deviations westward, just not expecting a nearly month long deviation like we saw in 2023-2024. The fact that we shut down forcing west of the dateline already and we have a hyperactive EPac hurricane season is notable. 97-98 didn’t even do that this early. -
2026-2027 Record-breaking El Nino
LakePaste25 replied to Stormchaserchuck1's topic in Weather Forecasting and Discussion
Yeah I’d exercise caution with the “west based forcing because previous Ninos had forcing more west based than forecast” idea. It’s a valid point, but keep in mind this is east-based beyond historical precedent. -
2026-2027 Record-breaking El Nino
LakePaste25 replied to Stormchaserchuck1's topic in Weather Forecasting and Discussion
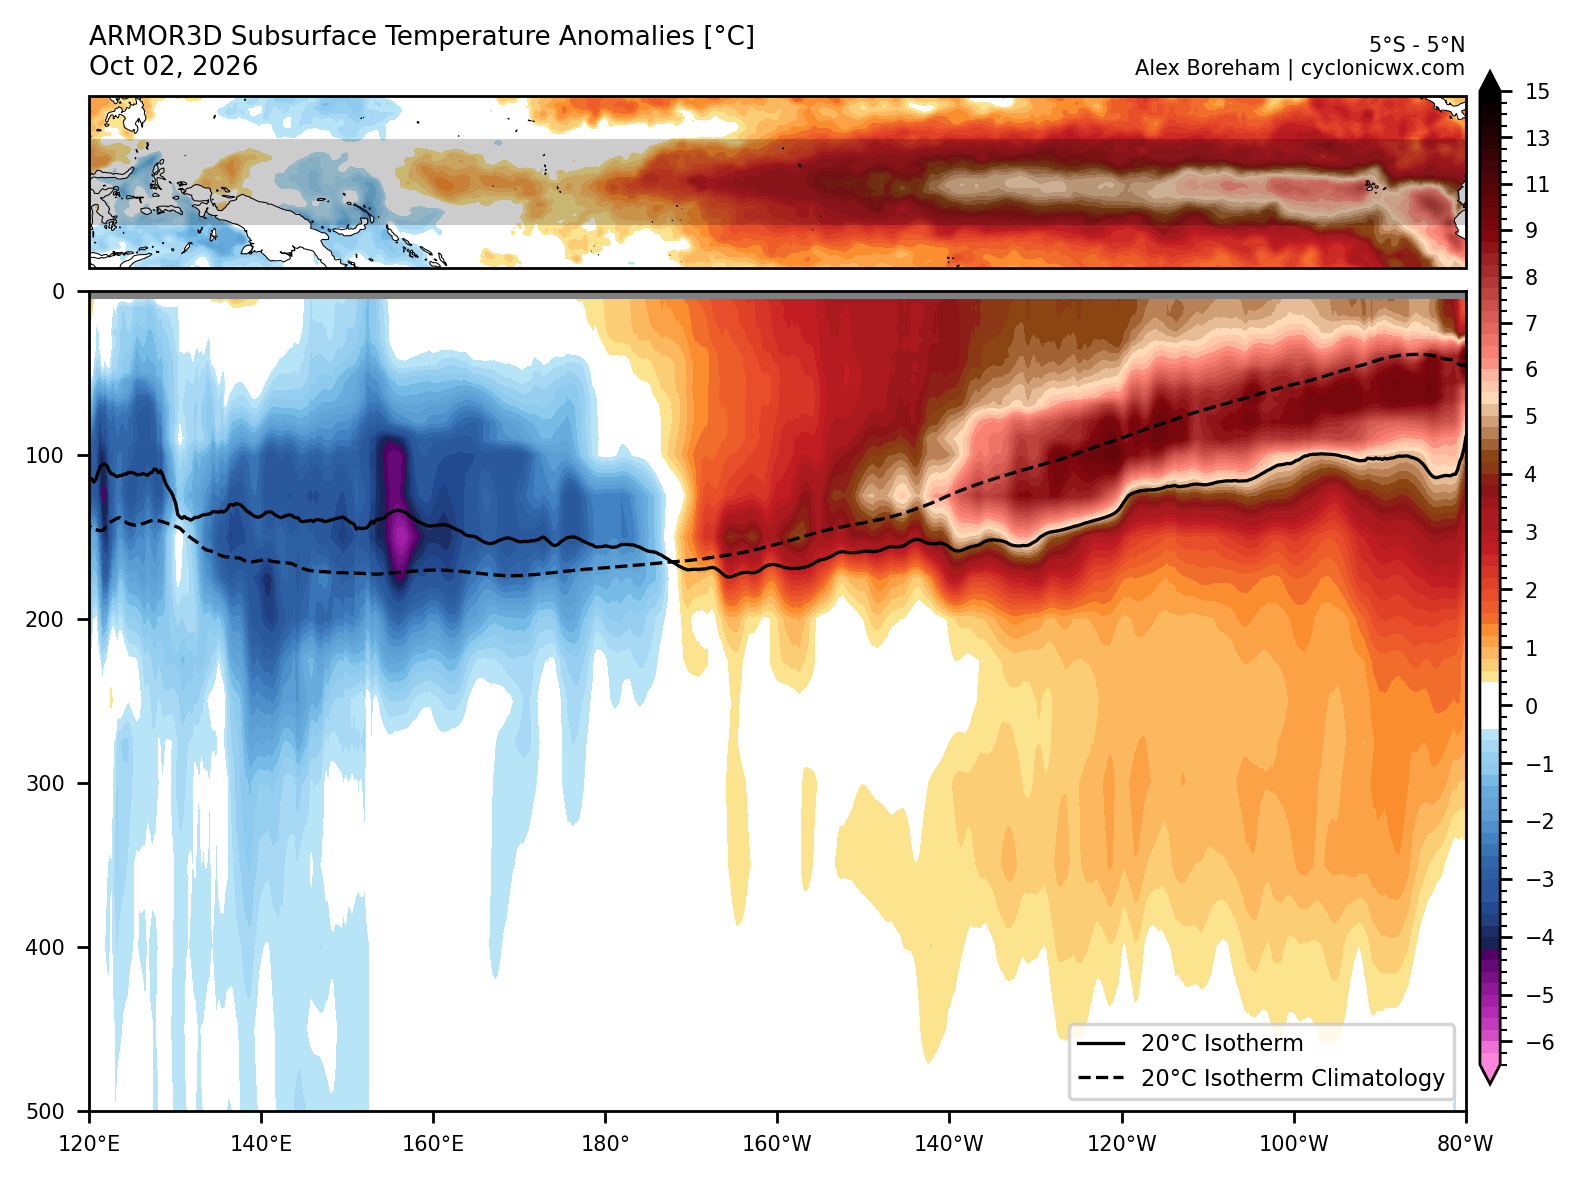
The thermocline could potentially reverse which is something I’ve never seen before. -
2026-2027 Record-breaking El Nino
LakePaste25 replied to Stormchaserchuck1's topic in Weather Forecasting and Discussion
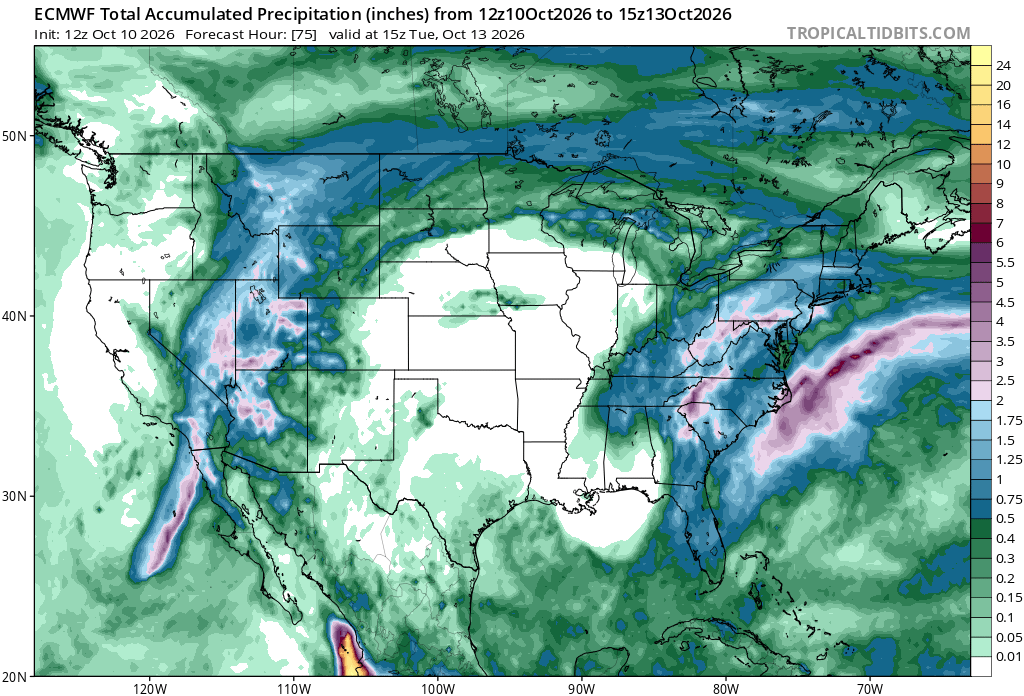
Rainfall in the SW from tropical remnants while another system goes up the East coast. Certainly El Niño like regardless of whether the H5 out in the N pacific matches, and the C3S and Euro seasonal hinted at this precip. pattern for the fall.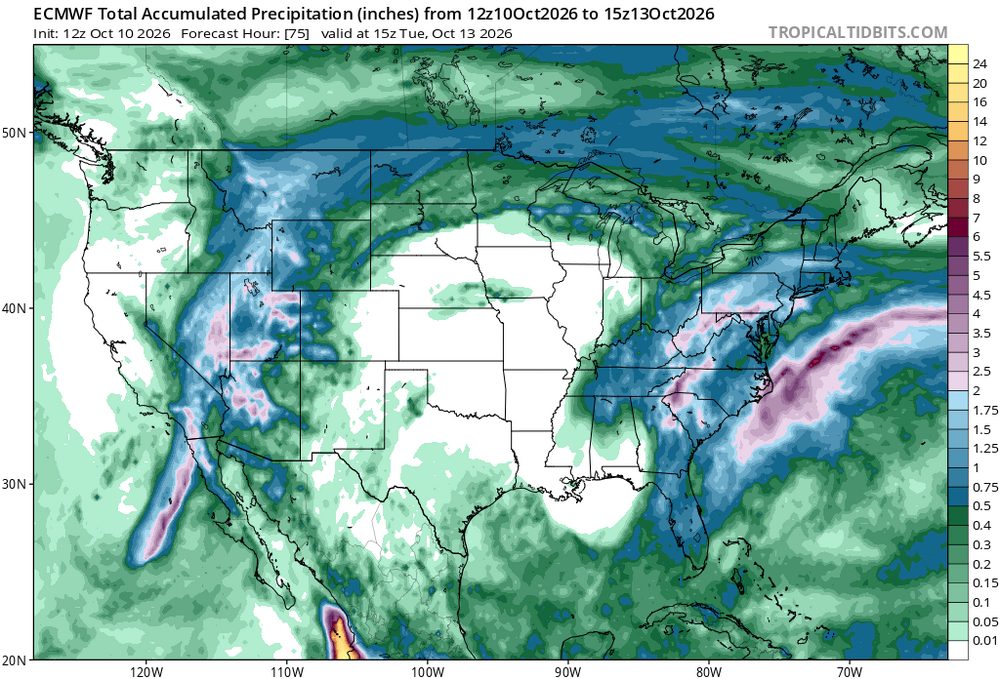
-
2026-2027 Record-breaking El Nino
LakePaste25 replied to Stormchaserchuck1's topic in Weather Forecasting and Discussion
Once we see that subsurface cool pool out in the W pac upwell some more (probably sometime later this winter), we could see RONI catch up to ONI.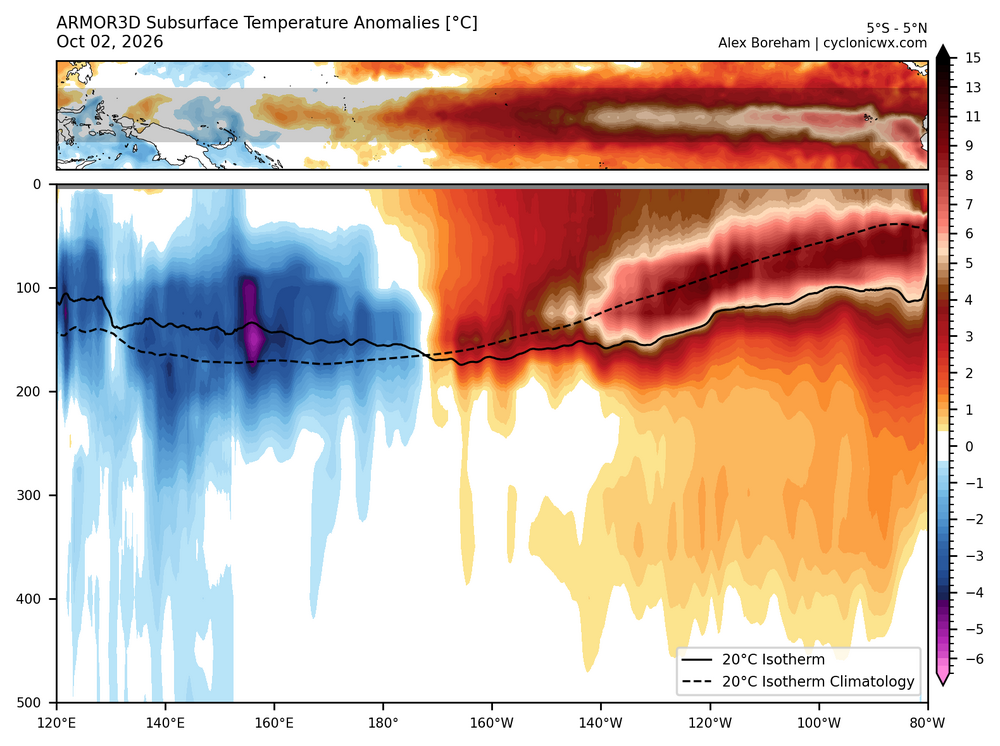
-
2026-2027 Record-breaking El Nino
LakePaste25 replied to Stormchaserchuck1's topic in Weather Forecasting and Discussion
I think it’s worth tracking, but proceed with caution given the known ECMWF weak PV bias. -
2026-2027 Record-breaking El Nino
LakePaste25 replied to Stormchaserchuck1's topic in Weather Forecasting and Discussion
it’s giving you the historical ERA 5 reanalysis average up until 5/1/27. You’ll notice all the lines converge together starting between march and april because a) the PV becomes weaker and less variable by the spring and b) models tend to default to climatology very far out. So the ensemble forecast mean (black) will start to closely match the hindcast climate mean (red) and ERA5 mean (blue) between March and April. Also it’s important to note the red line being lower than the blue line between Dec and March. What that’s telling you is that when the model tried to reconstruct a hindcast of past years, it was forecasting a weaker PV than the actual ERA5 reanalysis. So it’s saying the model has a weak PV bias in its forecasts during the heart of winter. -
2026-2027 Record-breaking El Nino
LakePaste25 replied to Stormchaserchuck1's topic in Weather Forecasting and Discussion
ERA5 is not a prognosis, it’s a reanalysis of the daily mean averaged out over several decades (i think it starts 1940 but someone can correct me here). The black is the actual forecast ensemble mean. So it’s currently forecast to go below the historical mean. -
2026-2027 Record-breaking El Nino
LakePaste25 replied to Stormchaserchuck1's topic in Weather Forecasting and Discussion
I won’t count chickens before they hatch, but *at least so far* the Euro has been the most correct with how E based it is compared to the others. -
2026-2027 Record-breaking El Nino
LakePaste25 replied to Stormchaserchuck1's topic in Weather Forecasting and Discussion
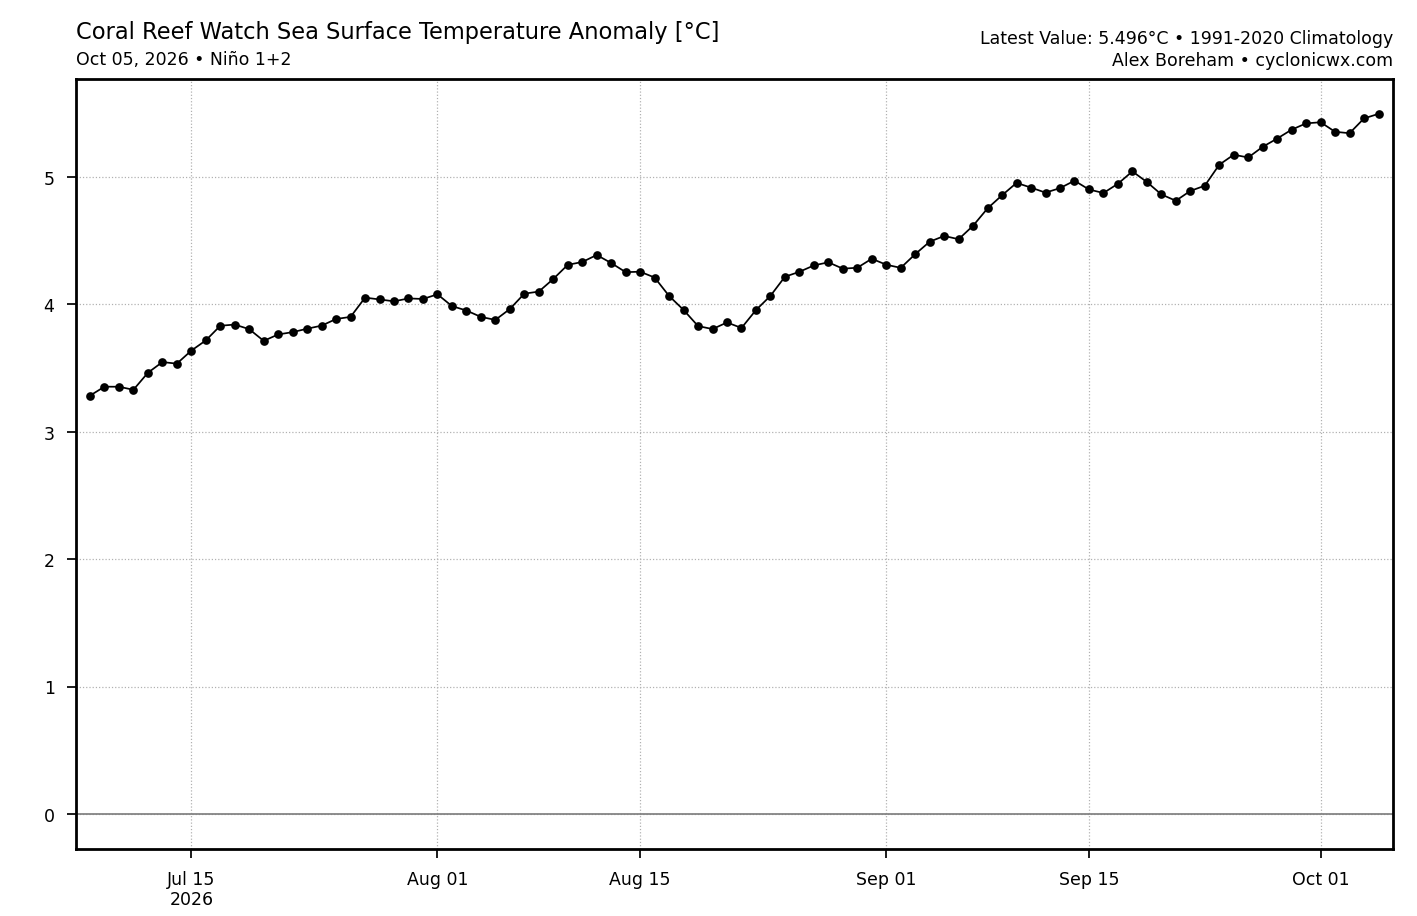
Still waiting on that big Nino 1+2 drop modeled by the CFSv2. Any day now.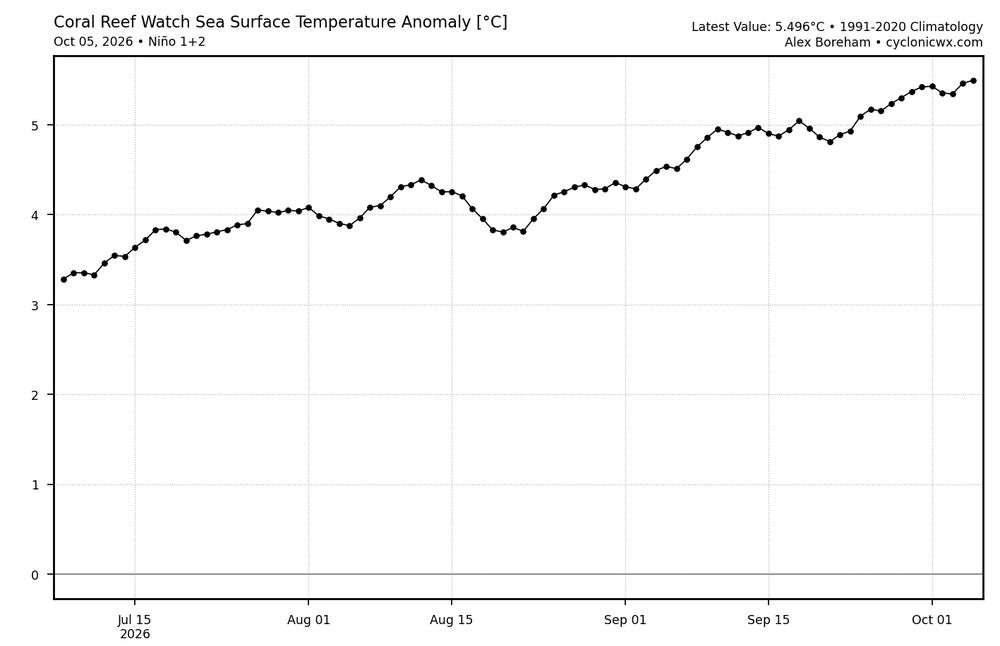
-
2026-2027 Record-breaking El Nino
LakePaste25 replied to Stormchaserchuck1's topic in Weather Forecasting and Discussion
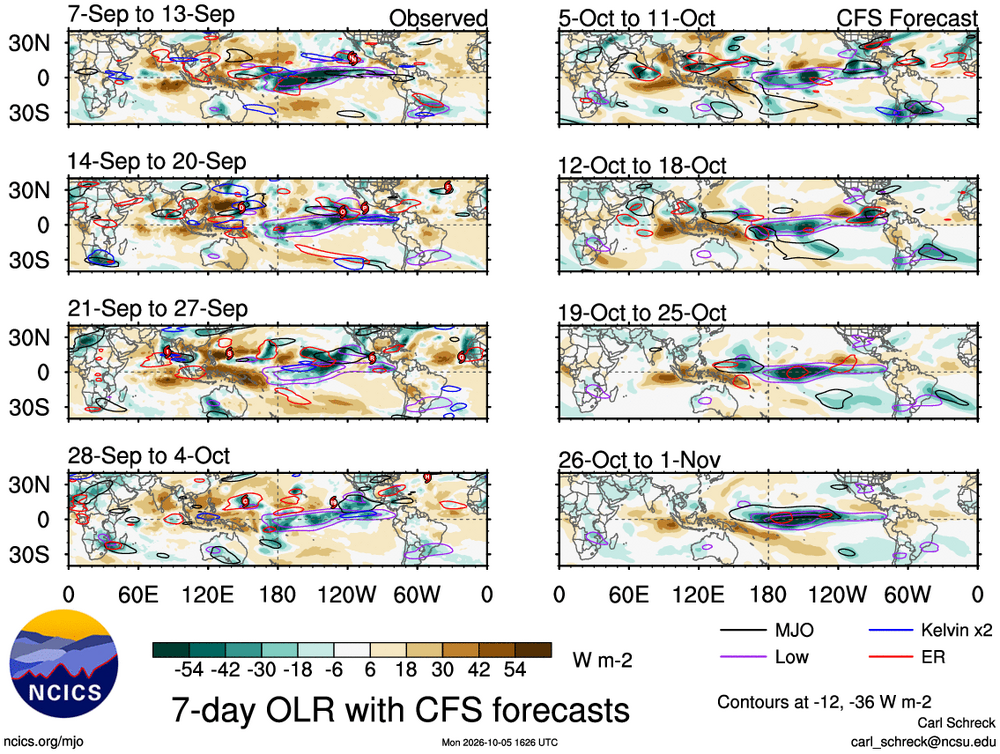
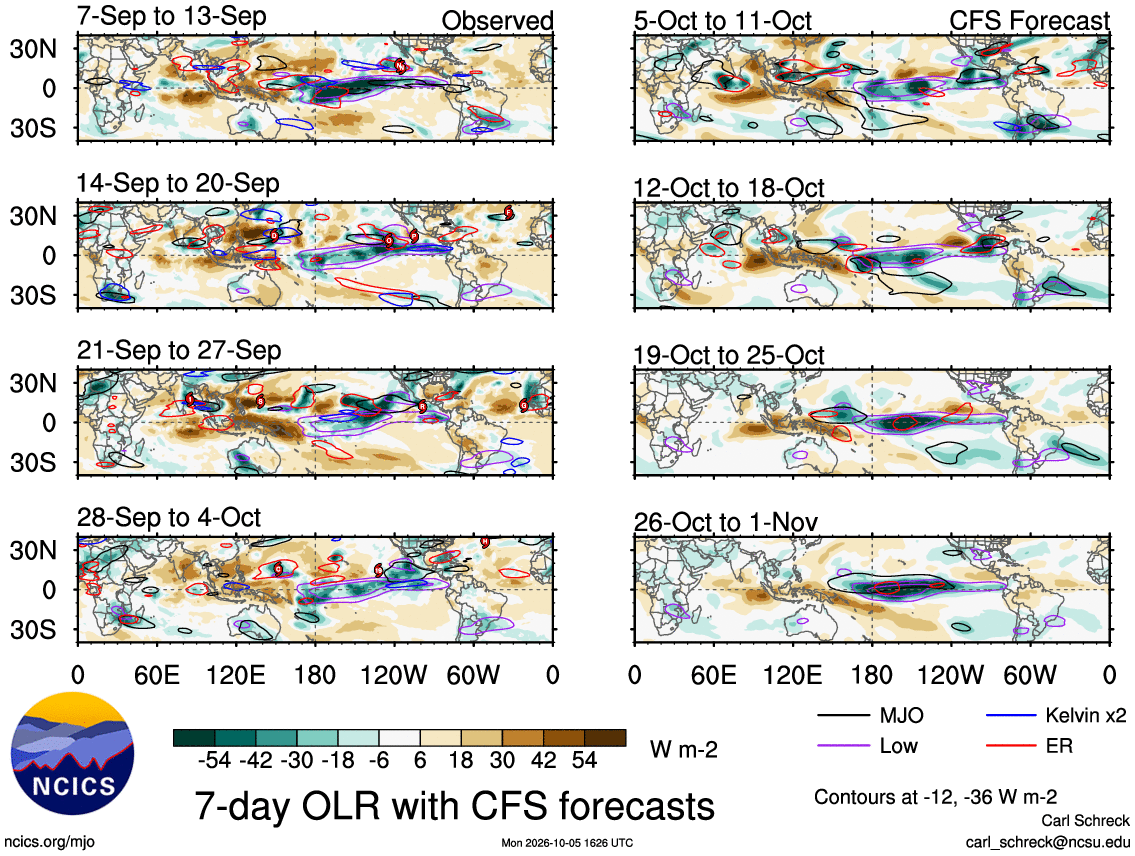
MC convection is mostly shut down barring the typical passing ER or MJO pulse. Can also see the seasonal collapse southward of Eastern Pacific convection towards the equator as we get closer to November.