All Activity
- Past hour
-
 Let’s keep fixing problems by treating the symptoms and not the cause https://www.newscientist.com/article/2533348-seeding-clouds-with-seawater-could-prevent-a-super-el-nino/
 -
Would love a week of rain.
-
 Fine looking summer week upcoming. Of course the nuts will want rain instead.
 -
I was working night shift in a warehouse in Savage, MD in Feb ‘83. The snow began while we were working. Before leaving, I asked the boss “if it snows all day, are we working tonight?” He told me emphatically that we didn’t close for snow. Having grown up in Western Md. where we rarely closed for snow, I took him at his word. That evening, I swept 2’ of snow off my driveway (didn’t own a shovel) and dutifully drove to work. Only to find the place deserted and 4’ drifts against the door.
-

Central PA Summer 2026 Discussion/Obs Thread
Itstrainingtime replied to Voyager's topic in Upstate New York/Pennsylvania
I can't get excited because I have zero interest in anything that causes damage. -

Central PA Summer 2026 Discussion/Obs Thread
Voyager replied to Voyager's topic in Upstate New York/Pennsylvania
I can't get excited about severe threats because they never materialize in my local vicinity. -
If you want to kayak, I would recommend trap pond or killens pond, both state parks. Killens also has a small water park that is actually very nice with a just redone pool. Admission is like $12
-
The ferry is a great experience! And cape May is a fun little town, almost like a mirror to Lewes. Lots of beautiful Victorian beach houses and hotels, and I think there is a trolley tour of them. A small boardwalk with a few restaurants too. It's been years, but we had lunch at a Stewart's (like the root beer) that was inside a old bank. We are in the vault!
-
Central PA Summer 2026 Discussion/Obs Thread
Itstrainingtime replied to Voyager's topic in Upstate New York/Pennsylvania
SPC has highlighted a lot of us in a rare Day 7 Outlook. Mentioned that the severe threat may last for days beyond that. Winter can't come soon enough. -
Central PA Summer 2026 Discussion/Obs Thread
Mount Joy Snowman replied to Voyager's topic in Upstate New York/Pennsylvania
Low of 67 with .02” of rain. Onward. -
 The drought 3 years ago blows away anything I’ve seen. Ponds and what not look decent here. A little low but nothing atypical.
 -
1.68" yesterday. Most of that fell in an hour yesterday evening.
- Today
-
Locked in on summer classic
-
https://www.spc.noaa.gov/products/exper/day4-8/ ... Friday/Day 7 and Beyond -- Upper Great Lakes into the Mid-Atlantic ... Strong northwest flow will be established between the previously described western US ridge and eastern Canadian trough. Rich boundary layer moisture is expected to be present to the south of a residual cold front that will be draped somewhere from the Great Lakes southeast into the Mid-Atlantic/Southern New England. Strong diurnal heating each afternoon will support scattered thunderstorm development capable of producing damaging outflows. Severe probabilities were introduced for Day 7 with this outlook given increasing confidence in thunderstorms developing within surface troughing east of the Appalachians. The exact location of these highlights will likely be refined with subsequent outlooks. Additionally, the overall large-scale pattern seems conducive for one or more shortwave troughs to move through the broader northwesterly flow across this region. Given the (seasonably) strongly unstable and sheared environment, one or more southeastward moving MCSs may be possible during the Day 7 - Day 10 period. Ensemble guidance varies significantly as to the timing and location of these potential short-wave troughs, but the overall pattern would suggest additional severe weather potential at the end of the forecast period and in the days that follow. ..Marsh.. 07/11/2026
-
2026 Mid-Atlantic Severe Storm General Discussion
high risk replied to Kmlwx's topic in Mid Atlantic
The rare Day 7 SPC outlook for our area!- 999 replies
-
- 1
-

-
- severe
- thunderstorms
- (and 7 more)
-
 That could tell us something about the reality of the urgency/risk to actual people. First, there's the "facade" of crisis, then ... we have to pay to find out how it will harm us? Riiiight - What ...? so let's venture a scenario. Suppose the Canary Islands over there SSE of the Azores go on ahead a bifurcate in a geological event that sldes the western slope of the trillion trillion trillion ton volcanic shield's mass into the Atlantic depths ... sending enough wave energy to surge up a 1,000 foot high tsunamis into the eastern seaboard of America. Media-sphere holds back, unless we spend 2.99 on a paywall site to find out what's going on. Another 4 bucks for the premium service of finding out how one can save their ass or die. That's right ... 4 bucks or you die! It's tacky at best. I mean that's obviously a fictional/exaggerated depiction there but it takes elaboration of circumstance to brightly identify the point. If it is really harmful, the ethical thing to do is tone down the rhetoric and up the expediency of useful/vital information -
 -
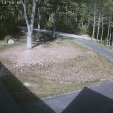 Lawns are going to be toast by next wknd. Sent from my SM-S921U using Tapatalk
 -
June is a convenient cutoff considering May 2025 was 8.05”. But I get it, I want more rain too. PVD Historical Averages and monthly totals May 25 3.38” 8.05” +4.67” Jun 25 3.25” 1.15” -2.10” Jul 25 3.18” 5.08” +1.90” Aug 25 3.64” 2.76” -0.88” Sep 25 3.60” 6.24” +2.64” Oct 25 3.47” 4.80” +1.33” Nov 25 3.88” 2.56” -1.32” Dec 25 4.09 2.37” -1.72” Jan 26 3.82” 3.08” -0.74” Feb 26 3.32” 2.84” -0.48” Mar 26 4.16” 5.57” +1.41” Apr 26 3.86” 1.89” -1.97” May 26 3.38” 2.01” -1.37” Jun 26 3.25” 2.38” -0.87” Plus did they underreport liquid equiv in the big snowstorms this year? Spring has been dry, but where is the longterm 13” deficit?
-
I remember that! I was only 6 lol. Crazy rates. Best rates I've ever seen were Jan 25, 2000, February 2010, and by far the most insane was last January in the town of Pulaski and Lacona NY. 6-8" per hour is just different. It's like twilight zone. You can literally watch it accumulating like a time lapse video.
-

Occasional Thoughts on Climate Change
donsutherland1 replied to donsutherland1's topic in Climate Change
I strongly agree. This chart that purports to represent rural U.S. temperatures is badly flawed. I'm not surprised that there is no attribution or full inventory of stations and the years for which their data was used. However, upon further research, it seems to have originated at the Electroverse climate change denial site. The chart relies on a changing station sample, extreme geographic undercoverage (n=6) in the early period, and equal weighting of unevenly distributed stations. The combination of absolute temperature averaging and changing station composition is a fatal flaw. To illustrate the absurdity of the impact of a changing station mix. Let's say one had a mix of just Charleston and New Haven in 2025. The annual average mean for those two stations (not representative of the U.S., but that's a separate issue) would have been 60.6°. Now, if one added Casper into the mix, the new three-station average would fall sharply to 56.2°. Simply adding or removing stations has an artificial impact on the temperature average. This chart elevates the art of "cherrypicking" to new heights. -
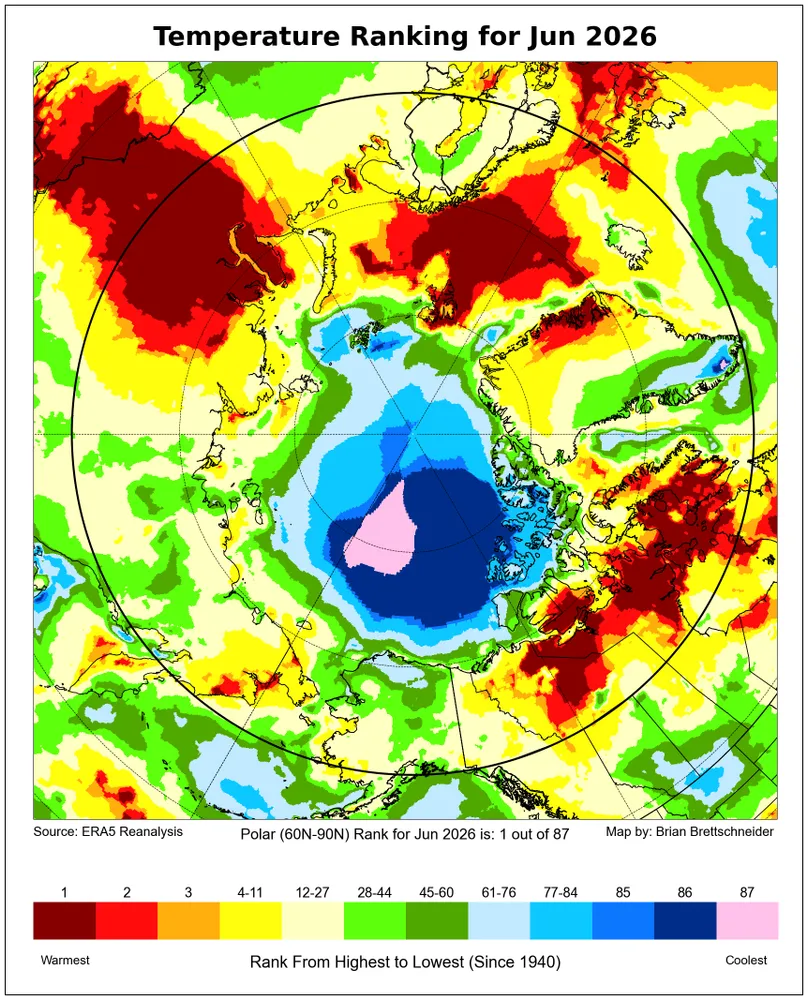
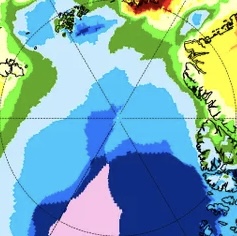
But for just 80N+, it is quite cold overall! Below is a closeup of just the 80N+ portion showing that overall it’s quite cold: 1. only ~1/7 is in warmest 1/2 of years vs ~6/7 in coldest 1/2 2. -a little >50% is in 4 coldest colors meaning coldest 11 of 87 -but only ~6% is in warmest 11, which is <1/8 the size of coldest 11 3. -~25% is in coldest 3 of 87 -but only ~1% is in warmest 3 of 87, which is a mere 1/25 of the size of coldest 3
-
.11" rain yesterday and .85" for the week. Green grass abounds.
-

2026-2027 Super El Nino
snowman19 replied to Stormchaserchuck1's topic in Weather Forecasting and Discussion
I’m starting to think the CFS isn’t overdone with the peak anymore. The way this is going, a traditional ONI peak of +4C and a RONI peak of +3.5C would not surprise me. I also think we have an MEI of +2 come August based on how strong the ocean-atmosphere coupling (Bjerknes feedback) is becoming Every model has a monster come November/December -
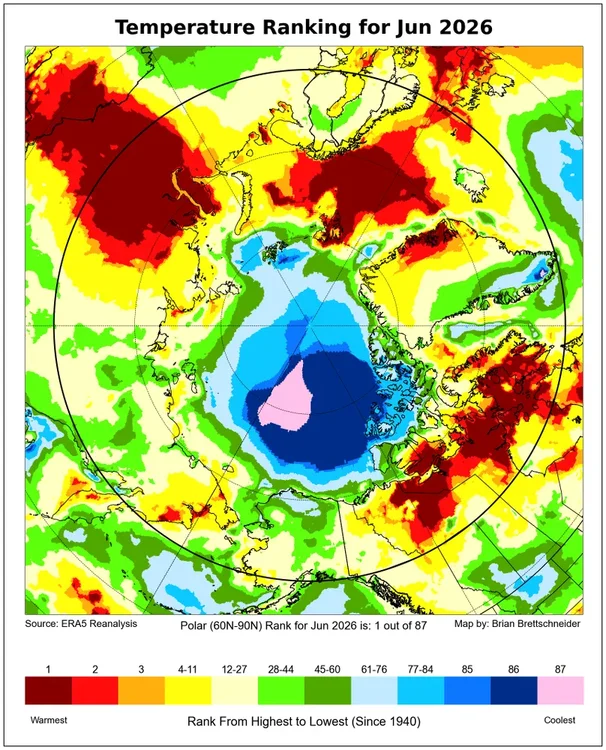
This is the actual ERA 5 temperature map which produced the climate record for June 2026. The Pacific Arctic area to the north of Alaska did have its coldest June since the 1940s as I mentioned in my first post. But you can see how the total area from 80N to 90N had zones closest to the warmest on record on the Atlantic side. So the actual rank of the high Arctic wasn’t the coldest on record. Since the totality of the Arctic north of 60N had the warmest June on record. Even the less reliable ECWMF only starts in 2002, so an apples to apples comparison to any year earlier than 2002 can’t be made. This is why we use Era 5 for comparison to times since the 1940s.
-

Mid-Long Range Discussion 2026
WinstonSalemArlington replied to BooneWX's topic in Southeastern States