All Activity
- Past hour
-
Who can spot the significant warming of the USA away from our urban heat islands?? This looks a whole lot like Chester County PA - I bet you NCEI chilled the 1920's and 1930's - I always said there is no climate fence around any county!
-
Looks like the southern valley is getting raked by some pretty good storms. We've had about a half inch of rain since midnight here but zero thunder.
-
 60 second sun shower just passed over. Hooray!
 -

Chester County PA - Analytical Battle of Actual vs. Altered Climate Data
chubbs replied to ChescoWx's topic in Climate Change
The science we are talking about is settled and you don't understand it. The average of Phoenixville, Coatesville and West Chester is as warm as the Philadelphia Airport and the Newark Ag station in the early 1940s. The COOP average dropped steadily after 1945 due to cooling moves at Coatesville (1946,48), Phoenixville (1948) and West Chester (1970). By the early 1970s the Coop Avg had dropped to just above Allentown. NCEI was much more stable than the COOP average, staying just above Allentown the entire period. NCEI isn't fooled by station moves. The mistake you are making is assuming that the average of the COOP stations is a good estimate of the county average temperature. That certainly isn't the case before 1970 when the COOP stations are much warmer than the County as a whole.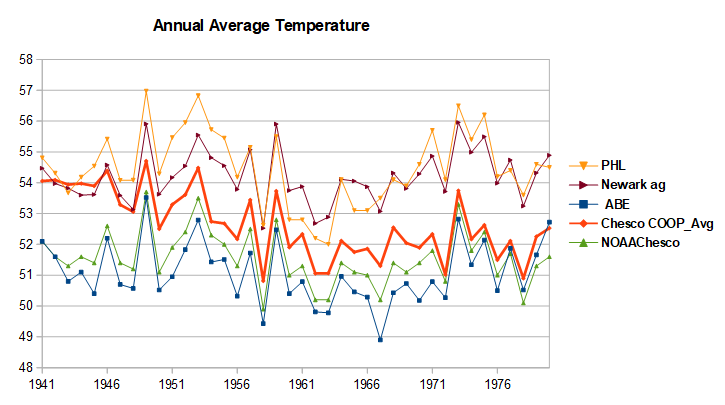
-
Light rain about to reach God’s Forsaken Lands (Stephen’s City)
-
SPC just upgraded day 2 outlook for tomorrow slight risk pushed further in tn now in west and middle tn has 2% in northern and northwest part of west and middle tn 5-15% risk expanded into west and middle tn and a 5% hail risk no cig level hatching https://www.spc.noaa.gov/products/outlook/archive/2026/day2otlk_20260710_1730.html .
-
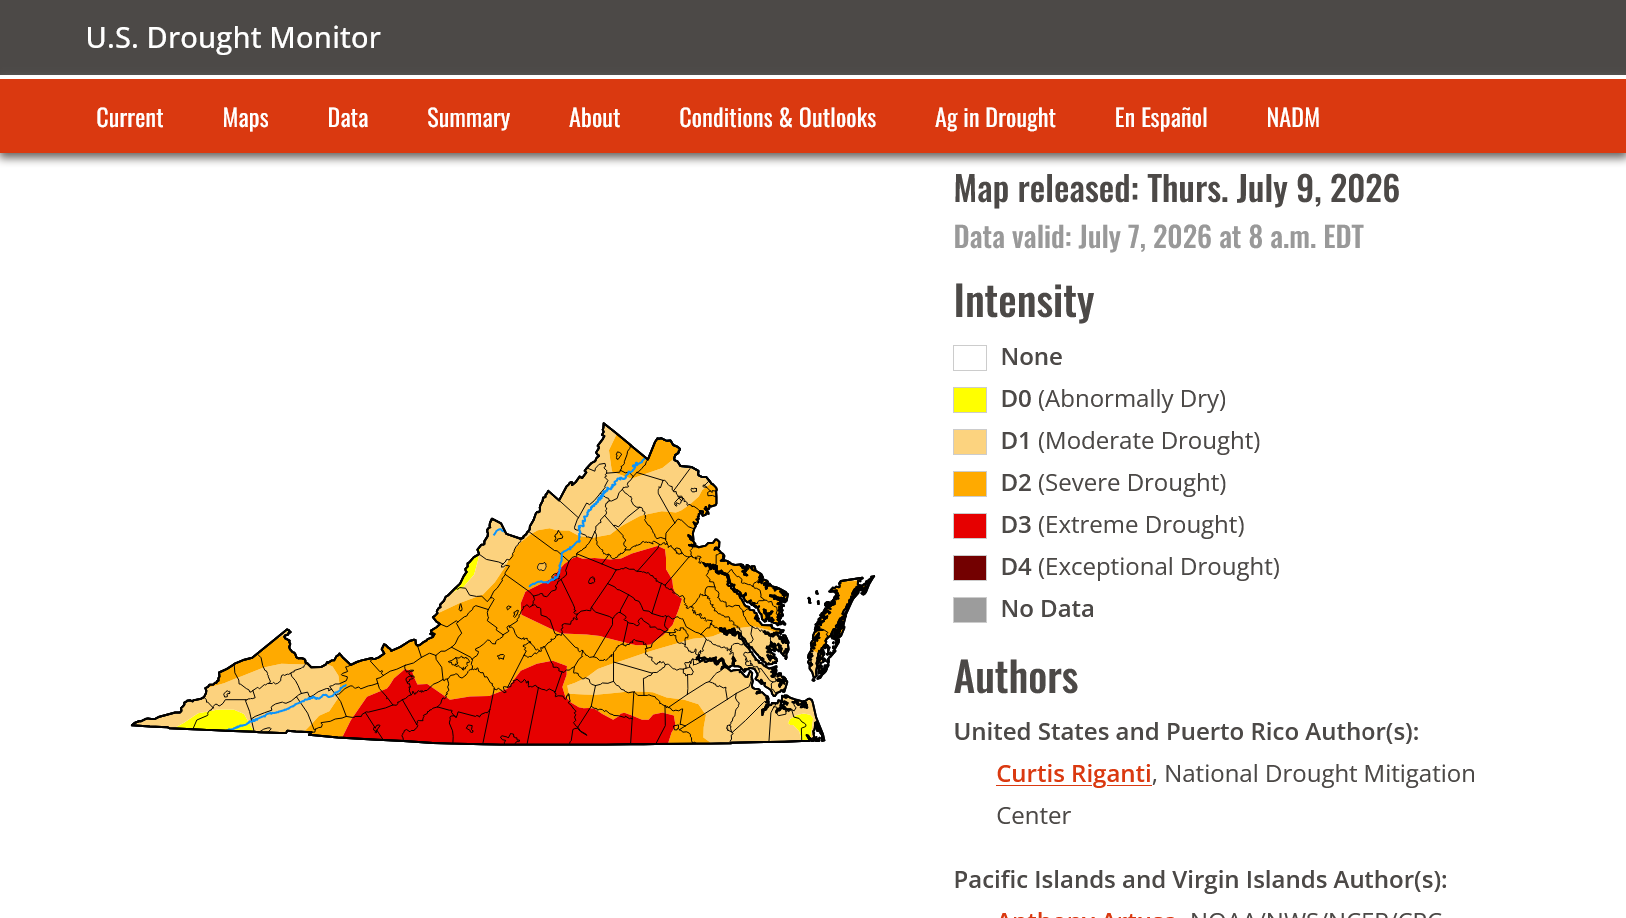
Here is how those determinations are made: https://droughtmonitor.unl.edu/About/AbouttheData/DroughtClassification.aspx. Summer rainfall does not generally help relieve longer term drought conditions that are dictated by year-on-year water budgets but can help sustain vegetation over the short term.
- Today
-

Central PA Summer 2026 Discussion/Obs Thread
Voyager replied to Voyager's topic in Upstate New York/Pennsylvania
Strange goings on here in the Skook. High clouds with the sun shining through, but spitting raindrops from time to time. -
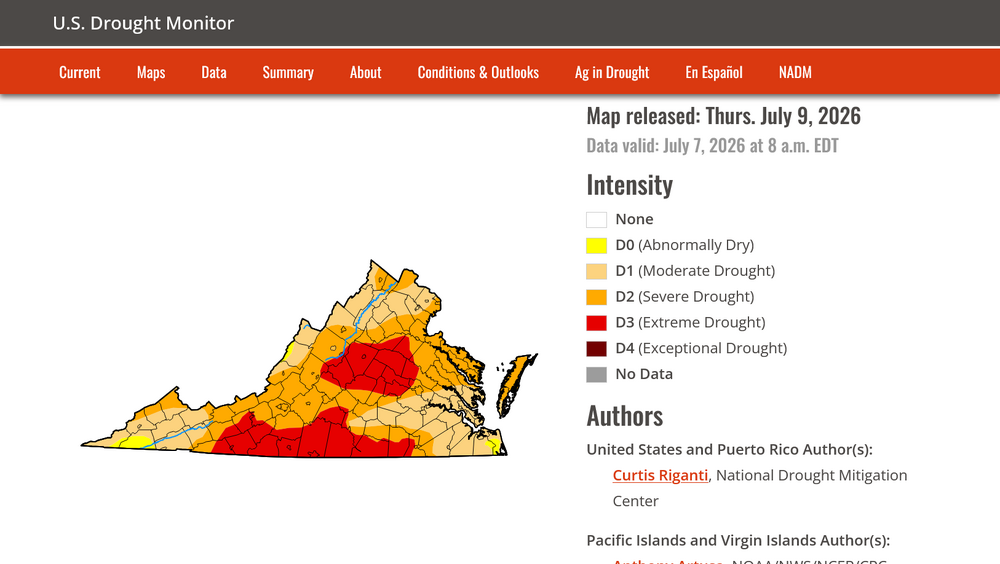
Augusta County is mostly green and growing. My lawn looks quite lush and green for nearly mid July. The U.S. Drought Monitor has not changed since June 1 and keeps Augusta in Severe to Extreme Drought. Truly amazing.
-
last weeks power outages were a warning - we will have widespread massive power outages again if we are hit by a cat 1 or 2 hurricane - aging infrastructure has a lot to do with it. Many telephone poles are very old and need to be replaced - the same with transformers on those poles - ever notice a rusting transformer ? Plus these towns are allowing various cable companies add their wire and equipment to the old poles .
-
can i come
-
That was a great winter, unfortunately only us two remember it.
-
2026 Mid-Atlantic Severe Storm General Discussion
SnowenOutThere replied to Kmlwx's topic in Mid Atlantic
What about on the edge of an actual MD day? I always find those worse. -
2026 Mid-Atlantic Severe Storm General Discussion
high risk replied to Kmlwx's topic in Mid Atlantic
This has all of the makings of a "pity MD" day. -

Mountain West Discussion
mayjawintastawm replied to mayjawintastawm's topic in Central/Western States
Amazing how they are so consistent in forming as widely scattered light storms then really blowing up about 40-50 miles east of the Metro and consolidating. Yesterday the line was solid from more or less Scottsbluff down to south of La Junta. Glad I was not trying to fly into DEN. -

2026-2027 Super El Nino
GaWx replied to Stormchaserchuck1's topic in Weather Forecasting and Discussion
After rising to -0.19 on June 24th, the CFS daily PDO has since plunged and is as of July 9th down to -1.50, which is the lowest daily PDO since way back on Nov 8th!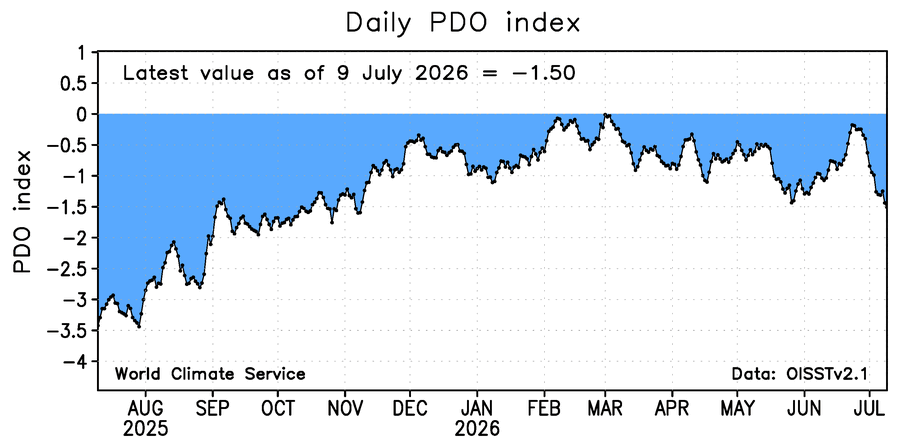
-
I hear this is his first stop! LOL!
-
2026-2027 Super El Nino
GaWx replied to Stormchaserchuck1's topic in Weather Forecasting and Discussion
The TAO buoy data, including the Dateline data found at the links below, totally confirms Roundy’s noting of the lack of a consistent 30C isotherm E of the Dateline in 1997 when considering SSTs along the 180 and 170W longitudes and comparing those to 1997 to 2026. But it’s also important to keep in mind that there’s been a large amount of GW since 1997. So, that by itself gives 2026 a significant advantage. That’s of course why relative measures have been incorporated in products by NOAA and some others worldwide. That being said, this isn’t meant to minimize the significance of what Roundy said as it’s still a big deal! That’s the beauty of the SOI. It doesn’t appear to be substantially affected by GW and thus the comparison to past years. TAO buoy historical data: https://www.pmel.noaa.gov/cache-tao/sb1/deliv/data1897934/sst5s180w_dy.ascii https://www.pmel.noaa.gov/cache-tao/sb1/deliv/data1897934/sst0n180w_dy.ascii -
 random pop up shower overhead, with partly sunny skies but not enough to fully wet the ground very tropical, 84/72 of course, most of it misses me by a mile or 2
 -

Central PA Summer 2026 Discussion/Obs Thread
canderson replied to Voyager's topic in Upstate New York/Pennsylvania
Looks like major heat comes back middle to late next week as they ridge out west will move over us. Not quite as hot as the records we just experience. And there are signs it’ll be short lived as a big BN ridge wants to take over the NE/mid Atlantic. -
Will that blob to my west make it over the mountains? Stay tuned
-
 Squall lines have become as rare as derechos and hurricanes around here
 -
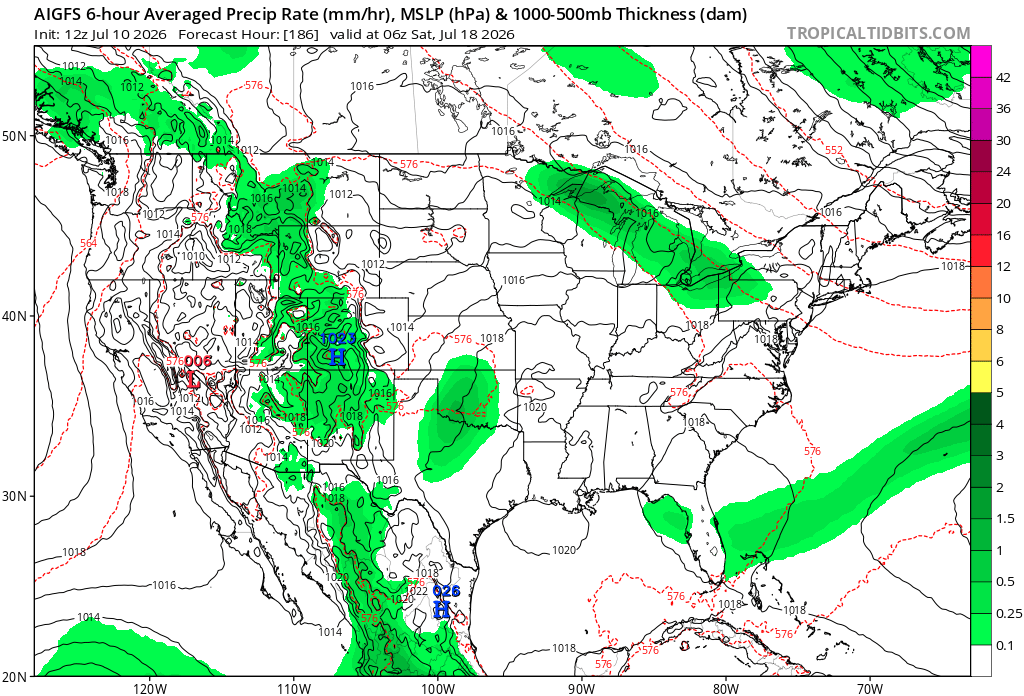
.thumb.gif.f92b16c631a1d15d405ed77b33f0710d.gif) west. there was nothing to track until the 18th onward
west. there was nothing to track until the 18th onward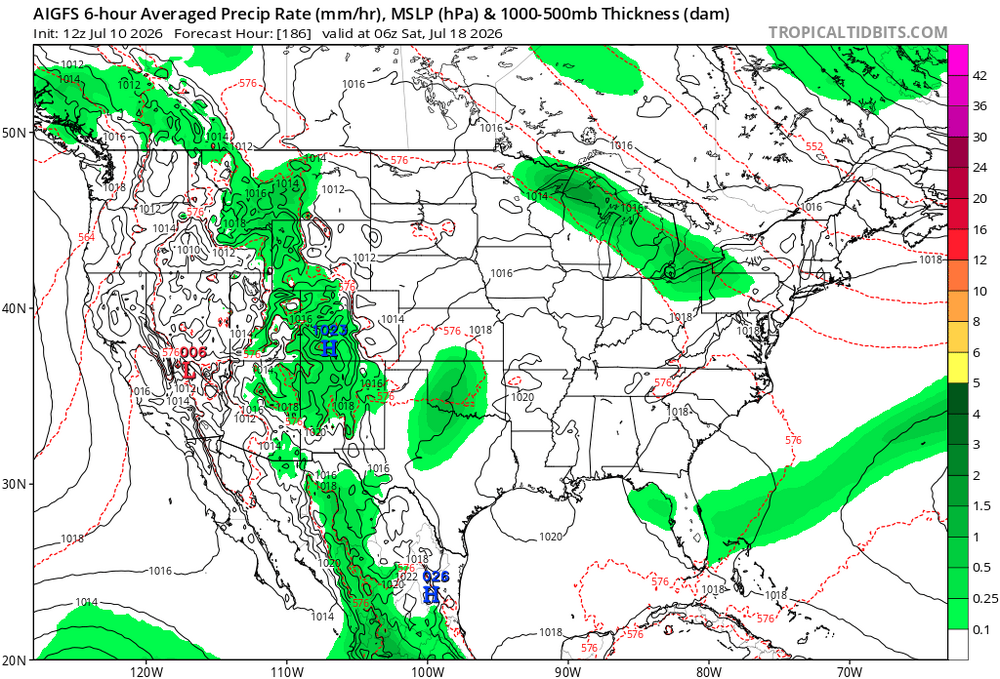
-

2026-2027 Super El Nino
snowman19 replied to Stormchaserchuck1's topic in Weather Forecasting and Discussion
We are already way ahead of all other El Niños on record in region 3.4. That aside, once this current WWB/DWKW and the 30C isotherm east of the dateline catches up and does their dirty work over the next month, Paul Roundy thinks this event surpasses 1997 in the far eastern ENSO regions next…subsurface and surface -
I meant long range
(002).thumb.png.6e3d9d46bca5fe41aab7a74871dd8af8.png)