All Activity
- Past hour
-
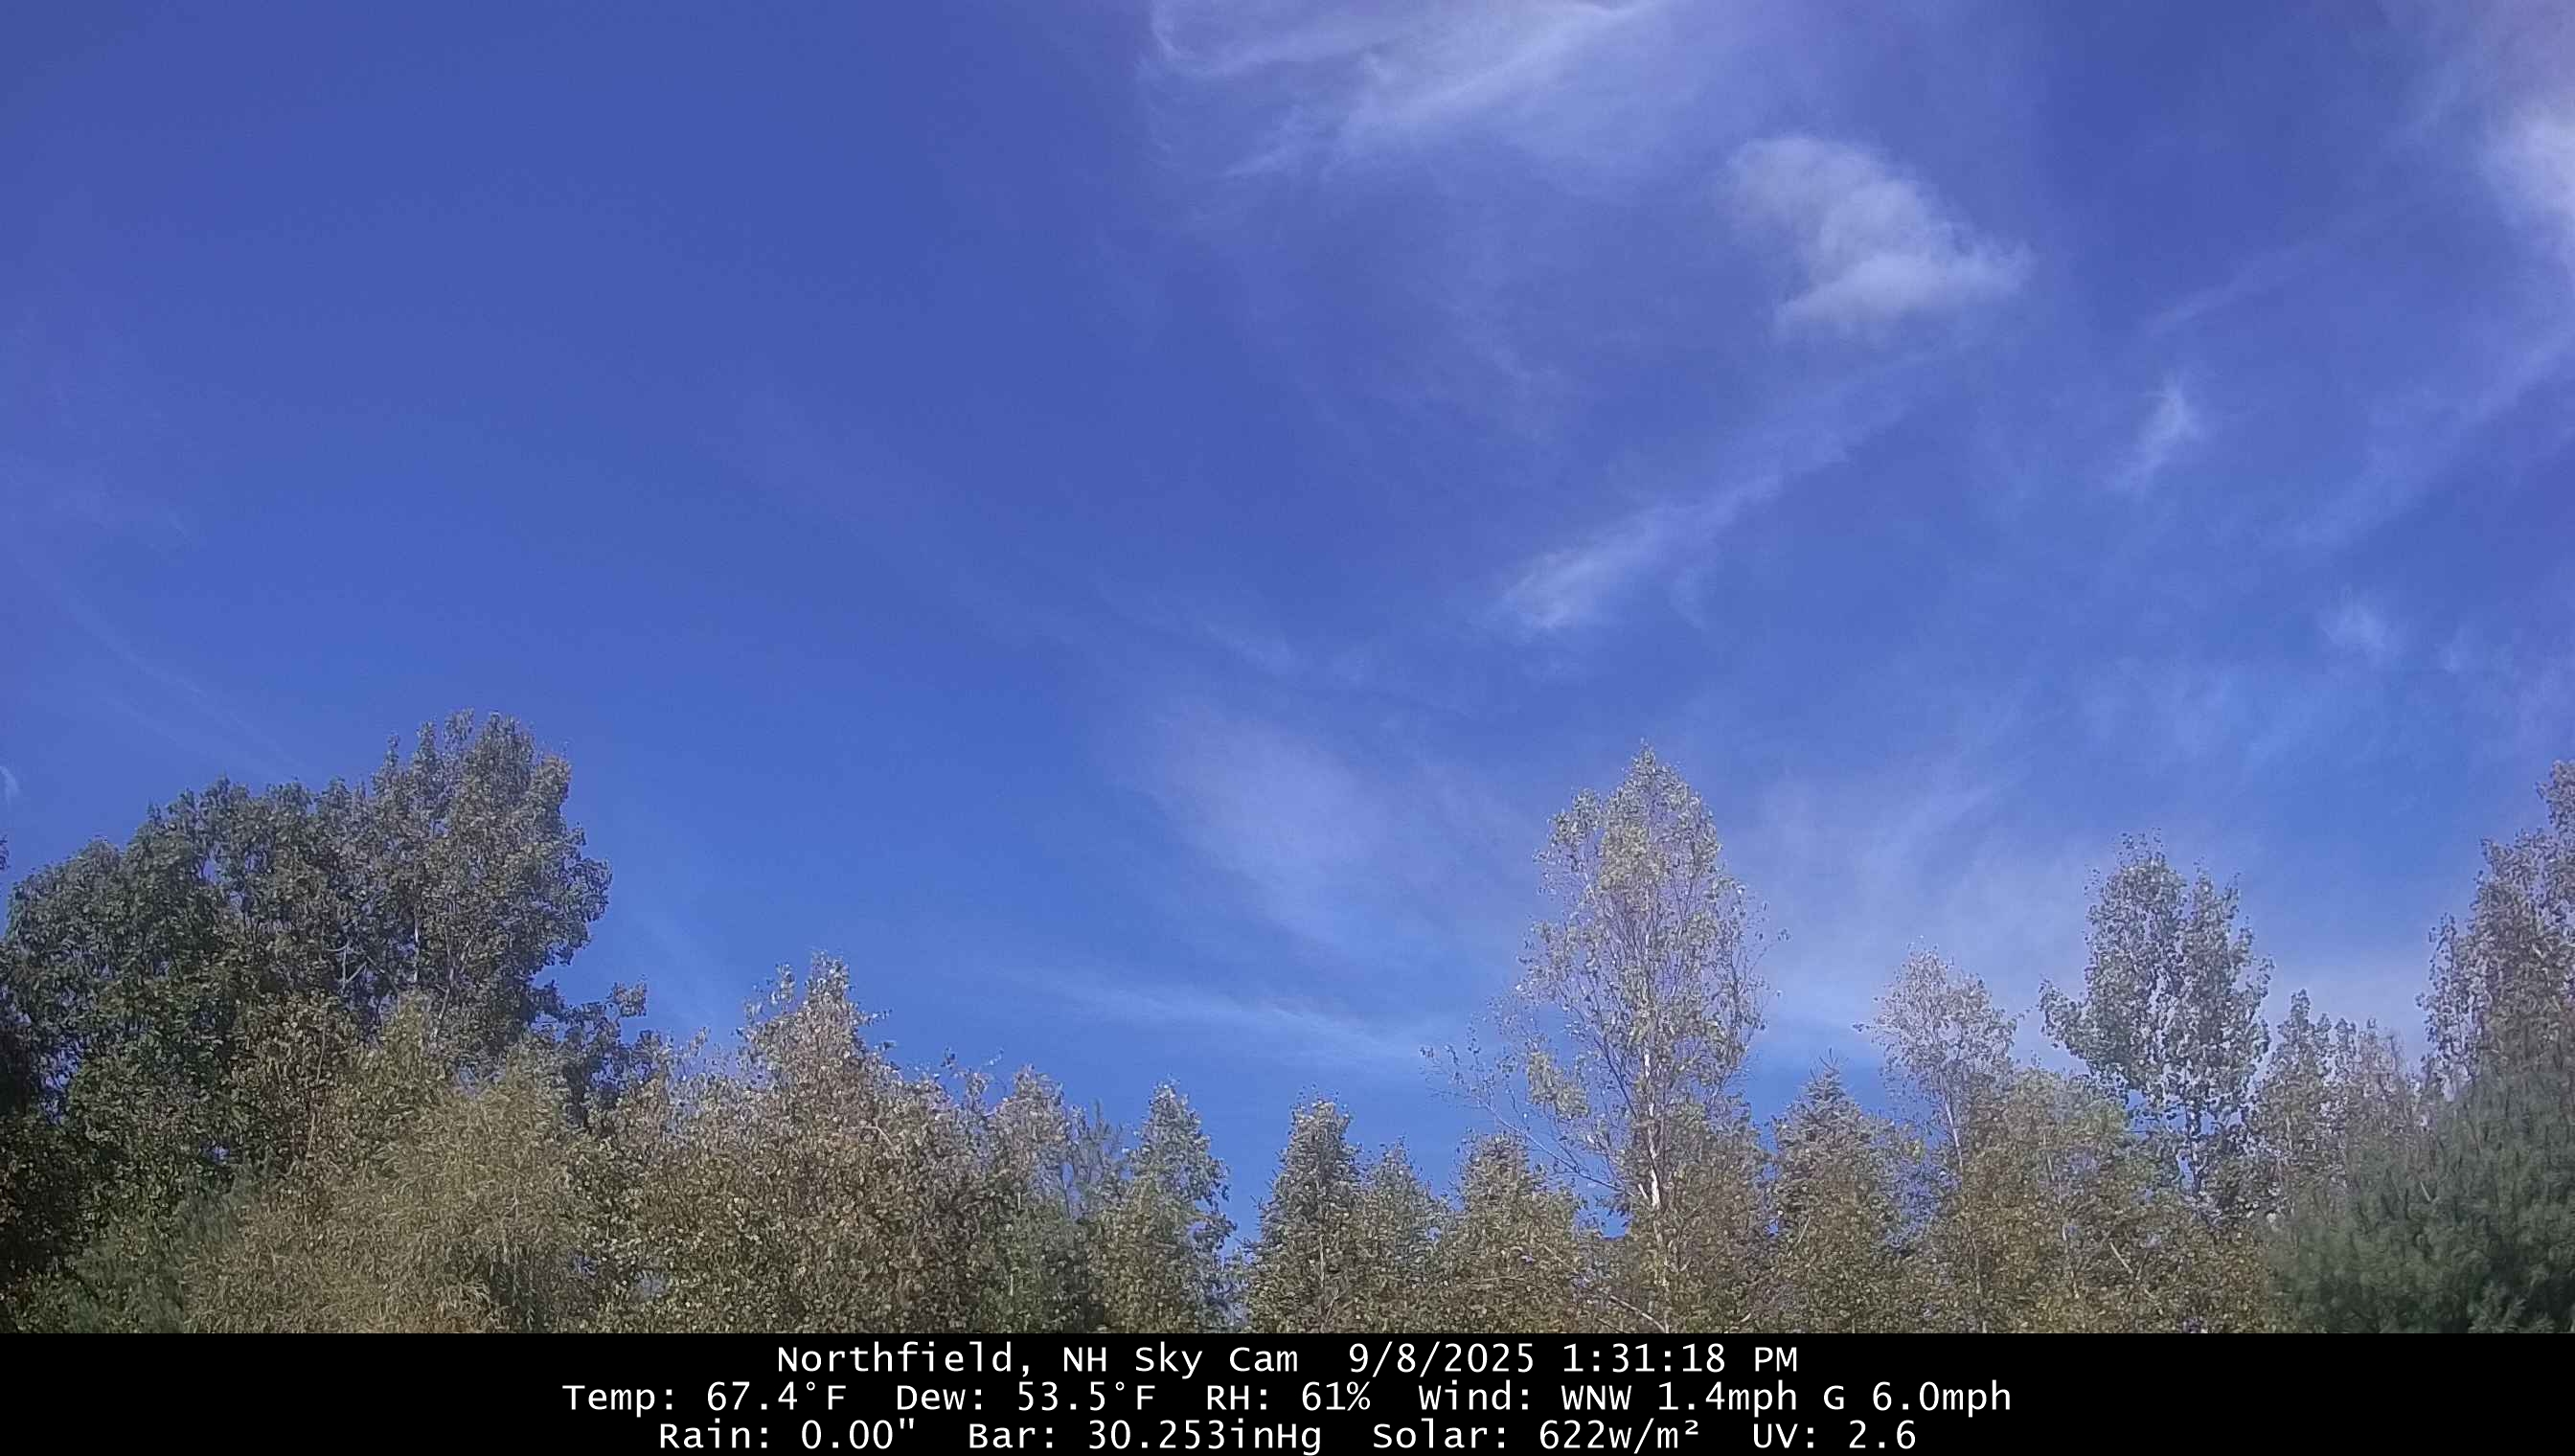
Low at SBN was 41 but I had 39 on my thermometer at home.
-
The coastal plain will celebrate with December holiday Luau’s. As always ….

-

September 2025 OBS-Discussion centered NYC subforum
PhiEaglesfan712 replied to wdrag's topic in New York City Metro
1988 was one that turned cold really quickly. The summer, particularly from June to the first half/two-thirds of August, was then a warmest on record. Then at the end of August, it just turned cold, and never really looked back. October 1988 was one of the coldest on record, and in some spots, beat out the cold standard of October 1976: Come to think of it, the warm west makes this look like the October version of February (or JFM) 2015.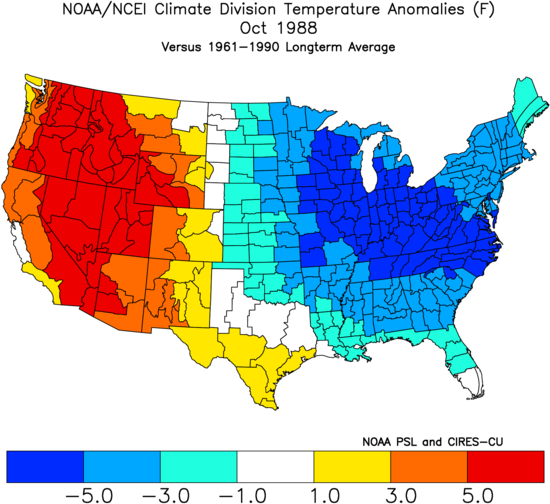
-

2025 Atlantic Hurricane Season
olafminesaw replied to BarryStantonGBP's topic in Tropical Headquarters
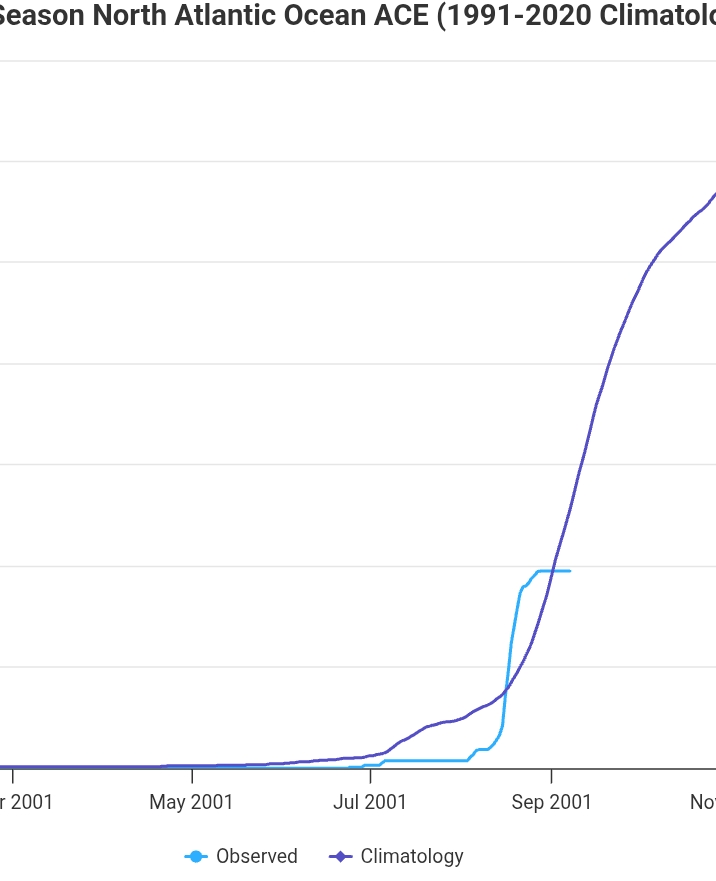
Back below average ACE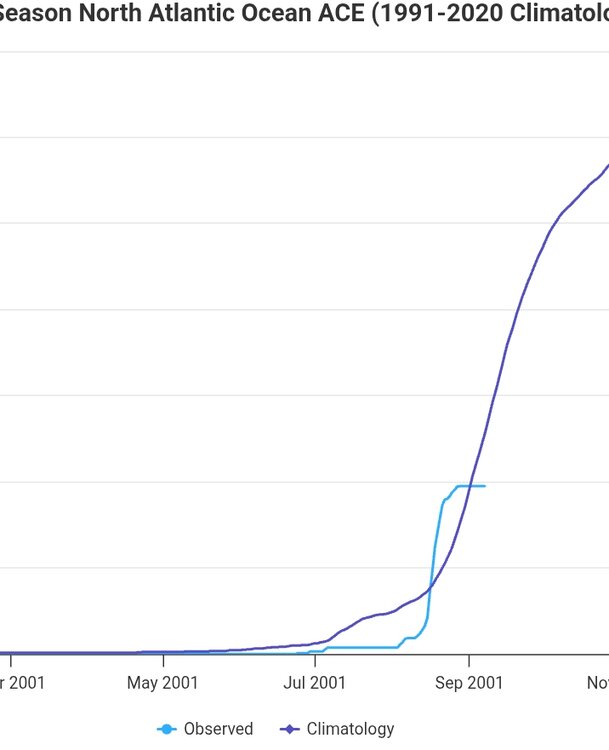
-
Found this research study (The Elevation-Dependence of Snowfall in the Appalachian Ridge and Valley Region of Northeastern Pennsylvania) examining the impacts on elevation dependence snowfall and the types of conditions that influence events to either be low in snowfall range with elevation or high. Definitely found it to be an interesting read and I'm sure the mets (and @psuhoffman) would enjoy it too. Here is the link (http://nwafiles.nwas.org/jom/articles/2017/2017-JOM8/2017-JOM8.pdf), also if any met would like to chime in I remember a particularly elevation dependent snowfall in late November last year and wonder how those conditions line up with the studies findings.
-

September 2025 OBS-Discussion centered NYC subforum
FPizz replied to wdrag's topic in New York City Metro
https://www.weather.gov/asos/CurrentEvents.html Though I'm told from Tony Gigi when I asked about the qc process, that they only qc the instruments, not the environment around them. Hence I guess why NYC is determined to be fine, since all the instruments are in correct working order. -
West is best.
-
38.7 here this morning.
-
42 here this morning!
-
NEW TROPICAL CYCLONE FORECAST TO DEVELOP AFTER 150 HOURS FORECAST POSITION AT T+150 : 13.9N 32.5W LEAD CENTRAL MAXIMUM WIND VERIFYING TIME TIME POSITION PRESSURE (MB) SPEED (KNOTS) -------------- ---- -------- ------------- ------------- 0000UTC 15.09.2025 156 15.0N 33.7W 1012 27 1200UTC 15.09.2025 168 15.1N 37.9W 1010 33
-

September 2025 OBS-Discussion centered NYC subforum
wdrag replied to wdrag's topic in New York City Metro
ASOS new temp sensors? I'm out of touch... LINK for info? Thanks, Walt -
Water was coming in through our doorknobs. I had never seen that before.
-
Two decades later and the US is gleefully dismantling the Federal disaster and weather enterprise. ¯\_(ツ)_/¯
-
Bottom line, even though there wasn’t a ridiculous amount of arctic sea ice loss this spring/summer/early met fall, our starting point at the beginning of melt season was so low, we are still finishing at record low levels this year. God knows how many years it will take, when/if we get back to normal. Whether the arctic sea ice loss is related to SSTs or solar or both is anyone’s guess
- Today
-
Heaviest rain I ever experienced. It actually hurt to be out in it even in proper gear Sent from my SM-G970U1 using Tapatalk
-
gwdlt
-

E PA/NJ/DE Autumn 2025 Obs/Discussion
RedSky replied to PhiEaglesfan712's topic in Philadelphia Region
2.30" for September continuing the odd trend of predominately very dry yet high rain totals -
-
Mid 30s here this morning. I looked for frost on the rooftops this morning but didn't see any.
-
It glazes eyes over - apparently - in here, as I've tried to explain this aspect about nature - it doesn't report back like anyone gets it. It's probably me and my writing... Gradient is everything. Not sure why it doesn't resonate with the 'cognoscenti' of the site but ...heh. Anyway, warm water doesn't cause hurricanes ( I'm just using your post as a staging launch) it doesn't What is correlated to TC genesis is the qualitative state of the [empirically observed] sounding, which has also long been geophysical derived thermodynamically. The tropical sounding (identified by some dude, Jason Dunion) has warm air moist air from the surface to 500mb give or take. But as you head toward ~ 300 mb level the DPs drop way off: such that the wet-b temperature is relatively low. So, you have a statically unstable environment ( CAPE -heavy air), with warm dry air over top. This initially tends to resist intability in that high level ( which incidentally...due to thermal wind consideration, tends to outflow/divergence ...hence why we look for anticyclonic wind fields at high levels). The the divergence excites/forces UVM. The arriving warmer psuedo-adiabatic turrets turbulently mix, lowering the temp ... which adds to the instability/UVM above 500 mb/acceleration. There's bound to be exceptions. Of course...that's why there are 'phase transition' cyclones that quasi overlap. But should these soundings deviate significantly enough ...doesn't matter how warm the water is. No TC. The sounding as described above really outlines a thermodynamic gradient. Like every system that exists in the Universe, the greater the change between A vs B ( which is the gradient ), the more violent A --> B ... that's the difference between a stressed out coughing TC, versus Dorian 175 mph oil driller. Not talking about mechanical stress like shear and so forth. But there's no point in considering these latter mechanics if the thermodynamics are not satisfied to begin with.
-
Is that even possible?
-
Any snowy Dec (8”+ ) followed by dud? I’ll check now: Indeed, your idea verifies well! I have to go all of the way back to 1945-6 to find the last snowy Dec not having 16”+ Jan+! Dec had 15.6” and then they had only 12.1” Jan+. -Then I have to go back to 1926-7: 11.7” Dec; 10.6” Jan+ -1912-3: 11.4”; 3.1” -1902-3: 14.4”; 14.3” That’s it going back to 1869-70. Just 4 winters out of 43 (9%) with 8”+ in Dec failed to get 16” Jan+. For the other 113 winters (<8” in Dec): 46 (41%) Jan+ had <16” Jan+ *So, only 1 in 11 Jan+ were <16” when Dec 8”+ vs just over 4 in 10 when Dec 8”+! That’s a pretty strong correlation.* Longterm avg for is Jan+ is 22”. ———— *Edit: I counted 22 Jan+ <10”. 21 of those were when Dec was <8”. So, whereas 21 of the 113 (19%) when Dec <8” had Jan+ with <10”, a mere 1 of the 43 (2%) when Dec 8”+ had Jan+ with <10”! So, 2% vs 19%, meaning an even stronger indication of the correlation between Dec and Jan+ snow at NYC.
-
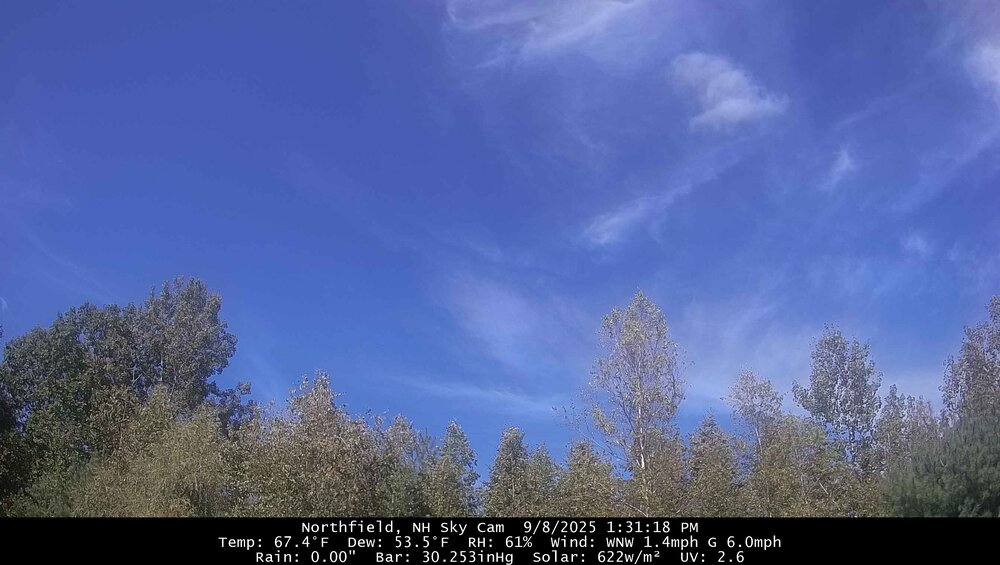
Clouds FTL today
-
They'll have to clean up the penalties and sloppy play if they want to beat the packers on Thursday. The good news is they definitely left alot of meat on the bone but the game never really felt in doubt. I think their roster Is much more talented this year.
-
What relevance does this have in relation to the graph Jenkins posted? To get back to the topic at hand, his graph shows very clearly why DC's snowfall has trended downwards since the late 1800s. Global temperatures are up, and in the case of Washington DC, that means winter temperatures are up and snowfall is down. Seeing as there is no reason to believe that global, and therefore local winter temperatures will trend down in the coming decades, snowfall averages will continue to decrease. It's literally that simple. A graph extending back to 500mya has no relevance in regards to discussion about ongoing temperature and snowfall trends, other than to perpetuate your agenda.


.thumb.png.4150b06c63a21f61052e47a612bf1818.png)