Cobalt
-
Posts
5,253 -
Joined
-
Last visited
2 Followers
About Cobalt

- Birthday June 26
Recent Profile Visitors
13,153 profile views





-

2026-2027 Record-breaking El Nino
Cobalt replied to Stormchaserchuck1's topic in Weather Forecasting and Discussion
why do you still talk like this, you're 40?
-
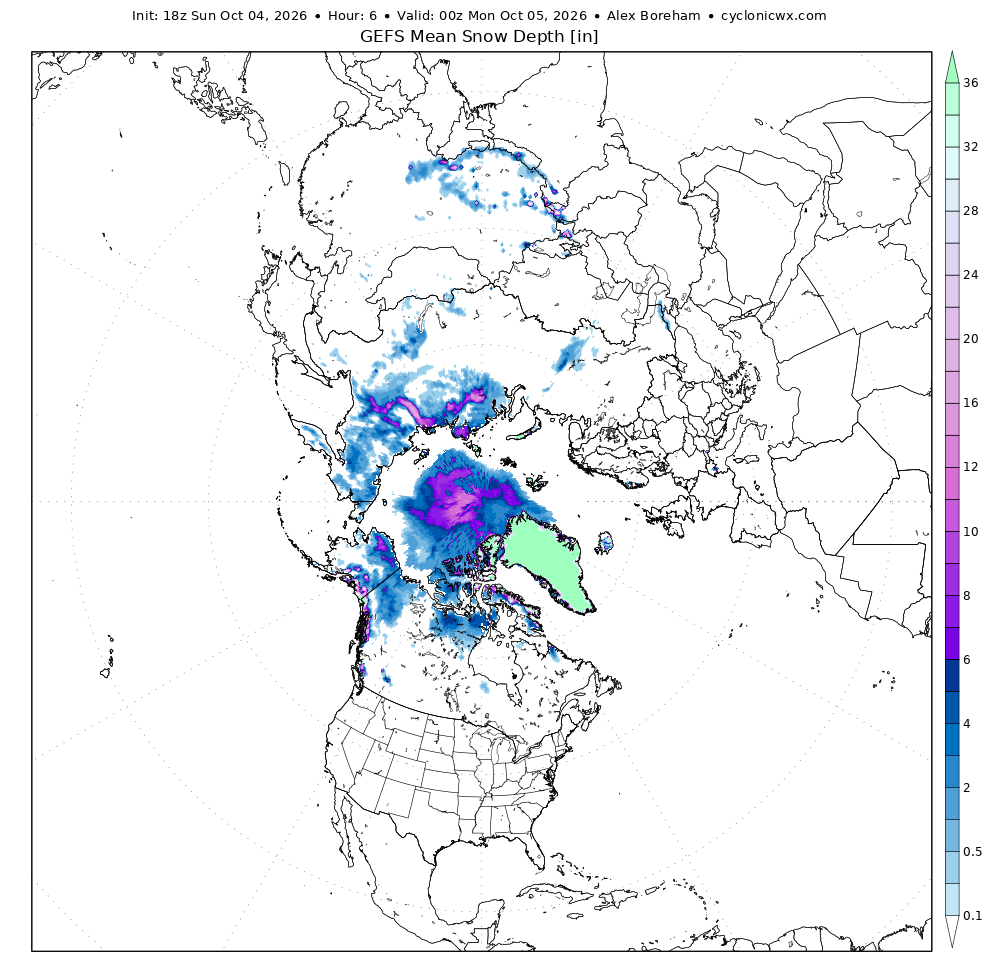
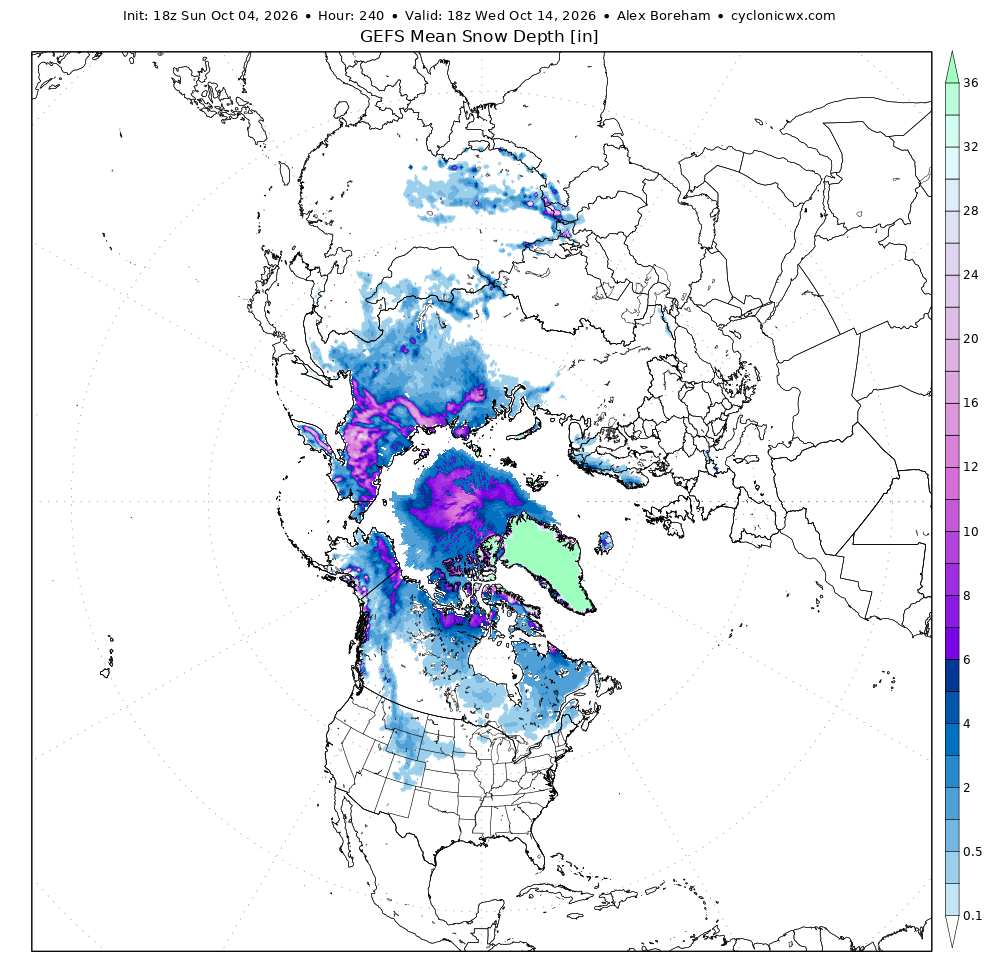
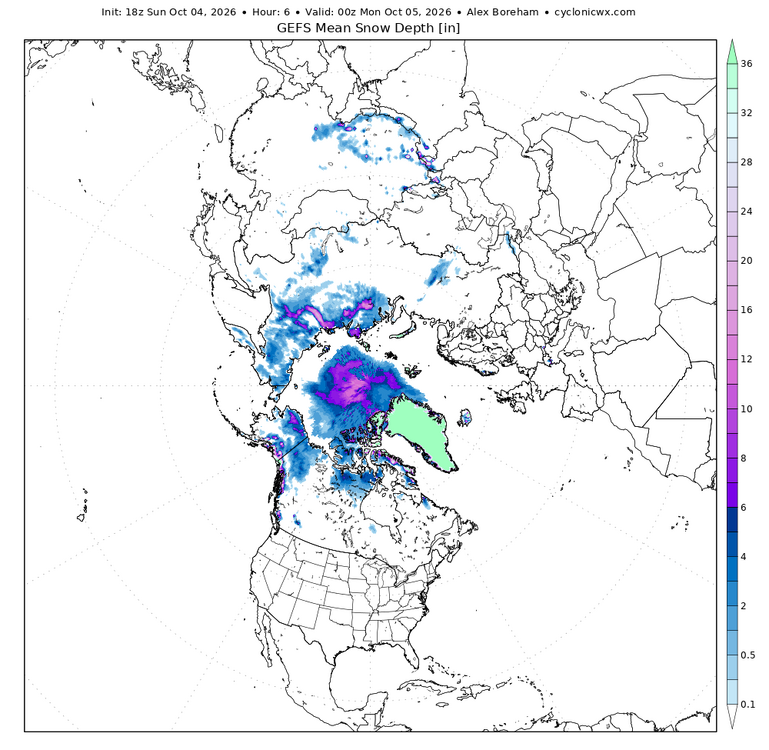
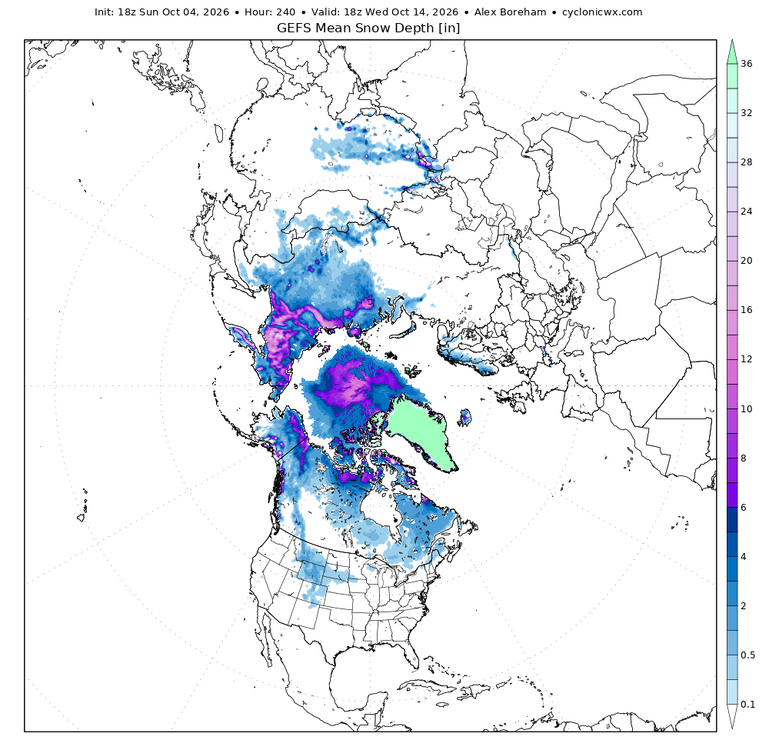
^ meh, September-early October snow cover being anemic is not new as of late. GEFS suggests extent picks up the pace soon. Snow cover to the SE of the Hudson would be several weeks ahead of schedule.
-
I was really thinking we were in for a cold and snowy winter looking at all of the analogs for east based super el ninos. This helped reign in my expectations. thank you
-
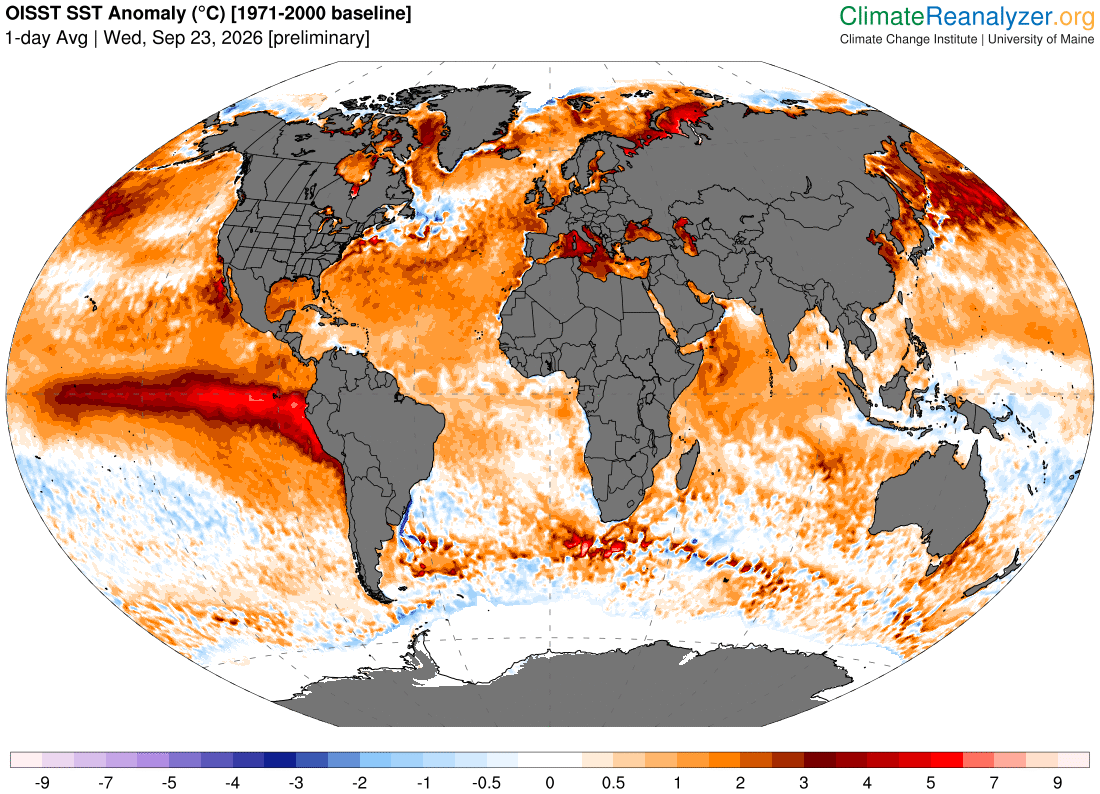
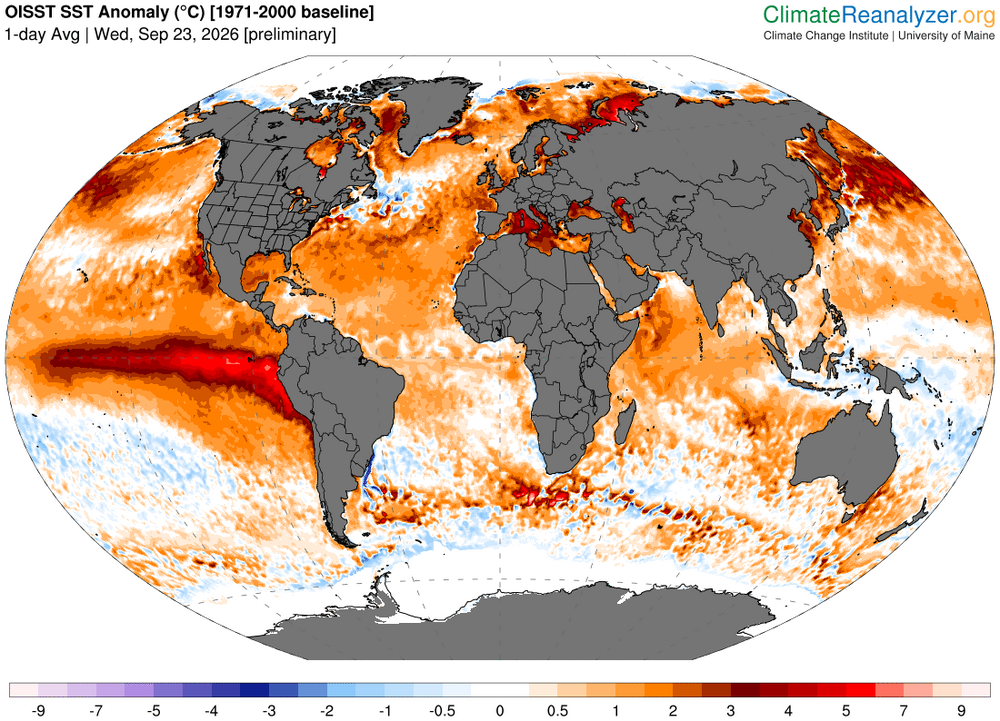
Two things can be true at the same time. Take a look at the ocean temperature anomalies: Gulf of Mexico is far and away the warmest compared to average to date at the moment. Central Atlantic top 3, subtropic Atlantic top 5. That you can't deny without trying to discredit the satellite data. At the same time though, obviously shear is an overwhelming issue in the Atlantic basin, given that the El Nino is the most anomalous feature on the planet. But importantly, take a look at the ocean temperature anomalies nearer to this storm system. Surely that is promoting a stronger storm, and if you go back into the database, such anomalously warm waters only started showing up there more recently.
-
Why so? Their methodology seems rock solid and makes logical sense.
-
This is the thing forky is deliberately forgetting. 2023-24 averaged 0.7F warmer (DCA) compared to 97-98, and had 8" of snowfall. 15-16 was only 0.5F colder than 97-98. Likewise, 72-73 was 3F colder than that winter, but was also a shutout. A Super Nino can overwhelm the base state with torcherrific airmasses for 90% of the winter, but it very evidently does its best to load the deck in the few intervals that temperatures are remotely seasonable.
-
2026-2027 Record-breaking El Nino
Cobalt replied to Stormchaserchuck1's topic in Weather Forecasting and Discussion
what's this site? -
What've you got for the individual months DJF?
-
Unless im misreading, that row's title says "typical Anak Krakatau Output", as in likely just averaging out its emissions over time. Doesn't look like there's estimated figures on 2026's eruption just yet
-
you need a graphic designer this upcoming winter?

-
this table says 2018? In any case, I saw a report that concluded Anak Krakatau's recent eruption plume went only 13% the height of Pinatubo, so likely talking about a substantially smaller impact if that figure is correct.
-
Definitely, though I do recall the Euro seasonal painting a similar picture for 23-24. That feels like the only strong nino in recent memory where we somehow split down the middle and got a "mediocre" season versus either an all-out torchfest or a big snower.
-
the AI envisions a winter where after an early season 2" snowfall we get a -2 inch event to bring the total back down. Same thing at the end of the season lmao

-
It definitely didn't do it right. Take a note of the color code, several 12"+ winters appear in the 0-10 row. Likewise several 5 inch winters intruded into both the 10-20" and 20"+ sections, and the lack of any 30"+ totals in the "delicious" column shows that it's obviously erroneous
-
2026-2027 Record-breaking El Nino
Cobalt replied to Stormchaserchuck1's topic in Weather Forecasting and Discussion
Well yeah, because your generation won't be the one to see the worst consequences of such a temperature jump.