All Activity
- Past hour
-
I’ll sell all those 60s except maybe for NJ. Wednesday could be decent though. Otherwise meh.
-
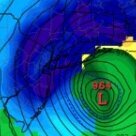
To be fair… none of the cams had that MCS like structure move through middle Tennessee. A couple of the mods had a system like that, but they had the system track more from Northern Arkansas, Southeast through Western Tennessee into northern Mississippi, Alabama. That’s why a slight risk was put out in the area where the mods had the cluster tracking. However, I do believe that looking at the atmospheric conditions of middle Tennessee yesterday afternoon, once those storms fired and it was obvious they were headed toward middle Tennessee, I do agree I think a watch was appropriate for that area. I’m not even sure that a MD was put out just to talk about the system. .
-
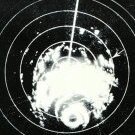
 Surface temps weren’t that impressive 28/29c but OHC was high enough as warm water extended deep. It also reached MPI as the atmospheric environment was exceptional. .
 -
The next ice age is just around the corner geologically speaking…so we enjoy the interlude. All kidding aside..what a gorgeous week. Would love to keep this going right through the spring…
-

2026 Atlantic Hurricane Season
jconsor replied to Stormchaserchuck1's topic in Tropical Headquarters
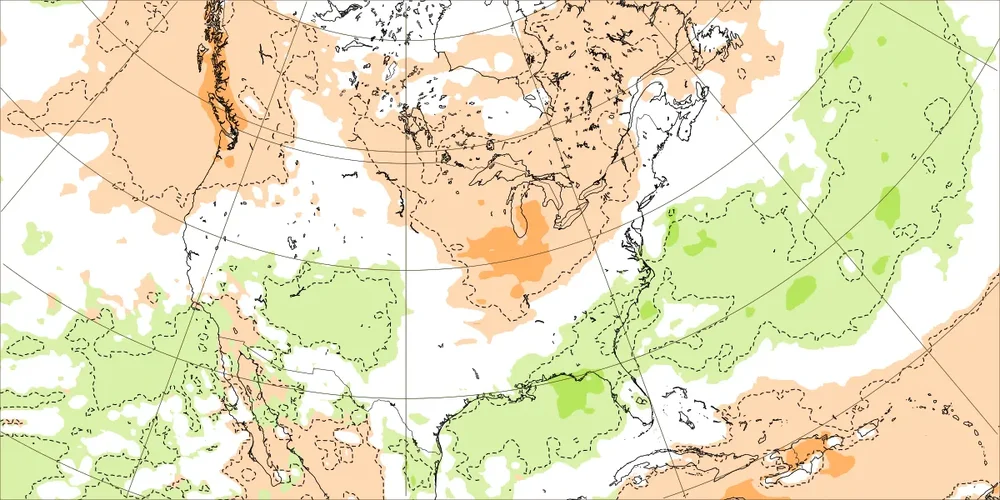
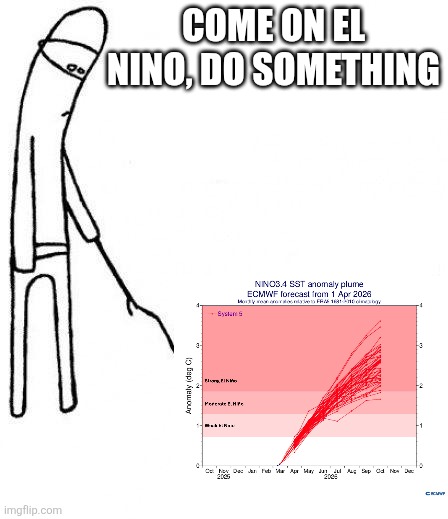
University of Arizona has a bold forecast, much more active than other forecasts to date: 9 hurricanes and 4 majors with an ACE of 155. Their model is based on machine learning initialized with ECMWF seasonal forecast SSTs. They cite forecast significantly above normal tropical Atlantic SSTs as the main factor. News release: https://has.arizona.edu/news/forecast-2026-hurricane-activities-over-north-atlantic More technical summary: https://has.arizona.edu/sites/default/files/2026-04/April-2026-Tropical-Cyclone-Forecast.pdf Seasonal hurricane predictions that have been issued so far: https://seasonalhurricanepredictions.bsc.es/forecast/seasonal-prediction Univ. of Arizona has a very good track record. They started issuing Apr outlooks in 2022. Their Jun forecasts were notably higher than almost all others in 2017, 2019 and 2023 and ended up verifying well (In Jun 2017 they forecast 181 ACE and actual was 225, while most other outlooks were in the 100-130 range). In Jun 2019 they forecast 151 ACE and actual was 132, while most other outlooks were in the 80-105 range. In Apr 2023, they forecast 163 ACE and actual was 148, while most other outlooks were in the 90-130 range). Notice that all 3 years had El Nino conditions at the time of forecast initialization and the Nino was forecast to strengthen - but in 2017 and 2019 that strengthening failed to occur and in 2023 the Nino ended up weaker than many models had forecast and while it limited Atlantic activity to a degree, it was less impactful than expected. In 2022, 2024 and 2025 their Apr outlooks were notably lower than almost all others (In 2022 UA forecast 129 ACE and actual was 96, while almost all other outlooks were in the 150-190 range. In 2024, they forecast 156 ACE and actual was 162, with almost all other outlooks in the 185-230 range. In 2025, they forecast 110 ACE and actual was 133, with most other outlooks in the 145-190 range.) You can download all of the historical hurricane season prediction data for past years from the Univ of Barcelona site linked above. Personally I would go with an ACE range of 80-130 right now. Main reason is I believe the standing wave of low-level westerlies over the eastern Atlantic and west Africa will help lead to an Atlantic Nino, energize the W. African monsoon (WAM) and lead to an active wave train, while as we know El Nino influence on shear is mainly west of 60W. Also, the persistent very warm SST anomalies in the NW Pacific from E of Japan to S of AK and the SW Pacific east of AU/NZ (e.g. negative IPO) along with the above-mentioned Atlantic Nino and African standing wave would likely lead to resistance toward WWBs reaching the eastern Pacific (with the focus remaining near the dateline). This would tend to shift the Walker circulation west of a typical moderate to strong Nino. I think there's a 55% chance RONI stays below strong Nino levels through Aug-Oct. Not ruling out a strong Nino, but I think a super Nino RONI-wise is unlikely (<15%) through Aug-Oct. My main analog years are 1951, 1963, 1969, 2006, 2015, and 2018, with more emphasis on the first three given the strong WAM that prevailed. -
thats the rule of thumb down here too, at least for annuals. I already have some perennials and shrubs in, but I know better than to get annuals yet.
-
A few showers skirted just north of Raleigh this morning.
-
So much for the weeks of doom and gloom we're down to 3 days lol
-
Yep, last nights line looked like it had some promise but did the NYC split. Onshore flow while moist tends to produce misery mist but not much actual precip. .
-
U G H and yuck!
-
it's possible we get a little snow Monday night huh?
- 581 replies
-
- 1
-

-
- april showers bring may..
- rain
- (and 2 more)
-
Suppose to get some sun in the aft and high of 21C/73F - fog and grey again this morning. Guidance shows our crepuscular nightmare ends Sunday with a new wx regime.
-
the new Erie, IL
-
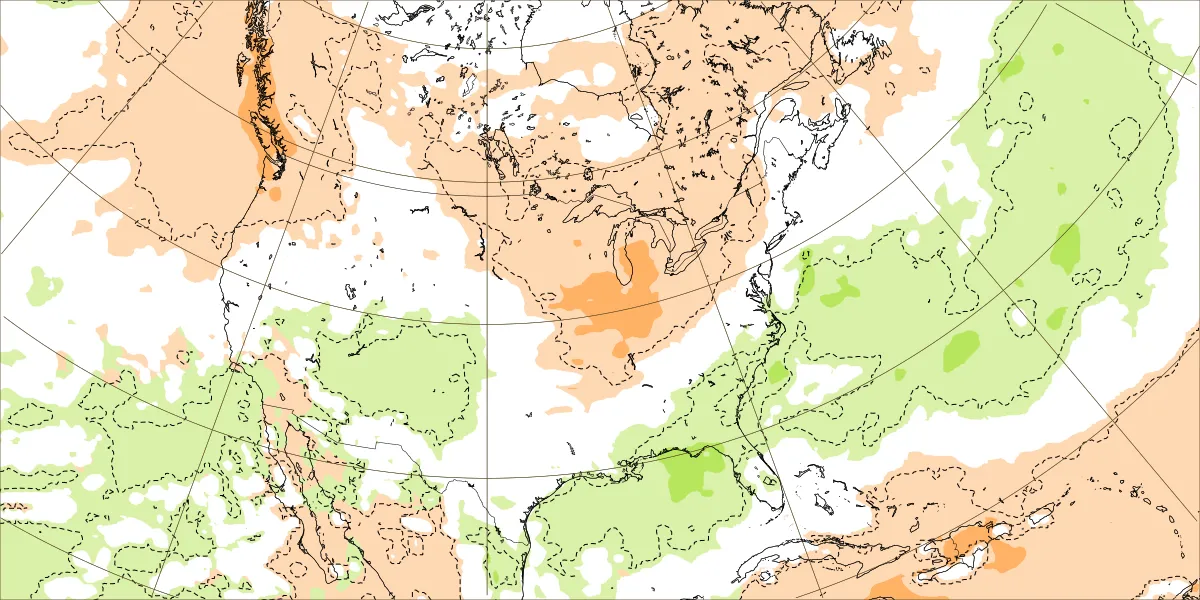
Based on the above maps for Jan, I’m going to consider renting a place in Anniston, AL, just for that month.
-
Personally, I think the modeling may be somewhat too cool for the second half of April, but the ECMWF weeklies show cooler than normal conditions for the April 20-30 period. In addition, a strong cold shot lies ahead for early next week. One or two days will likely to see readings approach or reach 10° below normal. Outside NYC, some areas could experience a late-season freeze. In mathematical terms, one would not need near record cold to reach the figure from the guidance (overnight the guidance ticked up a few tenths of a degree). If one took all the readings to date and assumed that the remainder of the month would average normal, one would come up with a 56.6° mean. Normal for April 17-30 is 56.8°. Since 2020, five years have had a cooler April 17-30. As for 2023, April 1-16 had a mean temperature of 59.9°. That was much warmer than April 1-16, 2026. This year's mean temperature was 56.4°. Finally, the probability is based on a normal distribution. Part of the region under the curve is still below normal at this point in time based on the standard deviation. Although I would be quite shocked were April to wind up cooler than normal overall, that doesn't mean that a statistical probability of such an outcome doesn't exist, even if it's low. The stated probability means that a warmer than normal April is very likely.
-
Went to bed with temps in the mid 70’s. Woke to temps in the low 70’s. Missed out on that broken line of showers last night but did get some decent wind against the back of the house.
-
(002).thumb.png.6e3d9d46bca5fe41aab7a74871dd8af8.png)
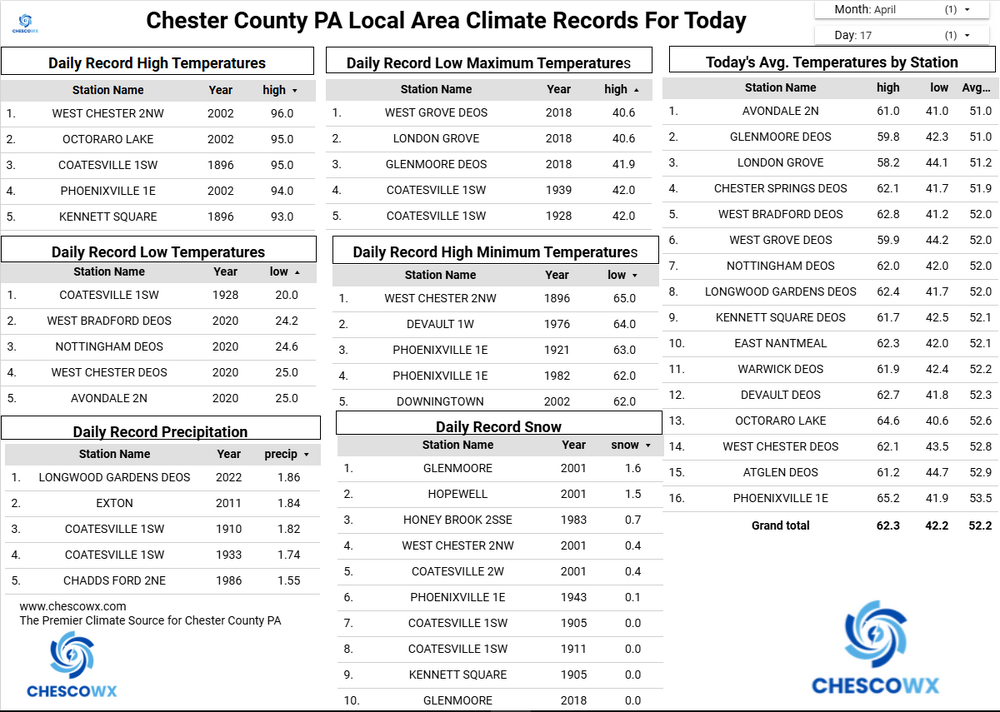
Central PA Spring 2026 Discussion/Obs Thread
ChescoWx replied to Voyager's topic in Upstate New York/Pennsylvania
The Devault DEOS station recorded a high of 90.7 yesterday this is the first 90 degree reading at any County station so far this year. None of the other stations reached 90 but upper 80's were common across the valley locations. Today should be 10 to 12 degrees cooler with highs in the mid to upper 70's. This is still 10+ degrees above normal levels. We chill well below normal by Sunday with highs remaining in the low to mid 50's with shower chances increasing. A freeze remains a possibility by Tuesday morning.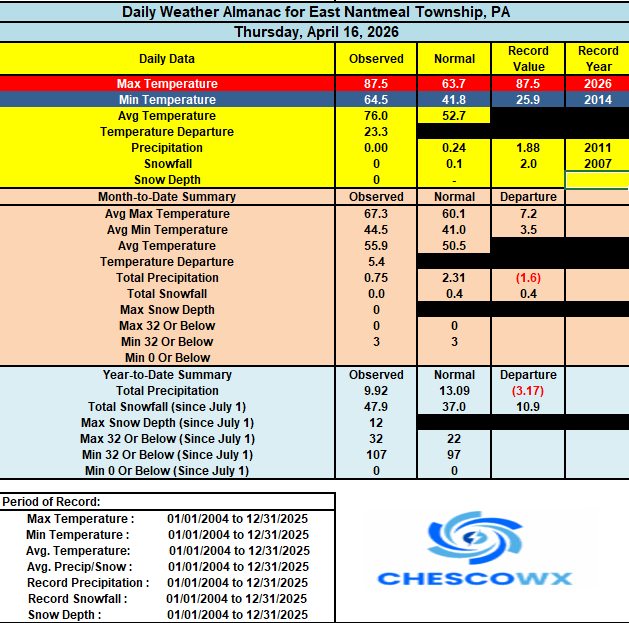
-
I’m targeting November for the change to consistently wetter than normal in much of the SE, which is typical for strong El Niño autumns. Until then lots of watering is anticipated during dry periods. But good news is that for well before then, the model consensus is showing a pattern change to wetter than normal in ~10 days down and going into early May in my general area, where the drought is the worst in the SE. Fingers crossed that from then through Oct will be closer to normal. Latest Euro Weeklies for Apr 27-May 3:
-
E PA/NJ/DE Spring 2026 Obs/Discussion
ChescoWx replied to PhiEaglesfan712's topic in Philadelphia Region
The Devault DEOS station recorded a high of 90.7 yesterday this is the first 90 degree reading at any County station so far this year. None of the other stations reached 90 but upper 80's were common across the valley locations. Today should be 10 to 12 degrees cooler with highs in the mid to upper 70's. This is still 10+ degrees above normal levels. We chill well below normal by Sunday with highs remaining in the low to mid 50's with shower chances increasing. A freeze remains a possibility by Tuesday morning.
-
-
2026 Spring/Summer Mountain Thread
Maggie Valley Steve replied to Buckethead's topic in Southeastern States
I got enough rain to wash down the pollen! 53 this morning. -
Bone dry here. no significant precip (a couple hundreths here and there) since the 5th/6th. Wind gets above 25 and we've got mini dust storms out here. Pretty crazy. Feels like a desert island. I've got grass that took off thats showing brown because its dry. Hopefully some relief overnight. Timing of these systems lately just suck. By the time they get here we're into overnight hours and lose all forcing. Had one setup (Sweetster hail) where storms trained N and S missing us completely. I could watch both lines from my porch as outflow winds blew through making small dustnado's. My well level is about 4ft below normal. I'm really getting fascinated by micro climates and if theres trends in certain small areas and if there are, what could be the causes. My current problem is not uncommon for this area. We shall see
-
First measurable in 11 days here (a whopping 0.03") fell just before midnight. High was 85.0, not near the record of 90 (and that is the earliest 90 here) from 2002.
-
I'm confused as to why a Severe Thunderstorm Watch wasn't issued for parts of Middle Tennessee last night. We had plenty of warnings west of town last night and trees/power lines down throughout Dickson County (among others). IMHO, a watch should have been set based on ground truth coming out of Kentucky. I know SPC works with the local offices on these things. Certainly, OHX did their job on the warning side. I'm sure pro mets can speak to this better than I could, but either way, I got to think it's not a great look when you have warnings plastered on a RVA grid without the watch backdrop.
-
Yeah. Tomorrow looks pretty nice as well. Even Upton says it short lived. "The cooler regime appears short-lived, with gradual moderation returning conditions to above normal by midweek."
.thumb.png.f41d68de52c5ef27fddfa462b2c37266.png)
.jpg.3be403176790c4e2a355a5fdd4646248.jpg)


.png.c87473893c7c918d039cef4b6cfce1d9.png)