All Activity
- Past hour
-
2.14" so far at CEF.
-

Augdewst 2026: Summer's Last Stand
dendrite replied to Prismshine Productions's topic in New England
Is there a badge for filling them? -

Augdewst 2026: Summer's Last Stand
CoastalWx replied to Prismshine Productions's topic in New England
Hopefully Ginxy is there with sandbags for them. -
Augdewst 2026: Summer's Last Stand
CoastalWx replied to Prismshine Productions's topic in New England
Pouring now but best stuff a few miles NW. -

Augdewst 2026: Summer's Last Stand
HIPPYVALLEY replied to Prismshine Productions's topic in New England
Some sun breaking through here. -
-
About 2.3” now and more coming in. Will probably break 3”.
-

E PA/NJ/DE Summer 2026 Obs/Discussion
Hurricane Agnes replied to PhiEaglesfan712's topic in Philadelphia Region
Looks like the Wissahickon hit bankfull. -
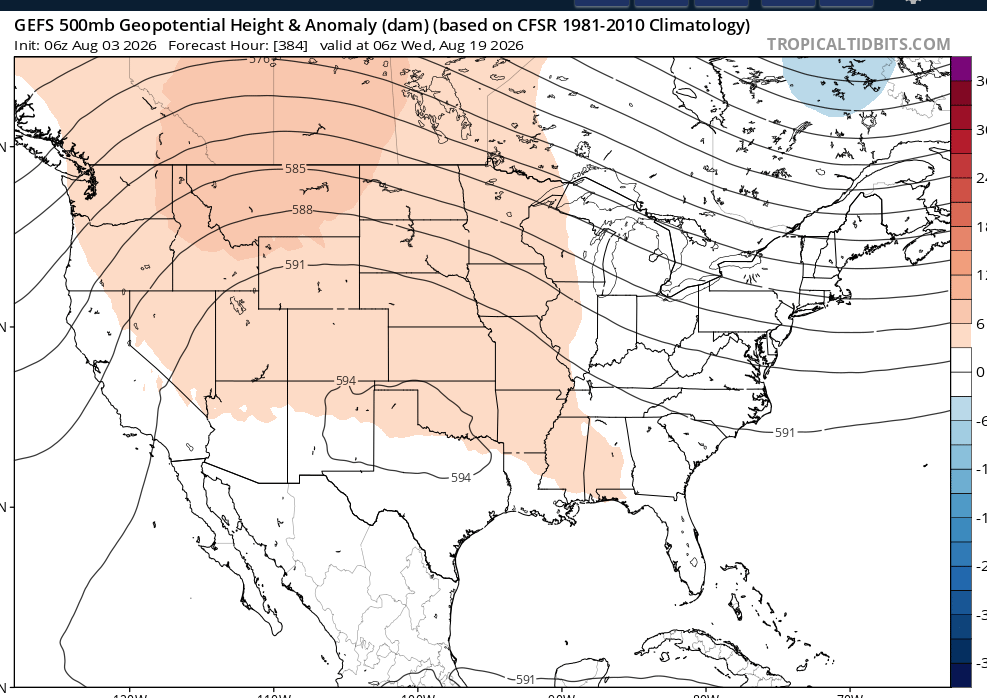
What do you make of this? Notice a tight range for multiple months. Also of note is a deep - NAO now and a rapidly climbing PNA
-

Augdewst 2026: Summer's Last Stand
Damage In Tolland replied to Prismshine Productions's topic in New England
Another 4-6” for Yawgoog Boy Scout camp? -
Augdewst 2026: Summer's Last Stand
CoastalWx replied to Prismshine Productions's topic in New England
Windy here. Definitely gusting over 30 from the south. -

Central PA Summer 2026 Discussion/Obs Thread
mahantango#1 replied to Voyager's topic in Upstate New York/Pennsylvania
US National Weather Service State College PA The forecast has trended in a very good direction for today and tomorrow! We're still expecting a warmer/wetter pattern for the second half of the week into the weekend. -
Augdewst 2026: Summer's Last Stand
CoastalWx replied to Prismshine Productions's topic in New England
Yeah they’ll be soaked. -

Augdewst 2026: Summer's Last Stand
Sey-Mour Snow replied to Prismshine Productions's topic in New England
Ya I’m banking on the next 2 batches to catch up SE areas. -
Through 9 am, JFK Airport has received 2.05" of rain. That breaks the old record of 1.90" from 1948.
-
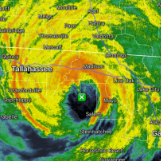
 Its crazy inner dynamics of scything through its own eye at 10z to work out dry air I guess but that lobe got absorbed back into the eye anyways! Deep convection rebuilding around the careworn eye now and slightly larger.
 -

Augdewst 2026: Summer's Last Stand
HoarfrostHubb replied to Prismshine Productions's topic in New England
Oh, there will be precip. Just in liquid form -

Augdewst 2026: Summer's Last Stand
ineedsnow replied to Prismshine Productions's topic in New England
Pretty meh but my video of flooding at Mount Wachusett -
Augdewst 2026: Summer's Last Stand
CoastalWx replied to Prismshine Productions's topic in New England
Yep. Congrats. That earlier stuff laying a boundary just south of you and you’ll see that stuff ride up and over. Can already see that in SE CT. -
Augdewst 2026: Summer's Last Stand
Damage In Tolland replied to Prismshine Productions's topic in New England
Narrow area from S and W CT up to Dendy. Very narrow zone SW to NE of big totals . Unless this next batch floods SE CT and RI -
let it ride
-
Augdewst 2026: Summer's Last Stand
WxWatcher007 replied to Prismshine Productions's topic in New England
.84” -

Augdewst 2026: Summer's Last Stand
SJonesWX replied to Prismshine Productions's topic in New England
that's crazy, I'm just west of MHT, what maybe 20 miles from Hashua? and I have <1.5" -

Augdewst 2026: Summer's Last Stand
TauntonBlizzard2013 replied to Prismshine Productions's topic in New England
Really? Looks like we’re about to step between the two heavy batches right now. Best is up near Boston and south of here -
Flash flood warning in the city was extended from 0845 to 1045. Looks like we'll be hit by that line building in central NJ and moving NE through the city. 1.09" for me so far. There were two rounds of torrential downpours around 0245 and 0730 and steady rain from 0430-0730.