

so_whats_happening
-
Posts
1,350 -
Joined
-
Last visited


-
2025-2026 ENSO
so_whats_happening replied to 40/70 Benchmark's topic in Weather Forecasting and Discussion
For as strong as the SPV was last year there was very little connection at times to the TPV throughout the winter otherwise we would have progressed volume wise fairly similarly to the early 2020's.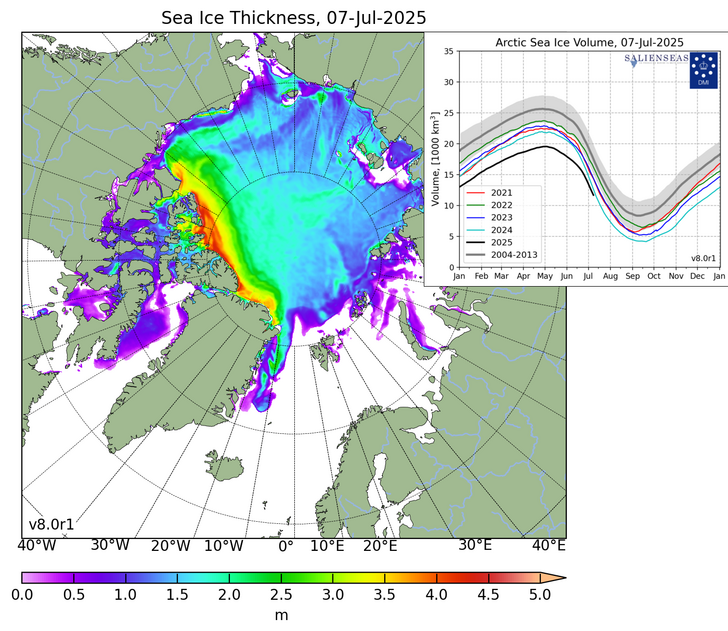
-
2025-2026 ENSO
so_whats_happening replied to 40/70 Benchmark's topic in Weather Forecasting and Discussion
This would have been a solid sea ice retention year the way things have progressed so far but we are starting at such a low point unfortunately you will continue to be well below normal even in the best of times. I think if the pattern holds we should escape some of the lowest values recorded but not a good situation continues to get worse. Look at where we are volume wise compared to the last few years, which have shown some of the lowest values outside of 2007/12
-
2025-2026 ENSO
so_whats_happening replied to 40/70 Benchmark's topic in Weather Forecasting and Discussion
It really has been interesting to follow more closely over the last 5 years how things have progressed. Im not ready to say the ITCZ is further north permanently or to be so going forward due to the warmer subtropics, as we had discussed about last season. It is noticeable of a change in overall TC behavior and numbers have changed a lot over the basins over the last half century or more. Colorado State keeps a pretty solid track of key things over each basin. https://tropical.atmos.colostate.edu/Realtime/index.php?arch&loc=northwestpacific The bolded has pretty been the most notable change we have seen associated with the changing of climate. I would like to make a similar timeframe for ENSO and PDO to each basin to see how years were effected more so than others. -
2025-2026 ENSO
so_whats_happening replied to 40/70 Benchmark's topic in Weather Forecasting and Discussion
Just hope we can keep it going. -
2025-2026 ENSO
so_whats_happening replied to 40/70 Benchmark's topic in Weather Forecasting and Discussion
Training thunderstorms getting us good at home (Lancaster) second above average month so far but still down about 5" on the year. @Stormchaserchuck1 -
July DCA _ NYC _ BOS ___ ORD _ ATL _ IAH ___ DEN _ PHX _ SEA + 1.5 +1.6 +2.1 +1.8 +0.8 +0.4 +.2 +.9 +2 May change a little later but Ill make a note if it does. Edit: Only raised up SEA
-
2025-2026 ENSO
so_whats_happening replied to 40/70 Benchmark's topic in Weather Forecasting and Discussion
No worries here is the other site I used for the in comparison years. https://solen.info/solar/index.html Im sure I have more elsewhere in my bookmarks but there are a lot of saved bookmarks to go through lol -
2025-2026 ENSO
so_whats_happening replied to 40/70 Benchmark's topic in Weather Forecasting and Discussion
I wonder though if we put this with data about hurricanes either globally or solely the Atlantic if we can see some interesting trends come about. -
2025-2026 ENSO
so_whats_happening replied to 40/70 Benchmark's topic in Weather Forecasting and Discussion
Maybe for the bolded but we also just saw an extended La Nina like pattern emerge at the start of this cycle. Numbers and intensity though are two different things. We had some rather intense flares occur over the last year but numbers overall seemed to be about on par with what is near the 'average' amount based on the number of cycles we have seen. Cycle 24 started off as an El Nino and in fact had a strong Nino at that followed by another significant one just after peak. Cycle 23 also started off in an El Nino quickly to La Nina and then a moderate Nino just after peak (2002-03) so im not sure there is too much correlation going on there. Cycle 23 was double that of 24. https://www.swpc.noaa.gov/products/solar-cycle-progression I mean if we extended this all the way to 1750 we would actually be seeing while this year was active the overall numbers are still in a decline mode over the 50+ years. Wonder if start to see it trend up in the upcoming cycles? -
2025-2026 ENSO
so_whats_happening replied to 40/70 Benchmark's topic in Weather Forecasting and Discussion
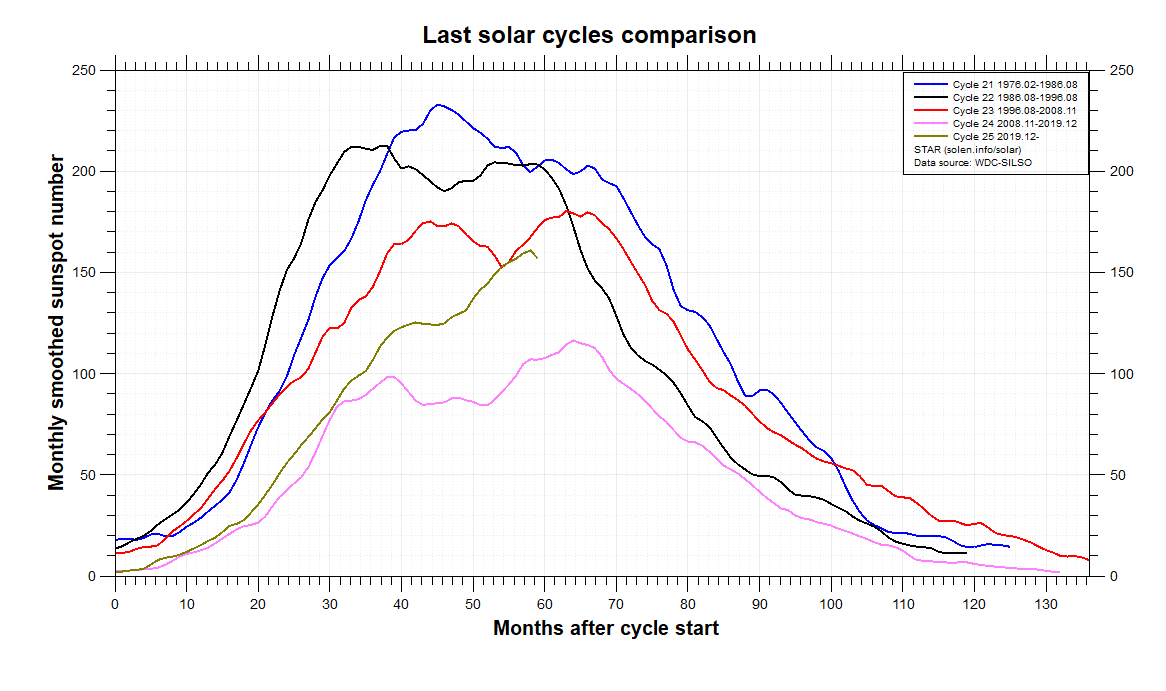
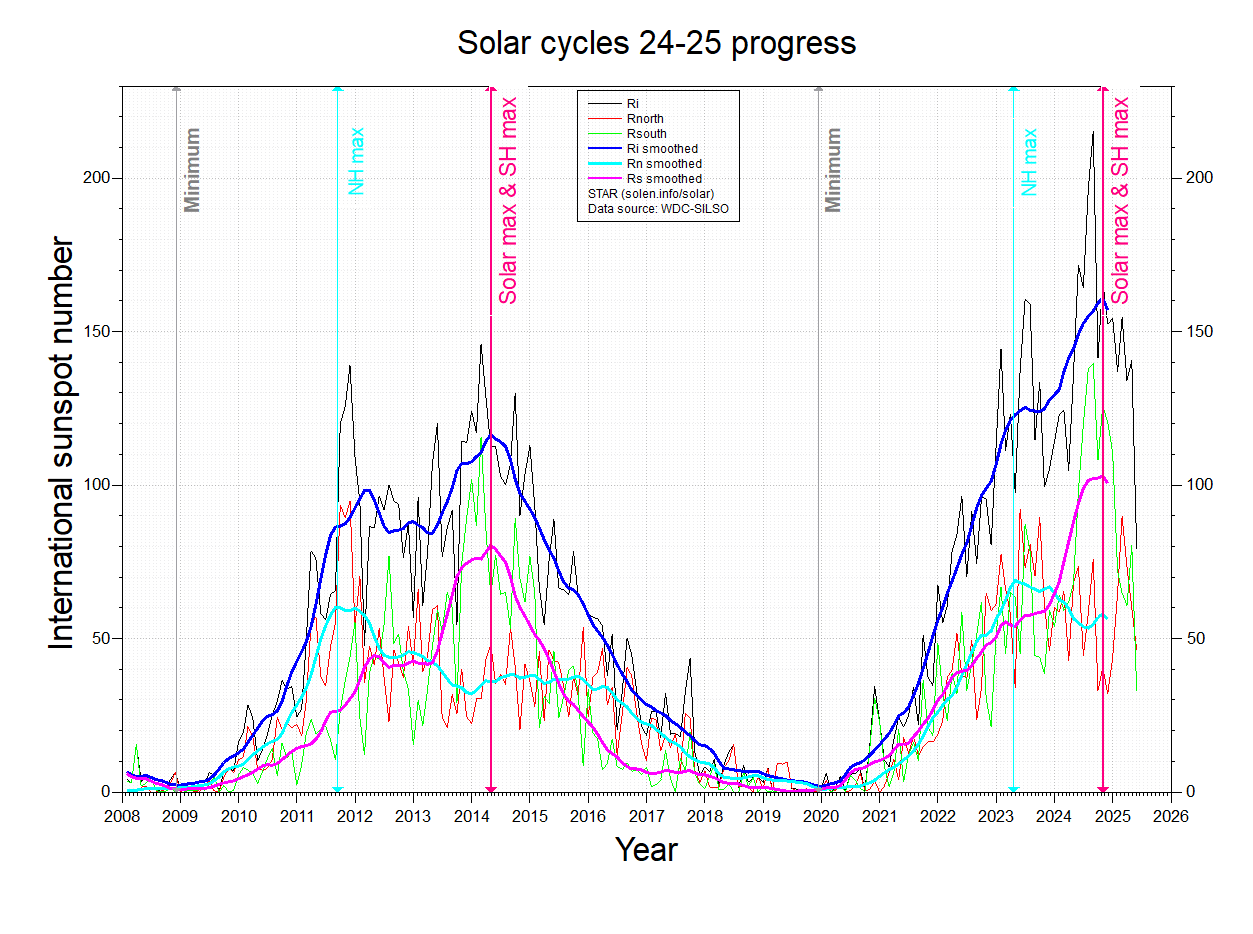
Yea Im thinking we try 26-27 not sure on intensity but that can be determined. Here is how this cycle compares to the last few. We may be trying to go to a more active cycle in terms of sunspots since we hit our low in the prior.
-
2025-2026 ENSO
so_whats_happening replied to 40/70 Benchmark's topic in Weather Forecasting and Discussion
Definitely was an impressive cycle looks like we are dropping off pretty decent over the last few months.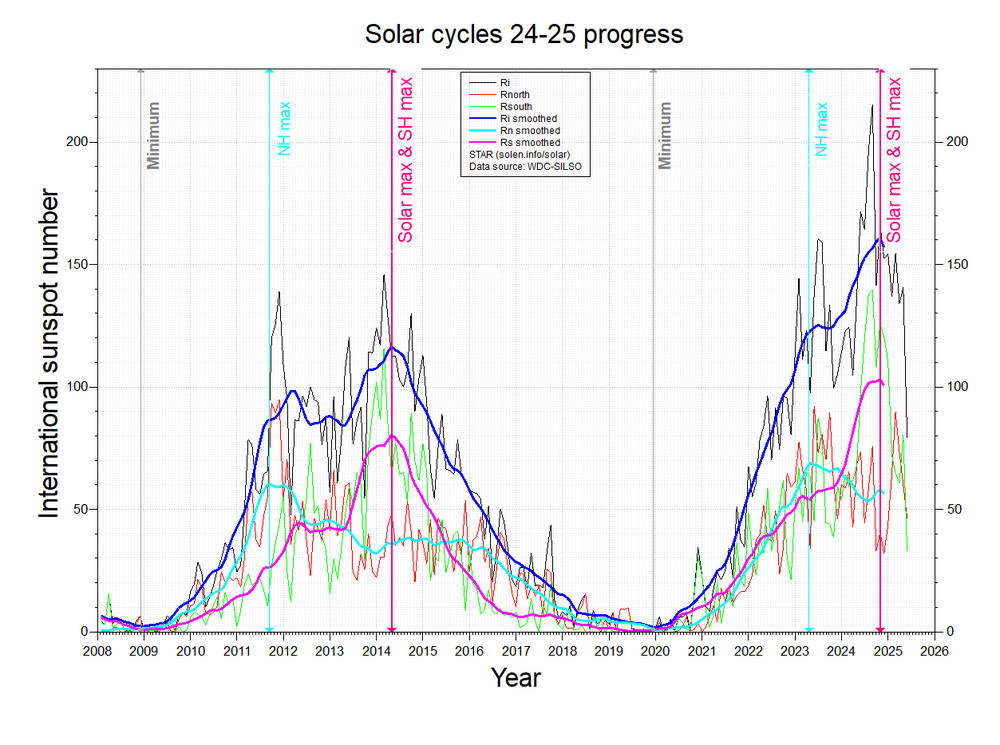
-
2025-2026 ENSO
so_whats_happening replied to 40/70 Benchmark's topic in Weather Forecasting and Discussion
Since the water year we are still about 4-7" below average. It has only been May that has shown to be above average thus far, decently so at that. April was close but it stuck right along the 95 corridor that managed slightly above average around philly. June has been a bit of a struggle but we need the thunderstorms as we close out the month to produce about 1.5" across the area (PA and northern MD) then we should hit average and maybe slightly above but we have a ways to go before we can say the drought has been knocked out. If we manage near average the next few months we still end up below average for the water year only a tropical system will bring us closer to average or cutoff lows reigning supreme come fall. -
2025-2026 ENSO
so_whats_happening replied to 40/70 Benchmark's topic in Weather Forecasting and Discussion
It is just gross outside 93/76 should hit 98 today and 99 tomorrow..thumb.gif.f6aeb2b4087c9963a1439e5d8af523f9.gif)
-
2025-2026 ENSO
so_whats_happening replied to 40/70 Benchmark's topic in Weather Forecasting and Discussion
Sure just feel he likes to make sure his ducks are in order. No harm no foul. The WPAC is still warm but not excessively warm as it was so chipping away at it slowly is the name of the game. I would be interested to see if the WPAC starts to fire off any tropical systems coming up here with what could be a minor WWB coming up like we saw earlier this month still no typhoon but at least things are trying to get going. -
2025-2026 ENSO
so_whats_happening replied to 40/70 Benchmark's topic in Weather Forecasting and Discussion
Yea there may be a random spot or two that get to 100 at least being shown right now but looks to be potentially our first official heat wave of the season, still a week+ out though so who knows. I will take this lack of heat when I can get it have not had to turn on the AC yet as we have been able to cool down at night properly. May was our first month above average rainfall wise around here in awhile the last time it happened was August of last year and the only reason was because of Debby had that not happened we probably would have gone almost 12+ months below average.


.gif.110af1123d5624989530b0e860e288f1.gif)