All Activity
- Past hour
-
3.65
-
E PA/NJ/DE Summer 2026 Obs/Discussion
BBasile replied to PhiEaglesfan712's topic in Philadelphia Region
Doing a little better this morning. Up to 0.6" now. -
Yesterday’s 91 cinched the 4 week mark for PHL. Thirty is the average number in a given summer for Philadelphia. I am surprised the Franklin Institute does not have a higher number than 28 given that it’s smack dab in the middle of Center City.
-

Augdewst 2026: Summer's Last Stand
Brian5671 replied to Prismshine Productions's topic in New England
it's as far north as philly-that won't miss us -

Augdewst 2026: Summer's Last Stand
Sey-Mour Snow replied to Prismshine Productions's topic in New England
Stuff to the SW starting to blossom again -
Augdewst 2026: Summer's Last Stand
Brian5671 replied to Prismshine Productions's topic in New England
looks wet going forward too... -

Augdewst 2026: Summer's Last Stand
SouthCoastMA replied to Prismshine Productions's topic in New England
0.04" -

Augdewst 2026: Summer's Last Stand
Ginx snewx replied to Prismshine Productions's topic in New England
August 55? -

Augdewst 2026: Summer's Last Stand
dendrite replied to Prismshine Productions's topic in New England
Many were pegged this morning. -
Augdewst 2026: Summer's Last Stand
Brian5671 replied to Prismshine Productions's topic in New England
close to 20 inches of rain here in the last 30 days or so and no tropical storm/hurricane influence -
Another solid soaking overnight into earlier this morning. Received 1.92" along with vivid lightning and some loud thunder. Getting too wet at this point. Need to turn these firehose events off for a while. Too much of a good thing.
-

Augdewst 2026: Summer's Last Stand
CoastalWx replied to Prismshine Productions's topic in New England
Models kept pegging areas of 2-5”+ in the jack zones. I thought it seemed modeled fairly well. -
Augdewst 2026: Summer's Last Stand
Ginx snewx replied to Prismshine Productions's topic in New England
Yes you nailed it. Tip o Cap -
Augdewst 2026: Summer's Last Stand
Ginx snewx replied to Prismshine Productions's topic in New England
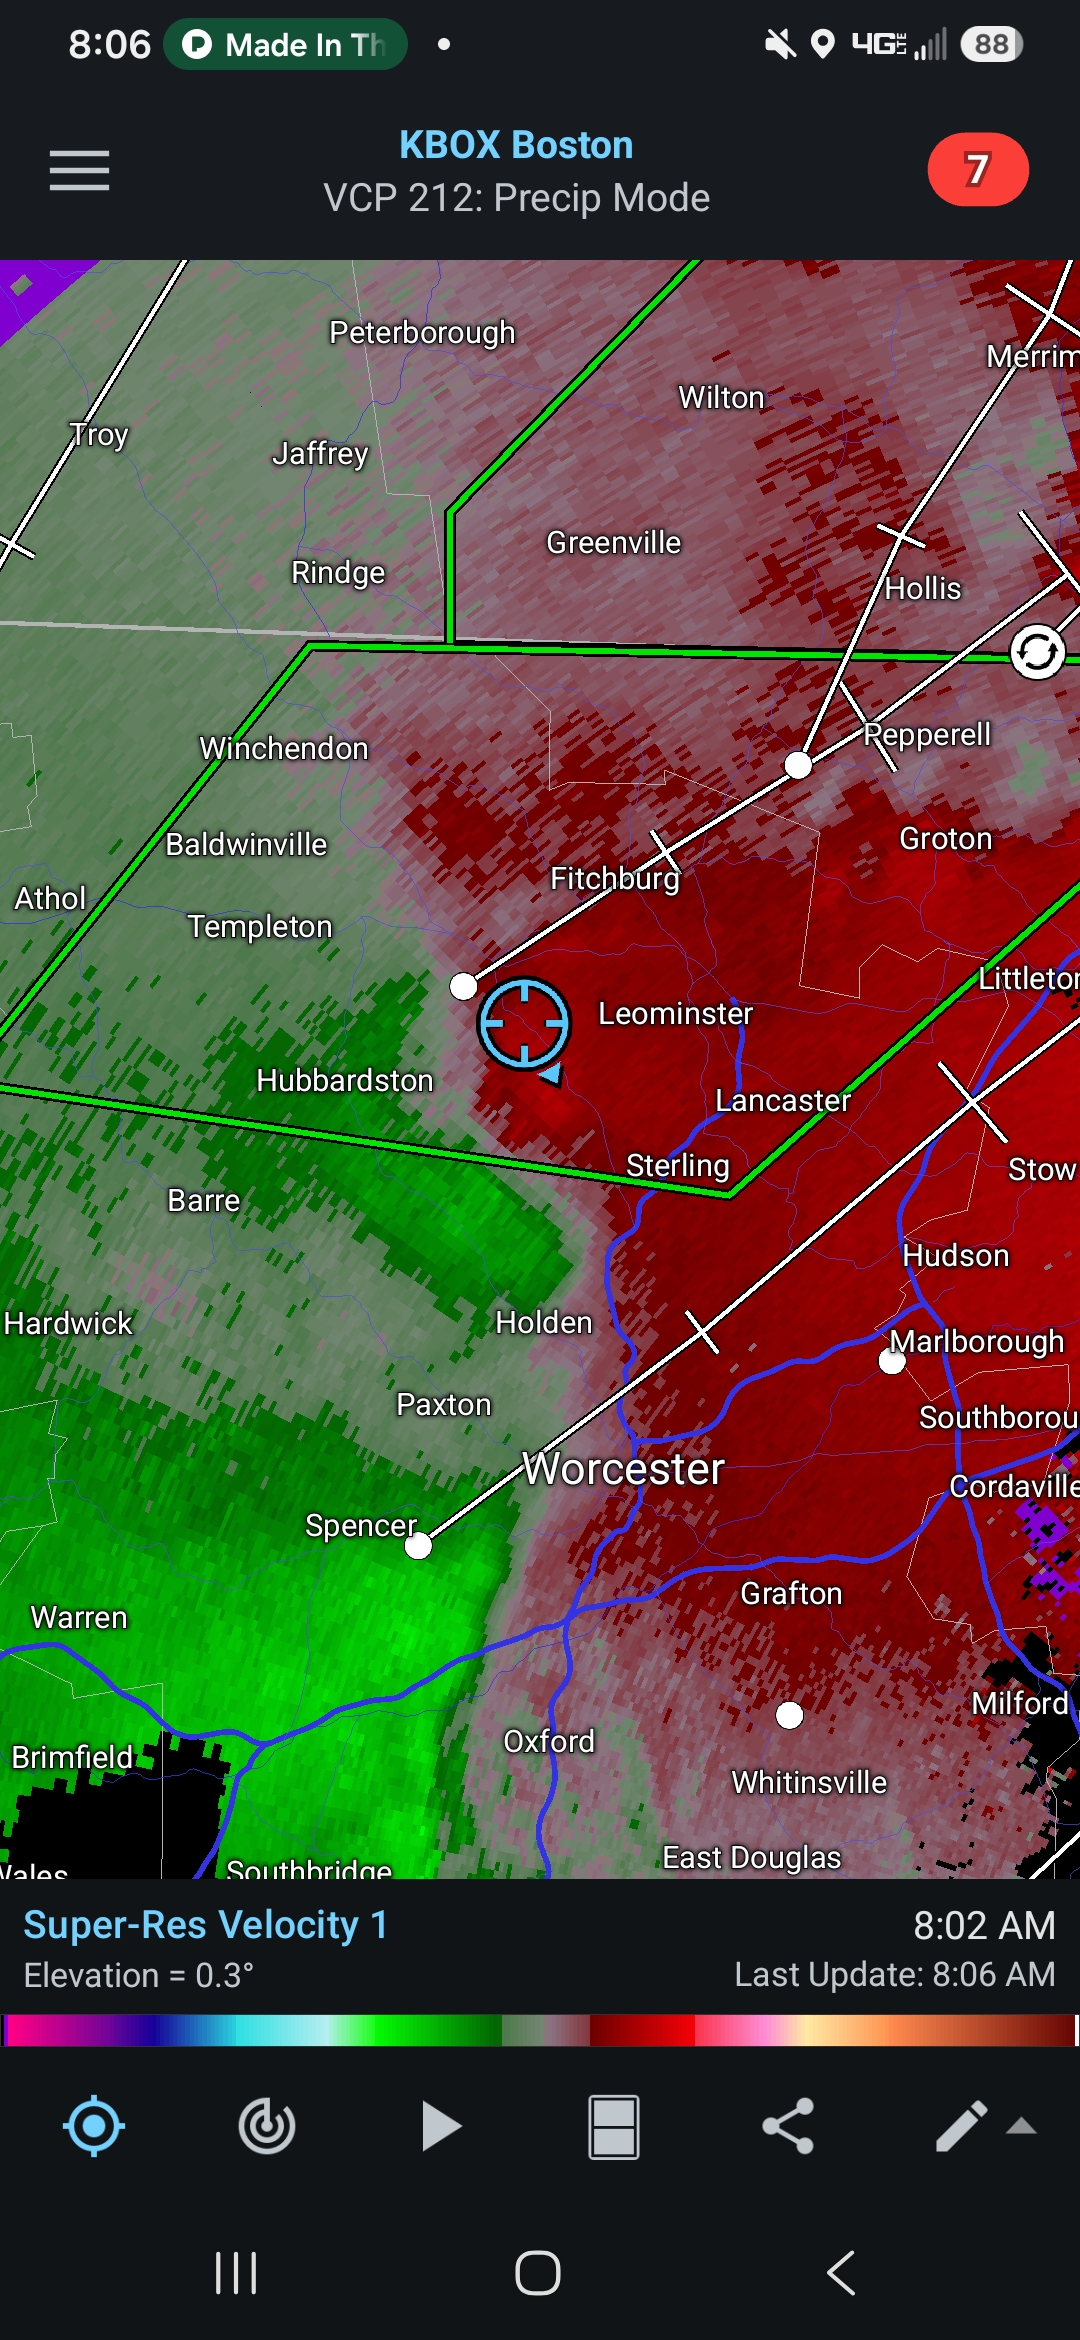
Both here right now with wind -

Augdewst 2026: Summer's Last Stand
weatherwiz replied to Prismshine Productions's topic in New England
Some knew -

Augdewst 2026: Summer's Last Stand
ineedsnow replied to Prismshine Productions's topic in New England
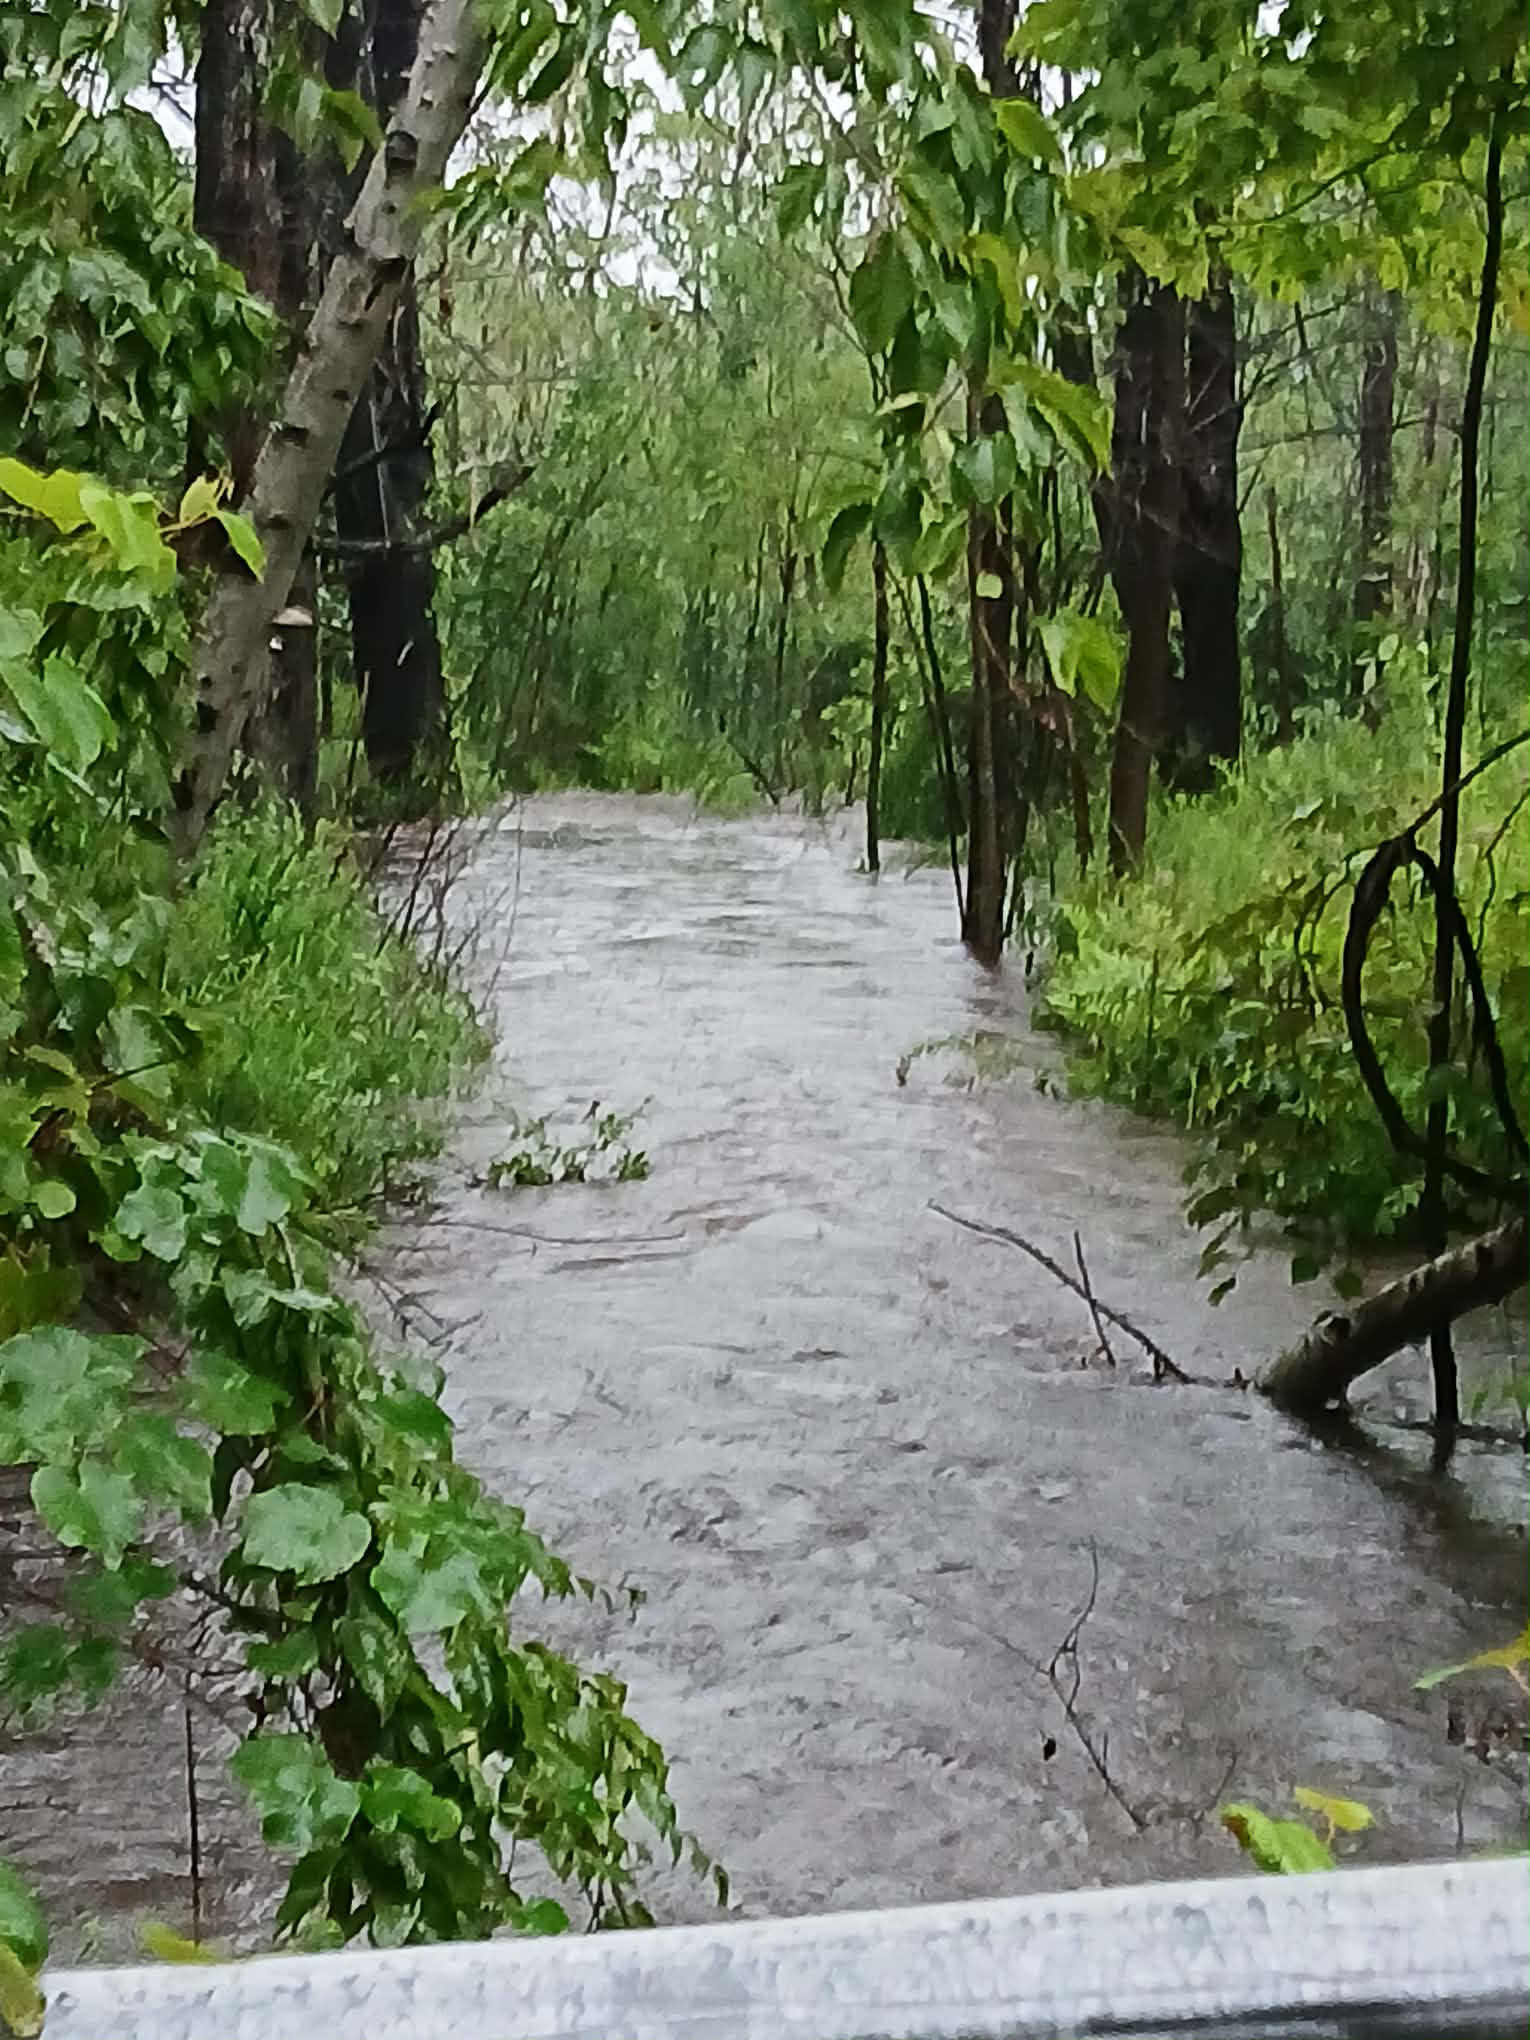
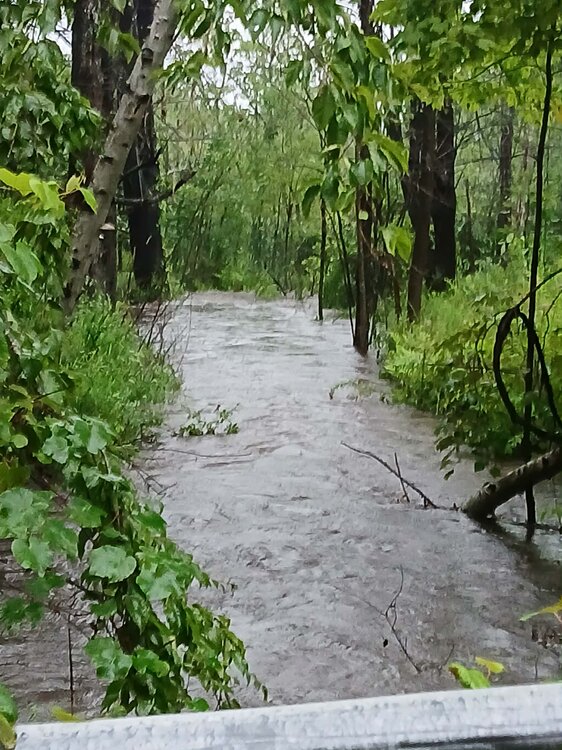
I was hoping for a quick spin up but nothing but torrential rain.and some wind.. started driving back and stopped at wachusett.. stream by the entrance is overflowing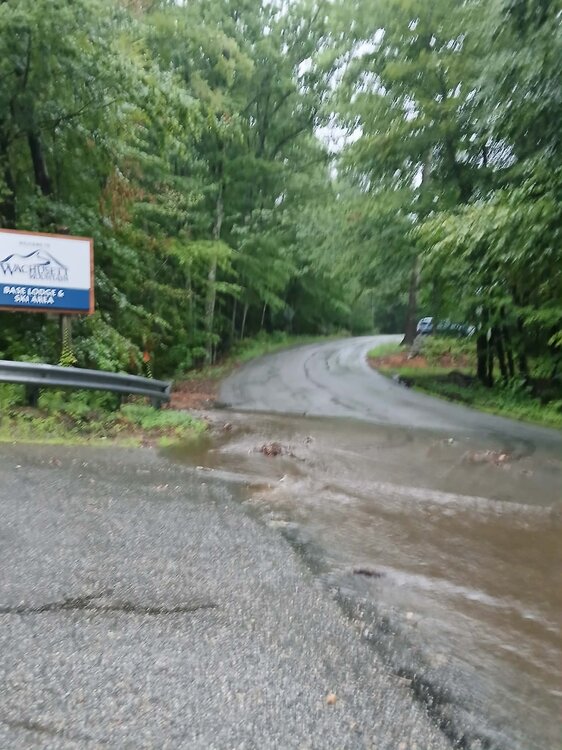
-
Augdewst 2026: Summer's Last Stand
Ginx snewx replied to Prismshine Productions's topic in New England
Dumping -
Augdewst 2026: Summer's Last Stand
CoastalWx replied to Prismshine Productions's topic in New England
Congrats oh yee of 3 wives on FFW next town over. -

Augdewst 2026: Summer's Last Stand
Chrisrotary12 replied to Prismshine Productions's topic in New England
Can’t wait for @512high next report. -
Newark has now received 1.67" of rain today. That breaks the August 3 daily record of 1.60" from 1885. As was the case with the most recent large rain event, the White Plains precipitation gauge is down. Although the data shows 0.04" on July 29 and 0.02" on July 30, those figures understate the actual figures, as the gauge was down for large stretches of rain.
-
Augdewst 2026: Summer's Last Stand
dendrite replied to Prismshine Productions's topic in New England
Raining again here. I’m satiated. Let’s keep the rest for CT so they can become a rainforest by March. -

Augdewst 2026: Summer's Last Stand
butterfish55 replied to Prismshine Productions's topic in New England
Working in Hyannis today. Lots of sun and blue skies approaching the bridges. Very breezy, feels like florida. -
Augdewst 2026: Summer's Last Stand
Chrisrotary12 replied to Prismshine Productions's topic in New England
Flash flooding warning alert made the whole family jump. -

E PA/NJ/DE Summer 2026 Obs/Discussion
Hurricane Agnes replied to PhiEaglesfan712's topic in Philadelphia Region
Round2 has intensified and has me up to over 1"/hr along with a thunderstorm. Have 1.33" in the bucket .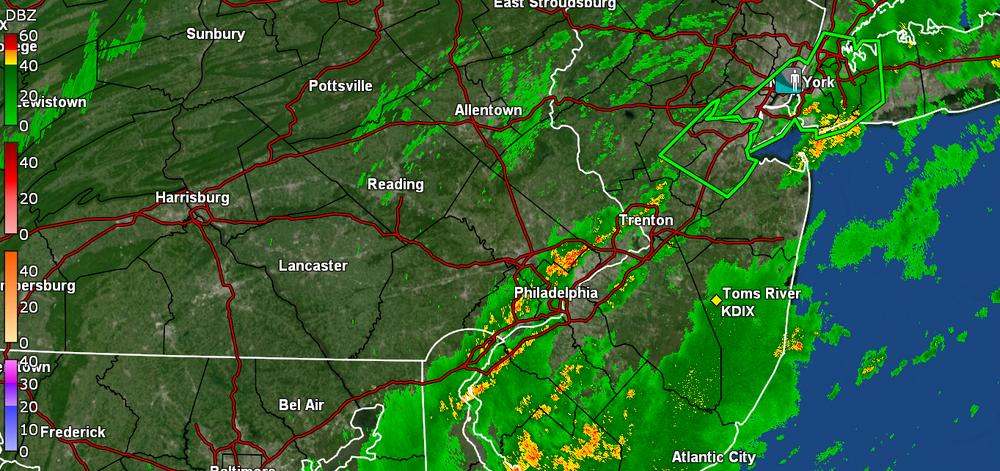
-
Augdewst 2026: Summer's Last Stand
CoastalWx replied to Prismshine Productions's topic in New England
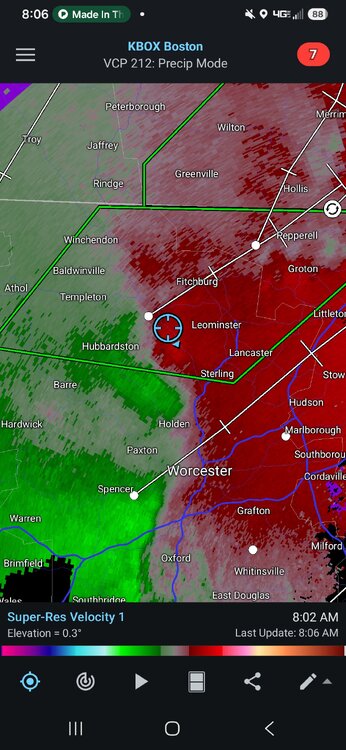
May have to watch SE CT and RI later if the Delmarva stuff gains ground. You can see the 850LLJ is ramping up. The rain seems to be on the western edge of it which makes sense because there would be convergence there. Pretty breezy here locally. FL vibe.