All Activity
- Past hour
-
It's so damn soupy out there again today
-
The rain split my area and may or may not redevelop I guess. At this point, guessing is working as well as the models.
-
This line of heavy rain moving south from Northern NJ into Middlesex County is moving slowly and should produce an inch or 2 of rain in some places and wouldn't be surprised if there is more flooding in the usual areas prone to it. No wind thunder etc yet temp dropped from 83 to 69
-
Posted up in Columbia for the day and night, remaining vigilant
-
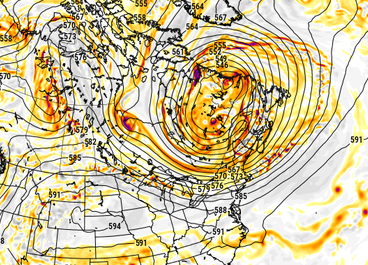
 question is ... how much of this survives an over-the-top delivery before the flow collapses into and around that autumn pattern later next week... Never seen sub 545 dm SPV over N Quebec, doing so in mid/late July nearing the perennial hottest time of the climate year, but the GFS is just getting more and more absurd ... not backing off, as we get closer. This 120 hours... uuuusally when the amplitude starts to normalize. We'll see tomorrow but jesus christ with this beast! Euro's 10 or so dm shallower but still depicting the highly anomalous SPV, too. It's not just that ... the west-NW Euro heat wave and associated ridging is paradoxical to that. The teleconnector correlations are in anti. kind of fascinating... It appears that what's going on is a very powerful -NAO, perhaps record breaking for summer ... **but** because it is situated so far E some of it's mass is lapsed outside the NAO domain space, so when calculating the EOFs ... we're missing something. Only getting these -1.5 type SD numerology from the agencies that calculate it. Meanwhile, this trough you see over eastern Canada is actually part of the same large scale wave structure - in and of itself highly unusual for summer months. These features are just exotically amplified overall. what the f chuck! part of my wild imagination is that the models are just expressing some sort of desperate attempt at budgeting/explaining CC on some level. Because... if it were as hot in Europe, to then shallow that trough over eastern Canada, they'd have to go ahead and admit we're at the 1.5C threshold now. ha.
-
(002).thumb.png.6e3d9d46bca5fe41aab7a74871dd8af8.png) Not sure where you are getting this assertion or I guess it may be a feeling... that "the average of Phoenixville, Coatesville and West Chester is as warm as PHL airport in the early 1940's. So let's as I always do go to the actual data for the Chester County stations vs the PHL Airport and the 2 stations relatively close to PHL prior to the temperature being recorded at the airport in 1941. Over the 25 years we are focusing on 1927-1951 the raw average temperature data of those 3 Chester County stations was always colder in each and every year!! So sorry Charlie the average is most certainly not as warm at all. In fact Chesco in those years is running as cold as much as 4 degree colder than the PHL stations. With during the entire period the average running between 1.1 and 2.5 degrees colder. We can now put to bed this false claim that Chesco was running as warm as the PHL airport area from 1927-1951
Not sure where you are getting this assertion or I guess it may be a feeling... that "the average of Phoenixville, Coatesville and West Chester is as warm as PHL airport in the early 1940's. So let's as I always do go to the actual data for the Chester County stations vs the PHL Airport and the 2 stations relatively close to PHL prior to the temperature being recorded at the airport in 1941. Over the 25 years we are focusing on 1927-1951 the raw average temperature data of those 3 Chester County stations was always colder in each and every year!! So sorry Charlie the average is most certainly not as warm at all. In fact Chesco in those years is running as cold as much as 4 degree colder than the PHL stations. With during the entire period the average running between 1.1 and 2.5 degrees colder. We can now put to bed this false claim that Chesco was running as warm as the PHL airport area from 1927-1951
-
 Can’t spell Stein without SNE.
 -
Coming down in buckets.
-
A line dropping down from the north. About to pour here.
-
Wonder if those two boundaries over Montgomery/Howard will do anything today?
-

Spring 2026 Pattern Discussion Thread
Carvers Gap replied to Carvers Gap's topic in Tennessee Valley
Rain and humidity. Sure seems like the Nino pattern is starting to show its hand.- 343 replies
-
- 1
-

-
- severe
- mountain snow
- (and 1 more)
-
Some high end heat possible Wed. GFS has the city hitting 100, 850 temps around 22C and WNW winds. That's usually been the recipe to rocket our temps in the city/coast.
-
 So first N NE and then the Mid Atlantic a few days later with great SVR potential. Just great
 -
 No trees left in the Greens Mountain's?
 -
Stein here and derecho there.
-
Wagons north for this potential
-

Occasional Thoughts on Climate Change
donsutherland1 replied to donsutherland1's topic in Climate Change
The article doesn't really debunk the basis for concern about ongoing warming. In the U.S., the 1930s provided a glimpse of what aridification would be like from the combination of a series of exceptional droughts and poor agricultural practices. Now, with rising temperatures, the Dust Bowl Era extremes are gradually being replaced. Now, let's go to the article. If the climate were relatively stable, one should see a similar tendency with cold and hot extremes. At longer timeframes, one should also see both diminishing. Key excerpts from the article: Regarding Cold Extremes: The incidence of daily TMin records has declined in all regions with the lowest CONUS value of 5.3 occurring in 1998–2012 then ending in 2025 at only 7.9 per station per 15-yrs. This represents a drop of over half from the pre-1997 15-yr values. The relative coherence of the separate regions is also notable with very little variation from the CONUS average in the past 30 years... The event of Feb 1899 is clearly evident as the most extreme event for the CONUS but there are several in the 7–8 °F (~ 4 C) range up until the mid-1980s. From that point, extreme area-averaged cold has almost vanished as only three of the 29 years since 1996 achieved negative departures, all of which were relatively small. Regarding Hot Extremes: From the fewest daily records “centered” around 1970, all regions show some level of rise to the present. The most recent 15-year period for the CONUS experienced 21.1 daily TMax records, the most since 1936–1950, yet well below the highest of 35.1 in 1925–1939. Regarding Heat vs. Cold: The sum of days in extreme heat/cold declined from over 120 in the 1930s to about 75 since 1960. The conclusion here would be that the CONUS has experienced a decline of around 30% of these durative extreme events in the past 100 years. Along with this decline has been an increase in heatwave days vs. cold wave days since the 1970s, mainly due to the increase in heatwave days in the West (Fig. 10) and the decline in cold wave days overall. These differences are consistent with what one would expect from a warming climate, not a stable, much less cooling one. -
@CT Rain pointed this out but the 6z gfs for BTV Tuesday aftn is super impressive.
- Today
-
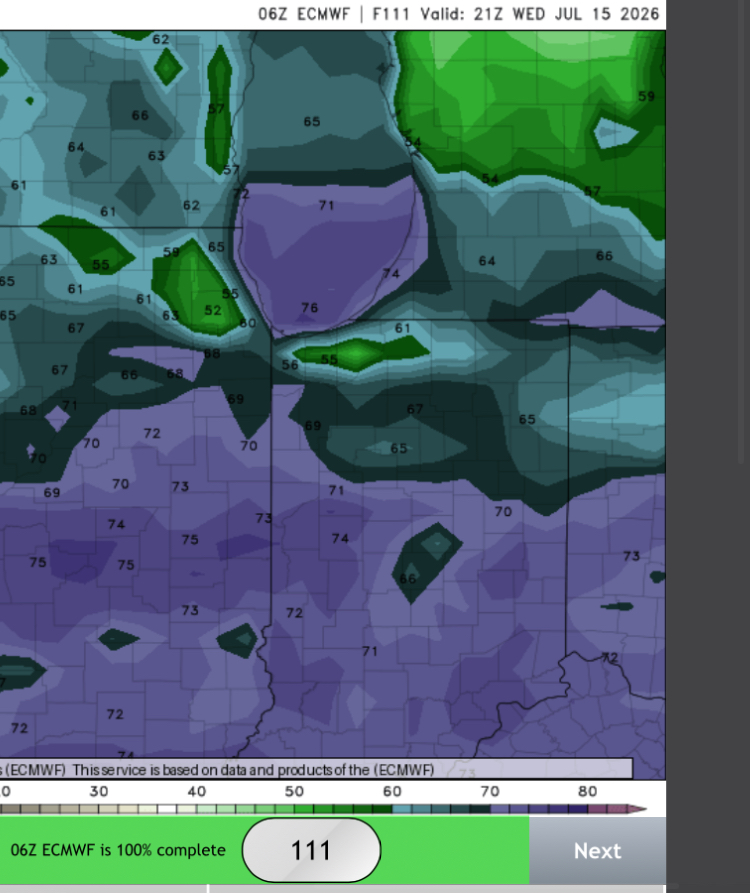
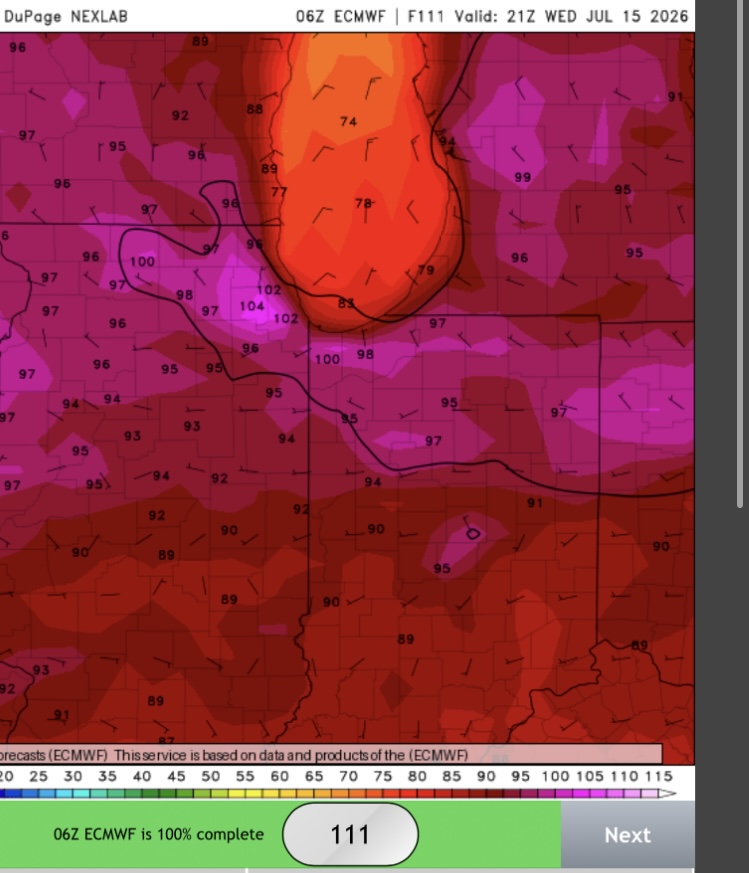
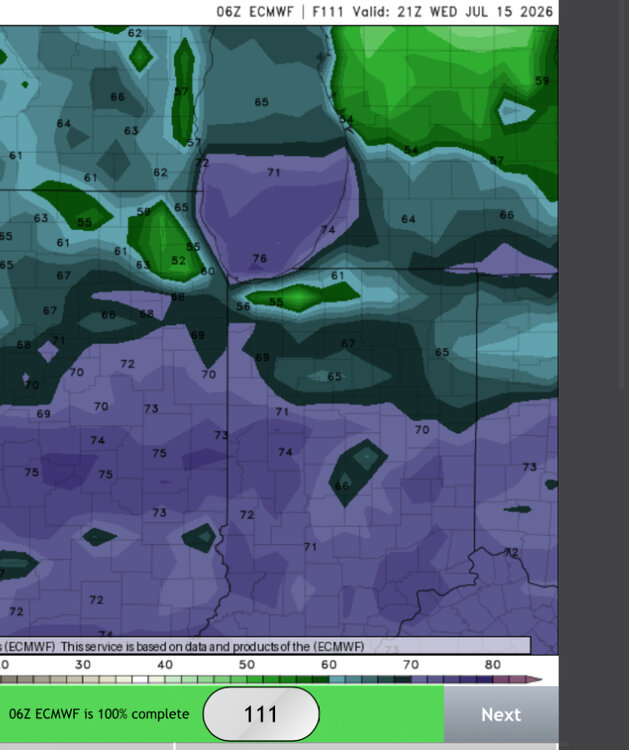
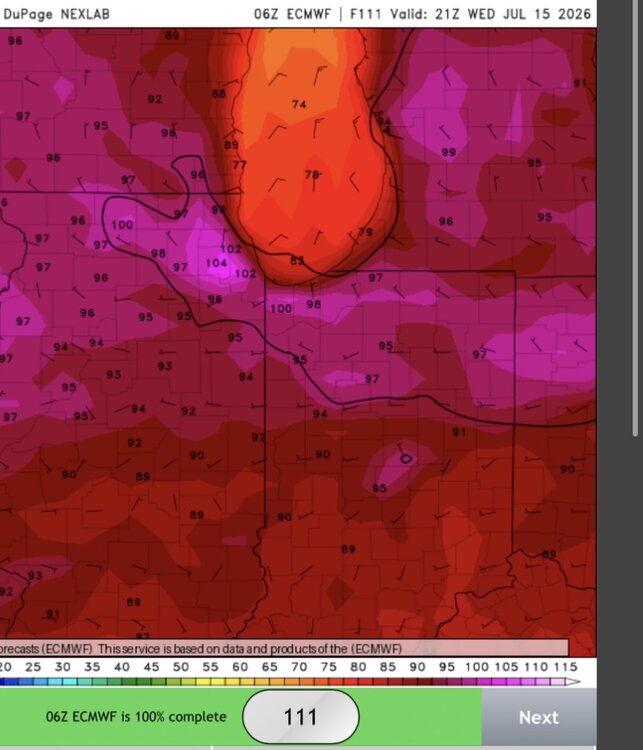
Euro showing throwing up some wild numbers for Wednesday. Looks super funky with a pocket of dewpoints in the 50s! 102/55 ORD For me personally if it’s gonna torch I’d rather it be a very dry heat like this. Evaporative cooling FTW!
-
If we are going by weenie superstitions that is a kiss of death.
-
SPC now has tn almost entirely in slight risk with northeast corner in marginal no longer in the 5% hail risk but 5-15% wind has been moved to cover all of tn 2% tor risk is moved northwest corner of west and middle tn https://www.spc.noaa.gov/products/outlook/day1otlk.html .
-
Did not expect this much rain this morning. Very happy for it! We've picked up .57 this morning.
-
Gonna have goofy storm/shower motions today
-
59 with heavy rain currently in Wolf. We've picked up 7.66" since midnight! Sent from my Pixel 10 Pro using Tapatalk
-
Wildfire sprouting in Brunswick county. It's been dry down there too.