All Activity
- Past hour
-
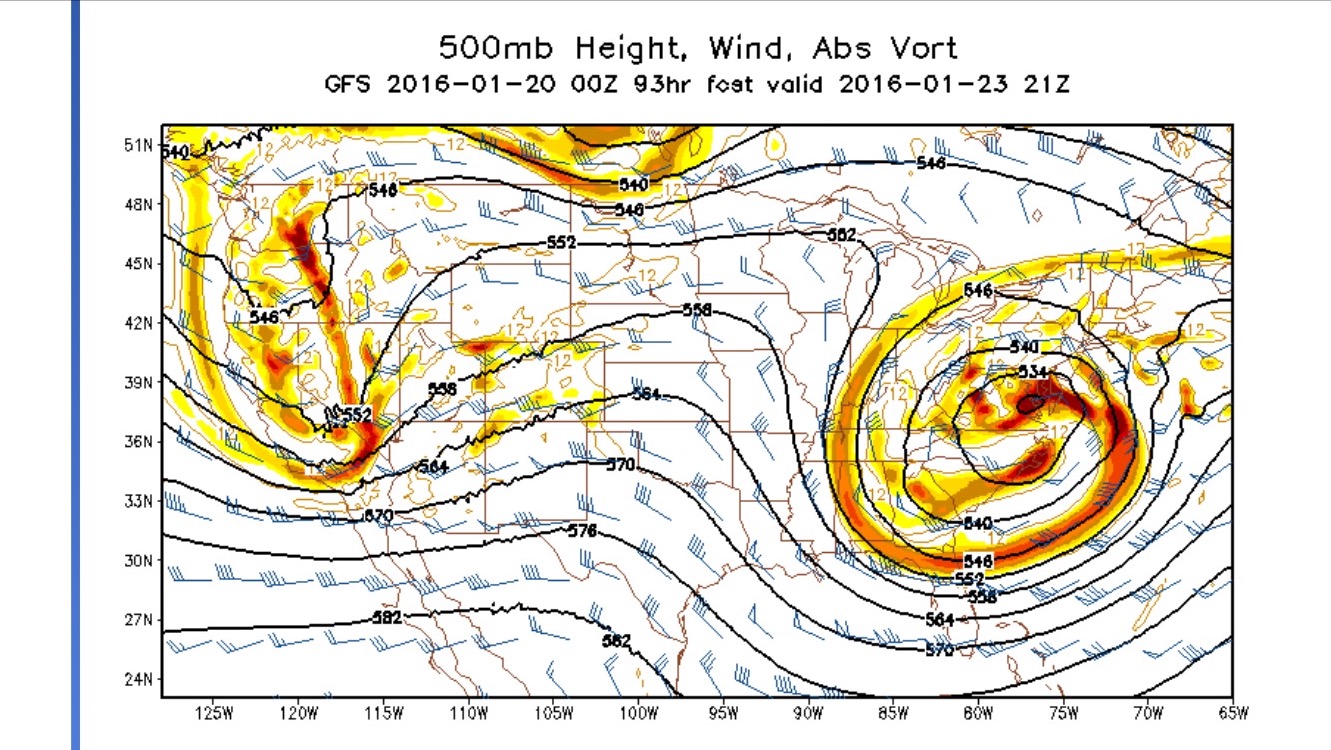
No they don't. They show 2 very different things. Vorticity (or Positive Vorticity Advection/PVA for our purposes with storms) shows rotation and lift in the atmosphere. This is caused by upper level level winds so the plots bear resemblance but they are not the same things at all. Vorticity maps should be visualized 3 dimensionally while wind maps are basicslly 2 dimensional.
-
Sorry meant the vorticity map. Those maxes are far better at predicting where the energy is going.
-
Can we change the title of this thread to: It’s not coming 1/31-2/1 Please…. .
-
January 25-26th, 2026 Final Storm Totals
BombsAway1288 replied to The 4 Seasons's topic in New England
23” glorious inches in Chelsea. One of the best storms of my lifetime due to consistent heavy snow with no subsidence despite the poor snow growth for 75% of the storm -
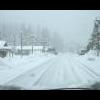
11.5 degrees currently with steady light to sometimes moderate snow. Windy as well. Looks like Old Forge, NY out there. Low gray overcast, deep snow cover and the air filled will falling and blowing snow. Gotta feel sorry for anyone who has had to work outside this month. Except for a several day pause in the cold earlier this month it has been brutal. December was no bargain for outdoor workers either.
-

E PA/NJ/DE Winter 2025-26 Obs/Discussion
Birds~69 replied to LVblizzard's topic in Philadelphia Region
Same...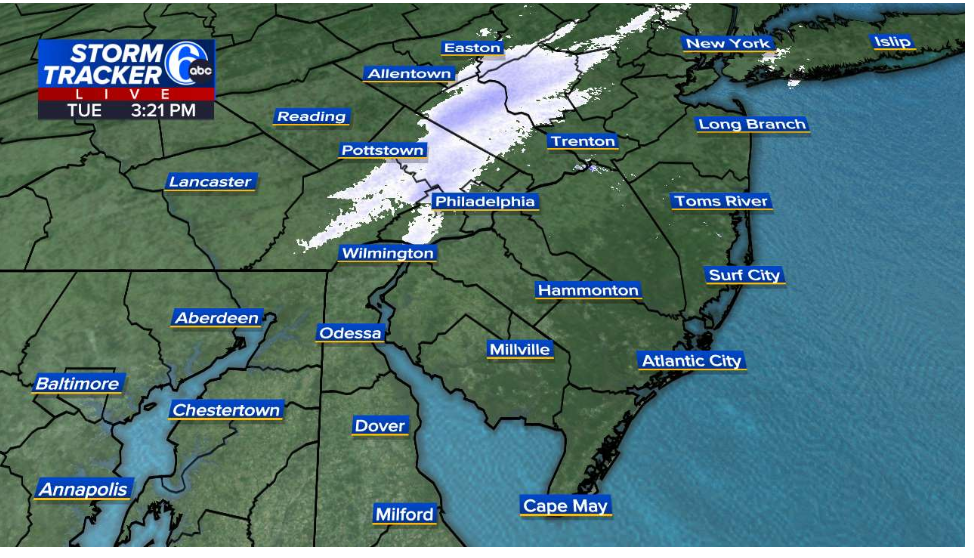
-
True story about the number one analogue (March 2-3 1980) ... I was briefly working at Accu-weather to provide info about Canadian forecasting markets they might investigate, and their practice before a big storm was to have every forecaster draw up a map of personal snowfall estimates. Joe Bastardi of all people was in that group. I was drawing up maps for them, not providing forecasts, as I am not (was not) a degreed met, but I did draw up a forecast map and had it on a wall full of maps, and as I recall it had some pretty aggressive numbers in s.e. VA. They would then discuss all the maps ... The one person in the room who didn't say "oh that looks wrong" about my numbers was JB who I think had similar numbers on his map. You may recall, there had not been a lot of snow anywhere in the winter of 1979-80, I recall one moderate fall of about 6" across PA around Feb 10th maybe, otherwise bare ground especially further north, into the Great Lakes and northeast. Anyway, we ended up busting low but had some influence on the group consensus. (well Joe did probably) The storm dropped well over 20" in Norfolk and Virginia Beach. I think it dropped 6 to 10 inches in the DC to Baltimore region and cut off around York, PHL and ACY. At the time it was record cold all over the eastern states, this would have been maybe Feb 29th 1980 or March 1st at the latest. It was an interesting two months of weather that followed, including a monster cutoff rainstorm over the northeast in early April and hot weather records from the mid-south to the east coast in late April. My time there ended on April 30th and I didn't maintain any connections but I have met some of the well-known people at Accu-wx and it is quite the hive of weather activity hidden away in the university town of State College PA. I recall Joe as a very friendly and gregarious person who often went balls to the wall compared to the more conservative senior forecasters, and was regarded as the rising star at the time. I think I was more of a setting moon. That's where I developed my interest in long-range forecasting, they were looking at getting into that area, and I participated in a couple of brainstorming sessions, once again, maps on a wall. I remember April 1980 coming out with huge positive anomalies over the south central U.S. in advance of a very hot summer. It all grabbed my interest and I began to look for methodologies that might work using date-shifted lunar analogues (a similar pattern where you refined the timing by shifting the dates to make lunar calendar similar ... I had worked out somehow that this is the method used by the Farmers Almanac, although they based their similar years on things like solar cycles and previous few months of anomalies. I worked this out by first figuring out what winter they were using and noticing a date shift that was explained by the moon's orbital cycles in that winter compared to 1979-80. Was it worth it? Maybe not, it has been a voice in the wilderness sort of journey to say the least. But it is what it is.
-
1/24-1/25 Major Winter Storm - S. IL, IN, and OH
Stevo6899 replied to A-L-E-K's topic in Lakes/Ohio Valley
I've experienced several as my job used to require me to travel. You think I'd be wasting my time arguing with the wall (josh) if all I wanted was to experience one in general? I want so much snow here it knocks out power in wyandotte and I can go a few days without Josh's turd polishing glass half full climo bs. -

E PA/NJ/DE Winter 2025-26 Obs/Discussion
Lucy Pull replied to LVblizzard's topic in Philadelphia Region
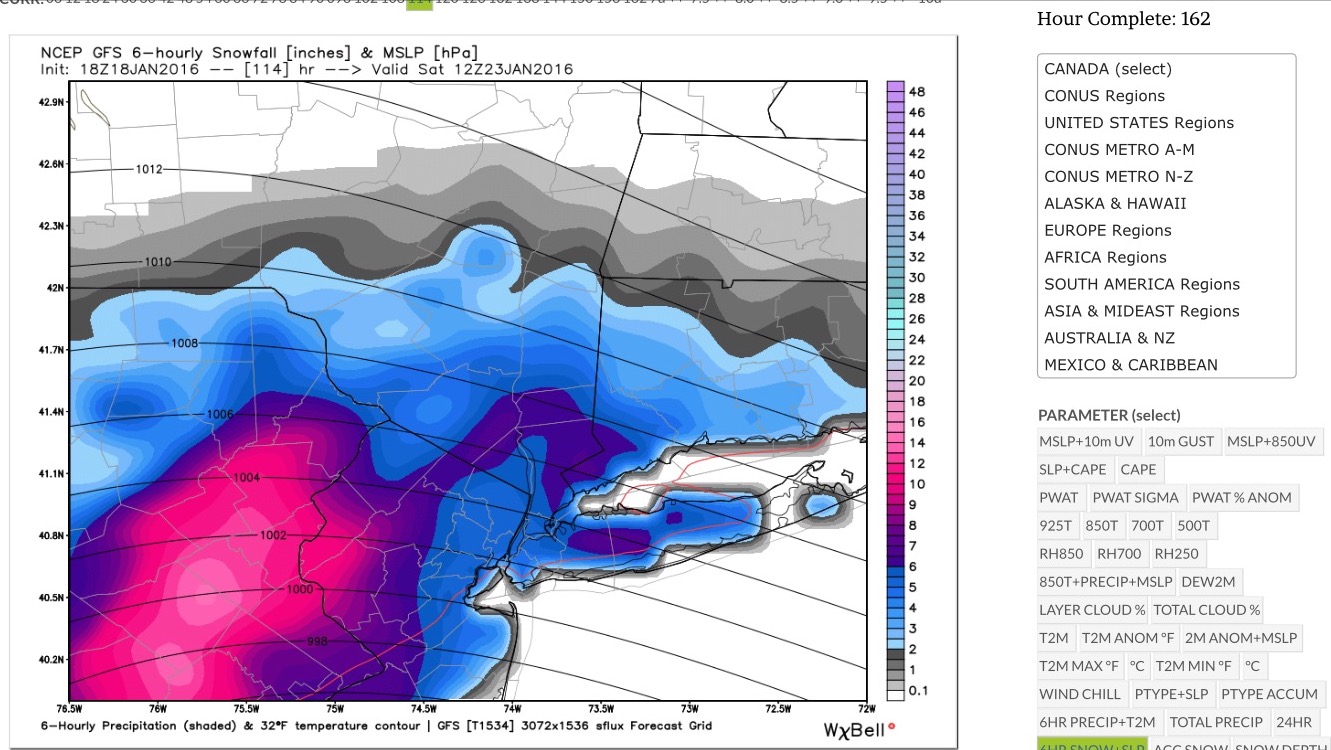
Funnily enough based off some old screenshots it looks like the euro was showing a substantial hit around 168 hours. Same with GFS around 120 hours out. i remember them trending south and then NAM at 84hrs was the first to show a major hit north of the Mason Dixon again. Some screenshots leading up to event -


-
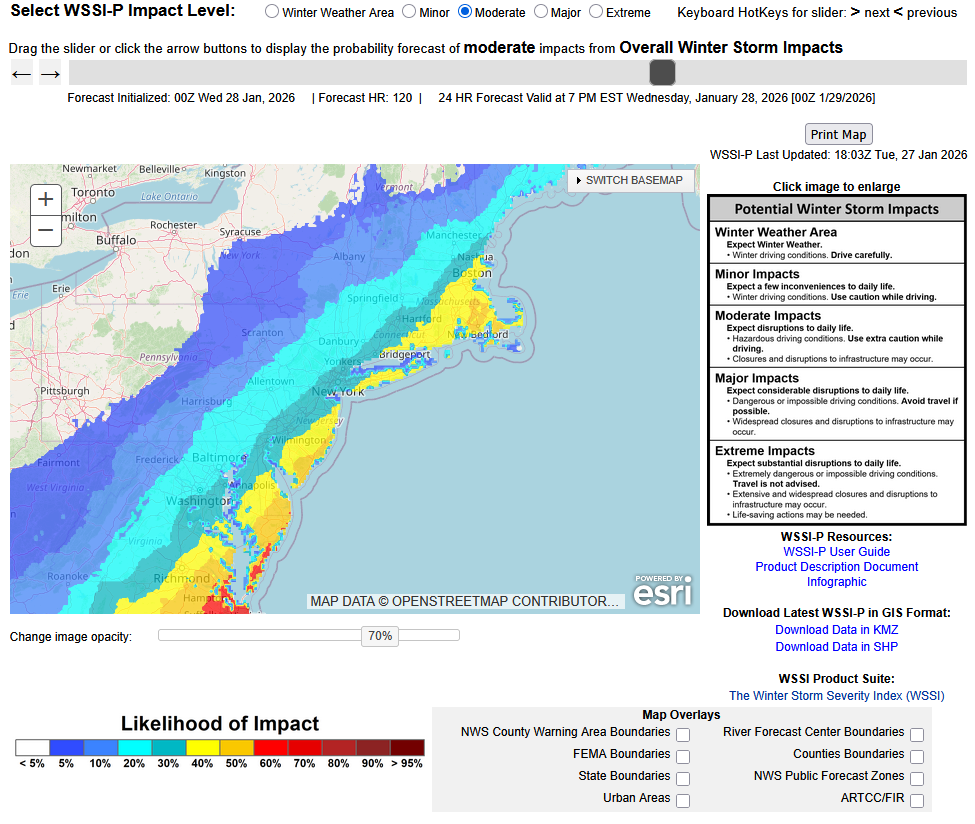
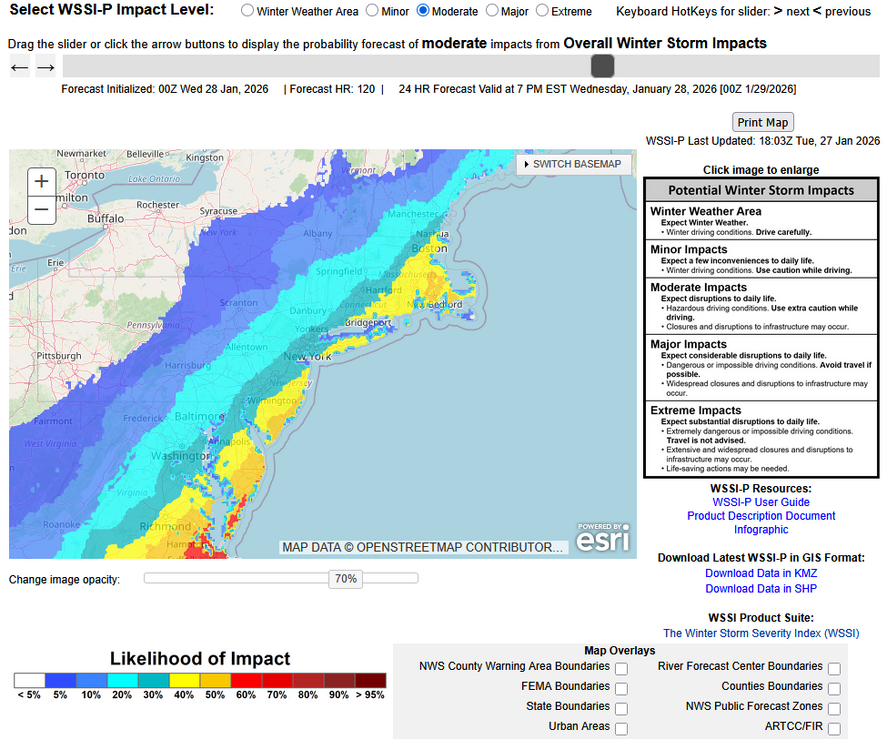
There remains potential for snowfall on Sunday in the New York City area with an even higher probability of snowfall across eastern Long Island. What's fairly certain is that a storm will develop somewhere along the Southeast coast and possibly become quite deep. What's uncertain and subject to synoptic details (the placement of vorticity maxima, 500 mb low, etc.) that the guidance can't reliably resolve at the current lead time is the exact location where the storm will develop and its ultimate track. By Thursday, the guidance should be moving into a more skillful lead time. As a result, there are varying solutions. Several models now take the storm out to sea with no impact on the New York City area. Others graze the region, possibly with several inches of snow. The 18z NBM even brings close to 0.50" QPF to New York City. This large spread reflects the degree of uncertainty that still exists. Although it looks less likely that this will be a blockbuster storm, writing the event off completely goes beyond what can reasonably be supported by the models and their ensembles. Here's the latest WPC probabilistic assessment of a moderate impact:
-

The “I bring the mojo” Jan 30-Feb 1 potential winter storm
WXNewton replied to lilj4425's topic in Southeastern States
According to this, precip was definitely enhanced in western NC when compared to 6z. Very interesting to see how this plays out, but it kind of did like the Euro, 12z looked a tad better than 6z. -
IMO its worse than the euro
-

The “I bring the mojo” Jan 30-Feb 1 potential winter storm
NorthHillsWx replied to lilj4425's topic in Southeastern States
This is very bullish: https://x.com/nwsraleigh/status/2016222988543074686?s=46&t=NyKvXvI1o-sJQb-68mmo4g -
both are at 500mb
-
Gemini wasn't completely out to lunch on precip totals. It also said this FWIW. Pressure Drop in the Foothills: As the air from the ULL crashes over the mountains, it "stretches" the air column on the eastern side (the lee side). This creates a localized area of lower pressure near Marion and Morganton. Increased Moisture Convergence: This mini-low acts like a vacuum. Even though the main coastal storm is trending east, this lee-side feature is pulling moisture back toward the mountains. The "Inverted Trough": In the 12Z WN2, there is a clear "Inverted Trough" (a tail of low pressure) extending from the coast back toward the Foothills. This setup is a classic "snow-maker" for WNC because it forces the moisture to stay pinned against the mountains rather than just blowing past. The result on the 12Z Maps: Asheville: Instead of seeing "downsloping" (which usually dries out the air), the ULL is so strong that it’s overcoming that effect. The lee-side low is keeping the air "rising" rather than sinking, which is why your QPF actually went up in the latest run. Marion/Morganton: You are in the "sweet spot" for this enhancement. The WN2 shows a convergence zone setting up right over McDowell County where the moisture from the coast meets the cold air spilling over the ridge. This is why Marion’s liquid total jumped to 0.95".
-
Ok, extrapolating the NAM. Looks like it's heading to anywhere from 0"-32"
-
Steady light snow, dusting on the ground.
-
The 500mb shows the vort maxes farrrrrr better.
-
That’s the one I use. Very handy .
-
FWIW - NOAA gives NYC a ~50% chance of snow for Saturday night and Sunday.
-
steady light snow making it 3 days in a row with snow falling
-
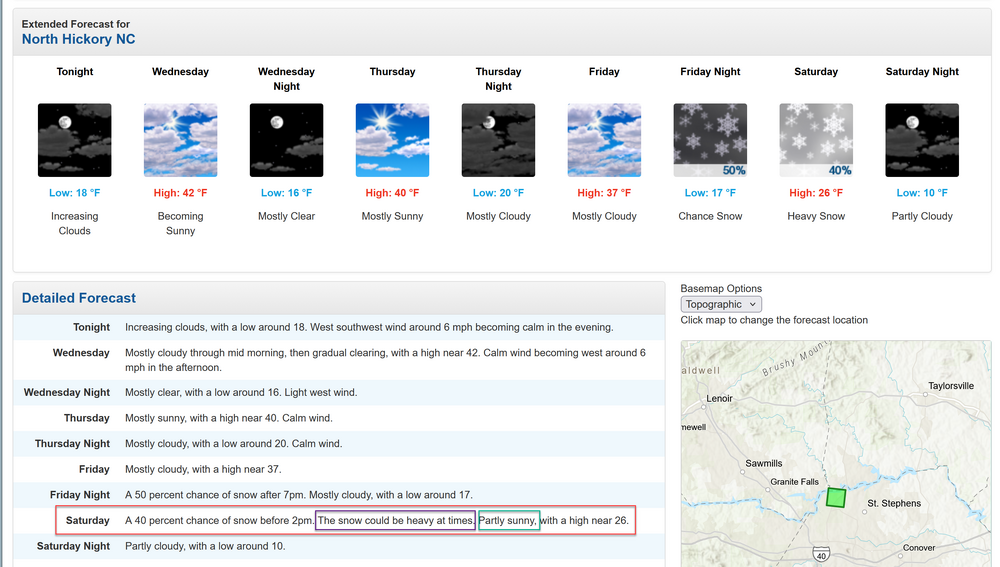
My point-and-click forecast for Saturday is rather funny. Heavy snow alongside partly sunny skies. =)
-
Bottom one is easier in my view
-
Pittsburgh/Western PA WINTER ‘25/‘26
MikeB_01 replied to Burghblizz's topic in Upstate New York/Pennsylvania
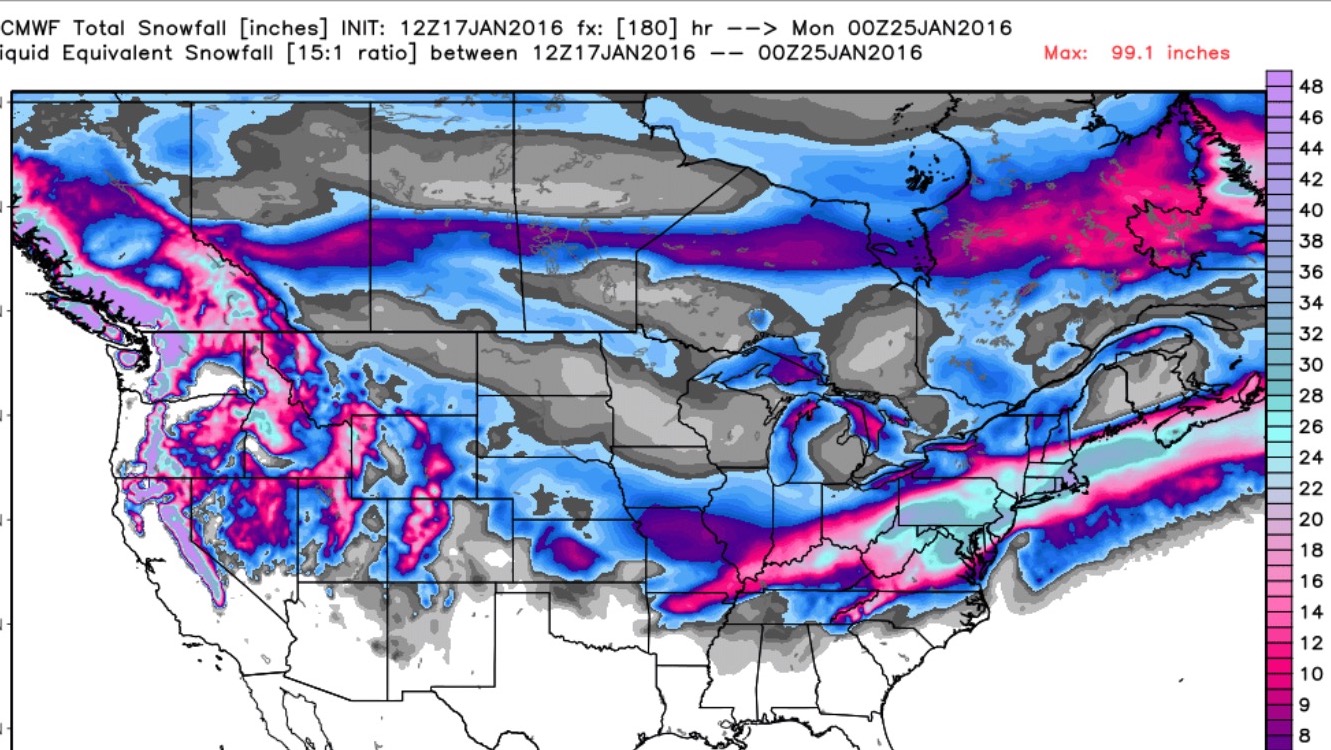
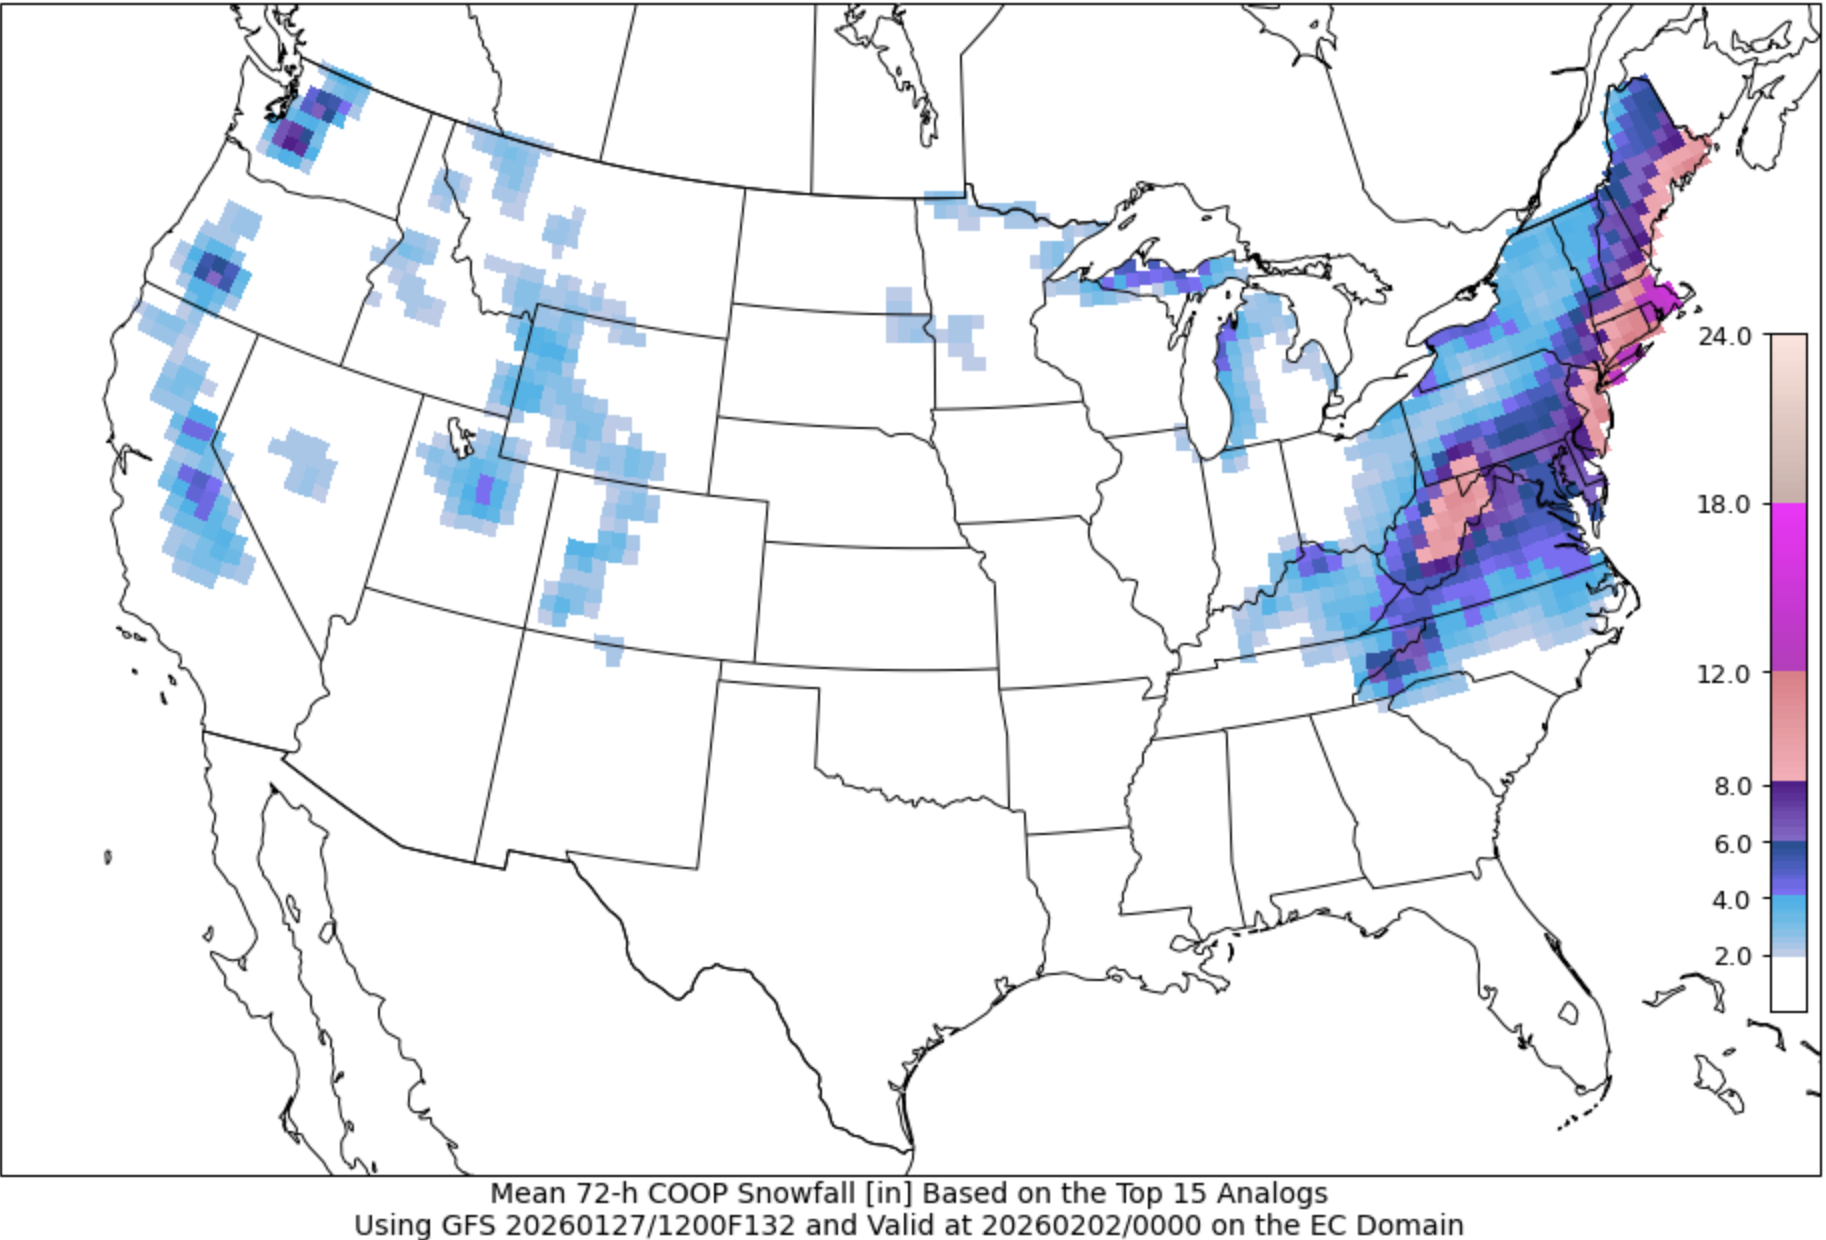
even if the models are not showing anything, we still have analogs in our favor. Here is the mean snowfall for the time period on the GFS -- would seem to indicate a decent chance for a 1-3 or 2-4 snowfall. At least we can hope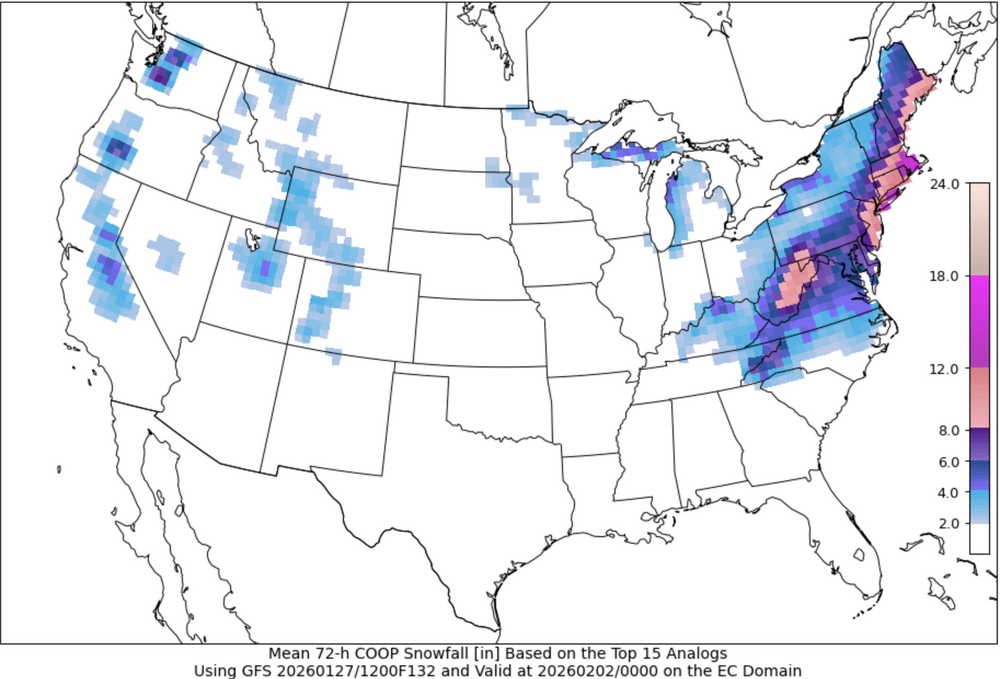
-

Possible coastal storm centered on Feb 1 2026.
Spanks45 replied to Typhoon Tip's topic in New England
Just wants to snow....moderate snow currently, everything coated up again...18⁰