All Activity
- Past hour
-
Been a while since things were this green and this well watered at the mid point of Summer. Still some long term dryness going on but big improvements over NNJ last several weeks.
-
.46 last night and 1.60 for the month. Had a couple of flashes of lightning and a few rumbles of thunder.
-
That's a good appetizer, but for most we still need an entree.
-
@MANDA Chester is also wonderfully green for the second half of July.
-
July 22 1972: Copious amounts of rain fall in parts of Minnesota, with 10.84 inches of rainfall in 24 hours at Ft. Ripley. 14 inches of rain is measured at a farm in Morrison County. For Wednesday, July 22, 2026 1918 - A single bolt of lightning struck 504 sheep dead in their tracks at the Wasatch National Forest in Utah. Sheep often herd together in storms, and as a result the shock from the lightning bolt was passed from one animal to another. (David Ludlum) 1986 - Hurricane Estelle passed 120 miles south of the Hawaiian Islands creating a ten to twenty foot surf. The large swells resulted from a combination of high tides, a full moon, and 50 mph winds. The hurricane also deluged Oahu Island with as much as 6.86 inches of rain on the 24th and 25th of the month. (Storm Data) 1987 - Barrow, AK, receives 1.38 inches in 24 hours on the 21st and 22nd, an all-time record for that location. The average annual precipitation for Barrow is just 4.75 inches. Thunderstorms in Montana produced 4 to 6 inches of rain in Glacier County causing extensive flooding along Divide Creek. Missoula, MT, received 1.71 inches of rain in 24 hours, a record for the month of July. (The National Weather Summary) (The Weather Channel) 1988 - Six cities in the south central U.S. reported record low temperatures for the date, including Pueblo, CO, with a reading of 48 degrees. Thunderstorms over the Atlantic Coast Region drenched Wilmington, NC, with 6.49 inches of rain in about eight hours. (The National Weather Summary) 1989 - Showers and thunderstorms prevailed across the southeastern third of the country. Afternoon thunderstorms in Florida produced wind gusts to 86 mph at Zephyrhills, and gusts to 92 mph at Carrollwood and Lutz. Thunderstorm winds gusting to 69 mph at Crystal Lake damaged nineteen mobile homes. (Storm Data) (The National Weather Summary) Observances: 22 Wed National Hammock Day 22 Wed Tisha B'Av 22 Wed Beta Glucan Day 22 Wed Casual Pi Day 22 Wed Lion's Share Day 22 Wed Mango Day 22 Wed National Fragile X Awareness Day 22 Wed National Penuche Fudge Day 22 Wed Pi Approximation Day 22 Wed World Brain Day
-

2026-2027 Super El Nino
LakePaste25 replied to Stormchaserchuck1's topic in Weather Forecasting and Discussion
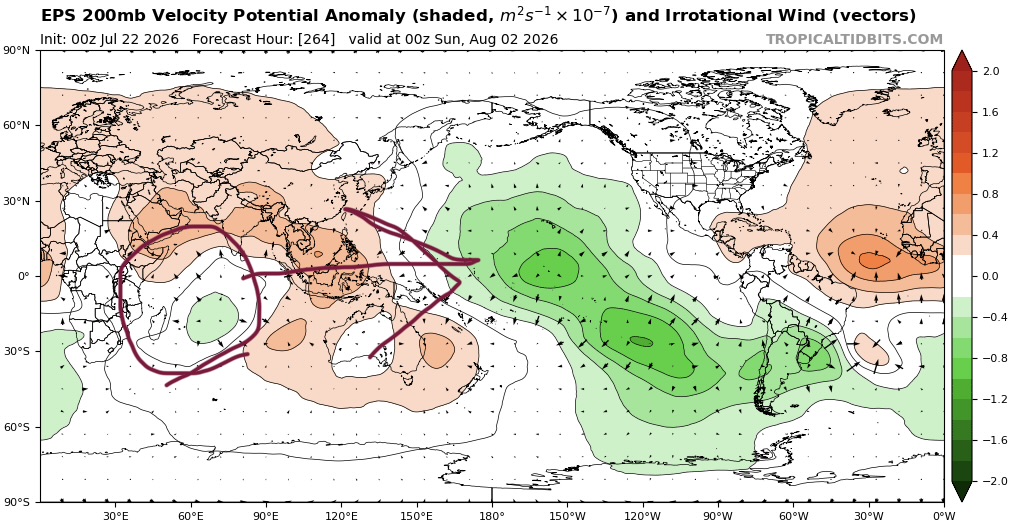
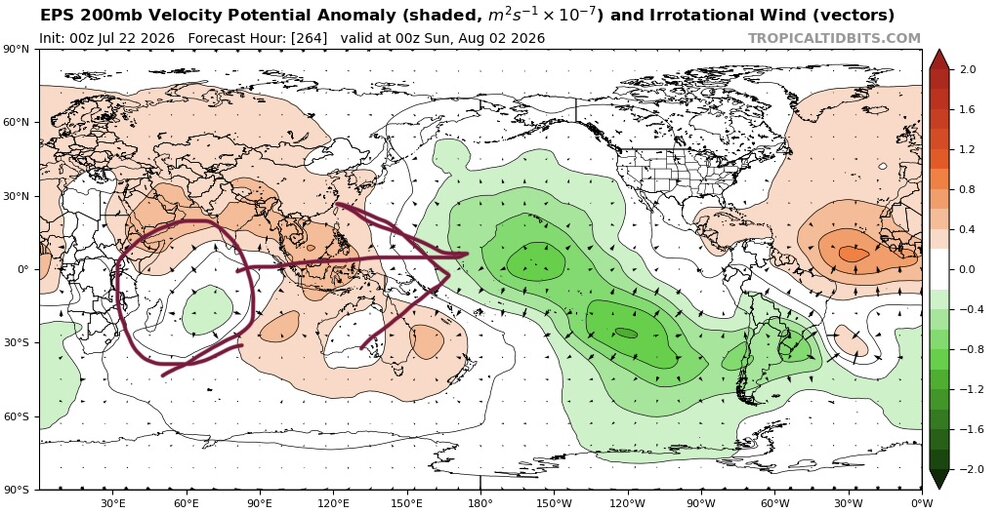
This is the strong atmospheric coupling with El Niño being reflected in the RMM’s. You might get the occasional weak pulse that crosses the IO which would bring it into the COD from time to time on the mean before looping back around into 7-8-1. That’s basically what is about to happen: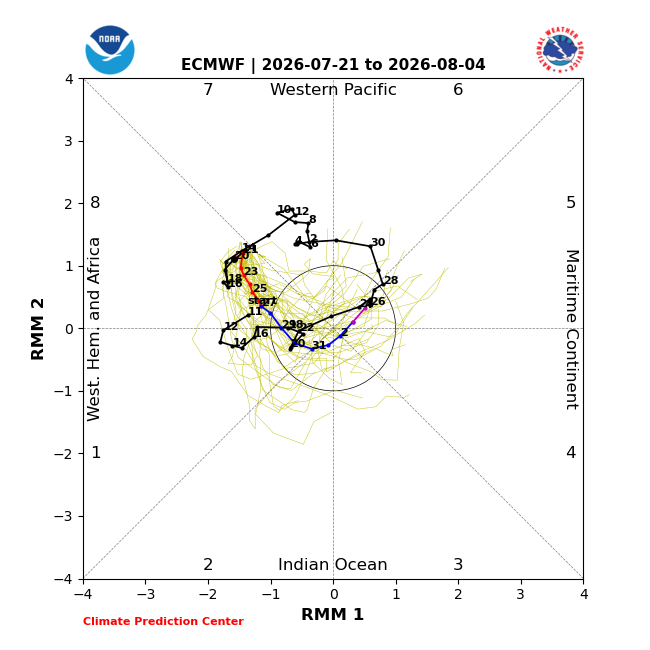
-
 they must get some avalanches around there, no?
 -

2026-2027 Super El Nino
GaWx replied to Stormchaserchuck1's topic in Weather Forecasting and Discussion
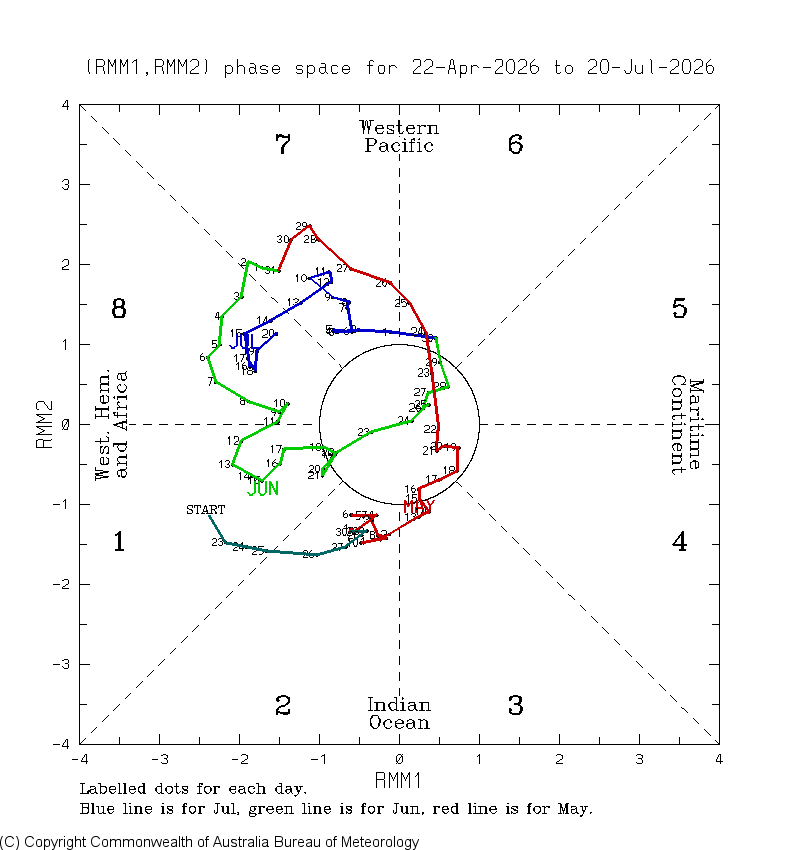
Last 90 days of MJO still is when averaged the most left-sided on diagram for this time of year, April 22nd-July 20th, for any year on record (back to 1975…I just looked at all of them) and this new record should hold through the end of July at least. Anybody know what this means?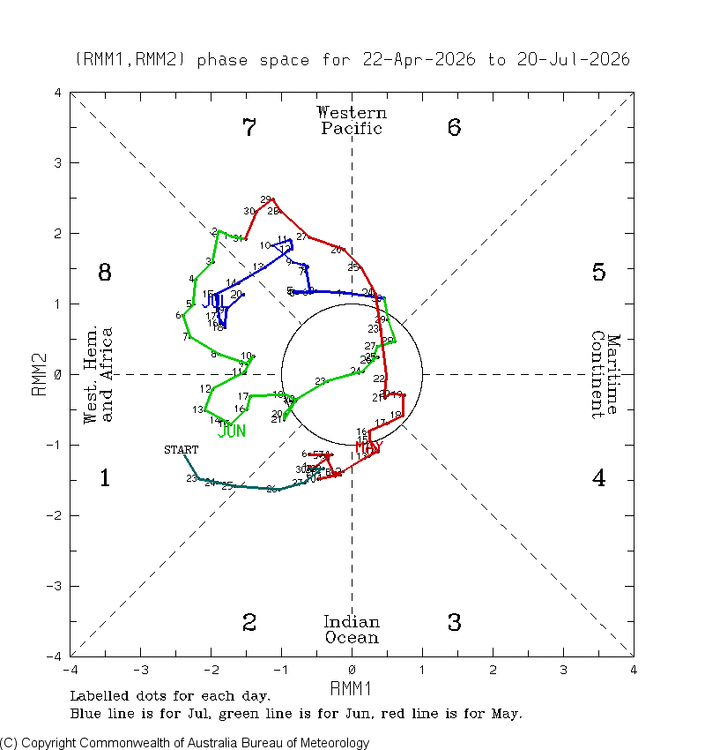
-
3.35" last night and 9.87" for July. Quite a turnaround from the previous few months.
-
That sorta reminds me of when I was a kid in the early 50’s and we used to play tag with, what we called, sun showers. I guess the convection strength was either very isolated or that the ASOS cover foliage in Central Park soaked up a lot of what was falling. I like your screen name. As always …..
-
Seems the GFS has a remnant EML in the vicinity for next week.
-

2026-2027 Super El Nino
bluewave replied to Stormchaserchuck1's topic in Weather Forecasting and Discussion
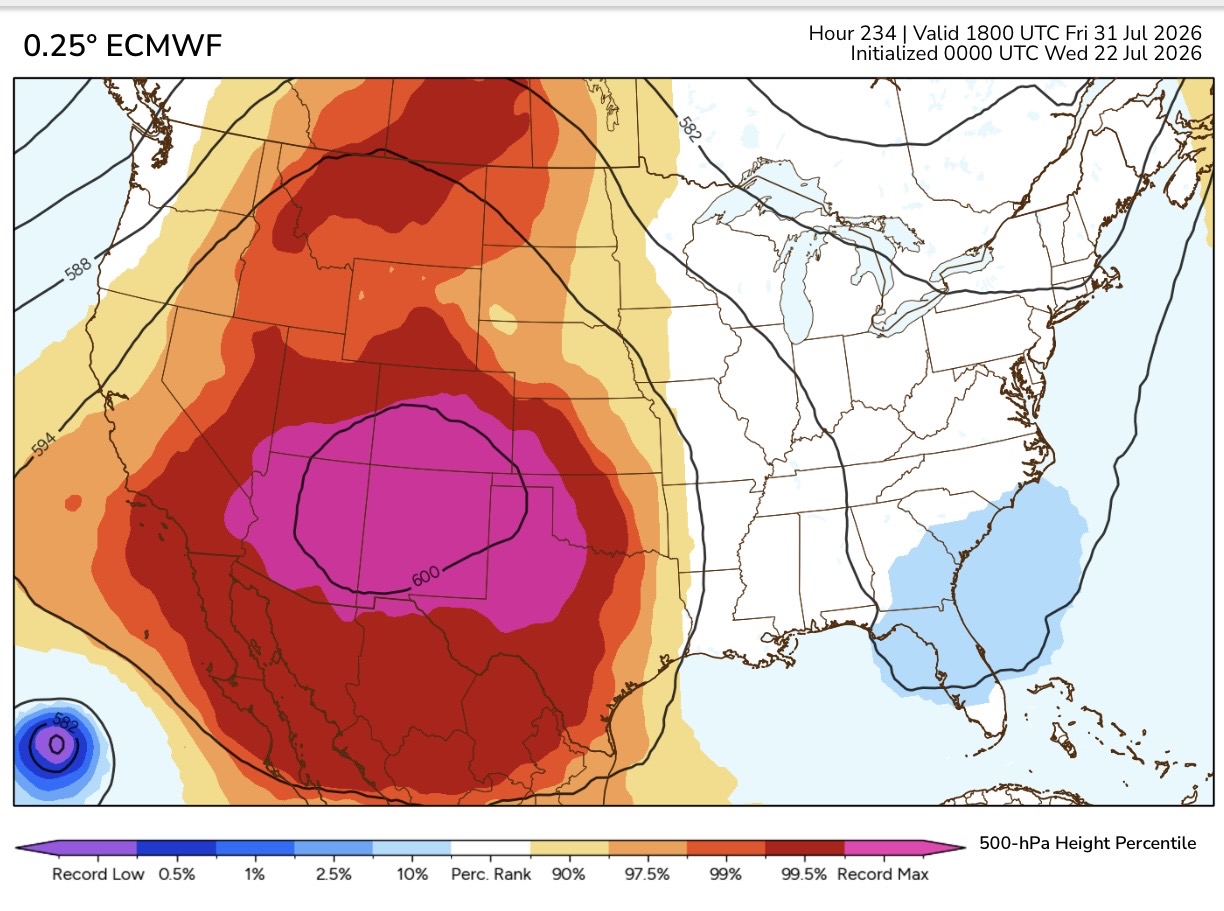
The next potential record breaking 600 DM ridge amplification will be much further west over the Rockies next week than the recent one over the Upper Midwest. That’s good news for our part of the CONUS. Most summers since 2010 with 100° heat in June and July for our area remained under 100° in August. Hope that recent pattern continues. Still not an El Niño-like pattern but an improvement for the Northeast.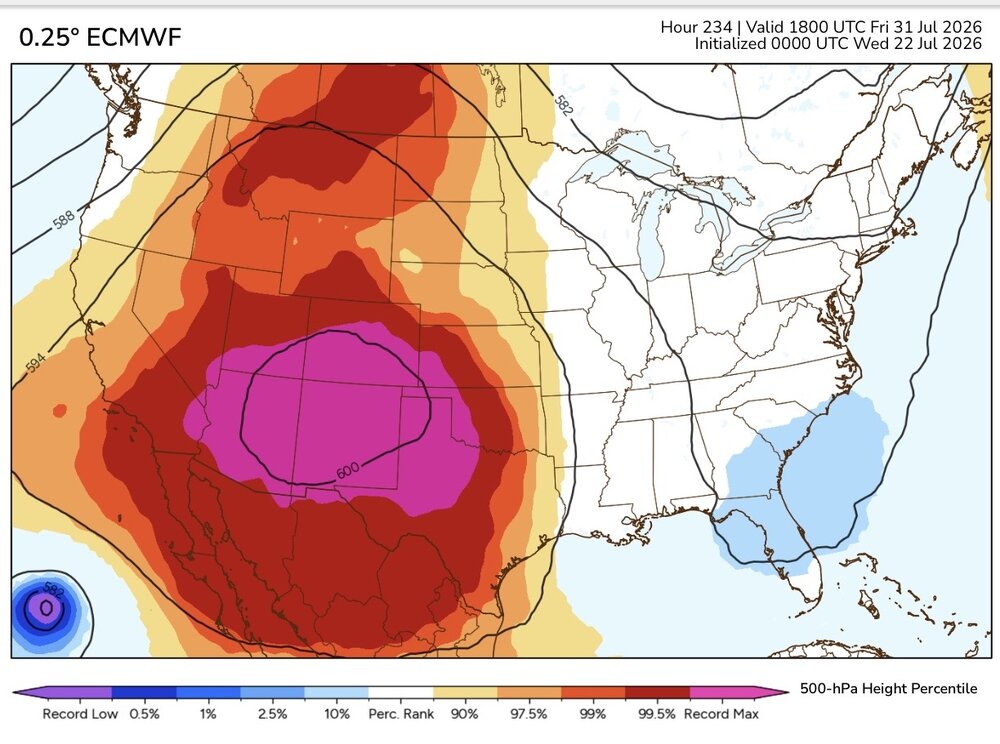
-
Machine learning did well in review, pointing out days well in advance. At least from what I read 7 to 10 days ago.
-
Looks like next week we go again Day 4-8 Convective Outlook NWS Storm Prediction Center Norman OK 0226 AM CDT Wed Jul 22 2026 Valid 251200Z - 301200Z ...DISCUSSION... ...Upper Midwest to Ohio Valley and Mid-Atlantic... An upper ridge centered over the High Plains will persist through the middle of next week. Meanwhile, upper troughing will be maintained over the eastern U.S. Periods of enhanced northwesterly flow aloft are expected across parts of the Upper Midwest/Great Lakes into parts of the Ohio Valley and Mid-Atlantic on the eastern periphery of the Plains upper ridge. Several shortwave impulses are forecast to develop southeast from Canada within this northwest flow regime. This could support daily severe thunderstorm chances from the Upper Midwest into the Ohio Valley, and possibly the Mid-Atlantic. However, the timing of these features is uncertain, and midlevel capping could limit the spatial extent of severe potential. It is likely that portions of the Upper Midwest into the Ohio Valley will need severe probabilities in later outlooks, particularly for Day 4-6/Sat-Mon, and possibly the mid-Atlantic by Day 7/Tue. However, confidence in where this risk will develop each day is too low for 15 percent delineation at this time. ..Leitman.. 07/22/2026
-
A 7.6” CoCoRAHS report from central WV! HoCo was a relative jackpot it looks like. 3.54” in downtown Columbia where I was getting soaked running to the movies and @canderson was at merriweather.
-
 Do you know what we got for rain?
 -

Spring/Summer 2026 Pattern Discussion Thread
Jed33 replied to Carvers Gap's topic in Tennessee Valley
Finally the firehouse is off at the house for the moment. Ended up with around 2.73in of rain for the moment. Kinda glad I was on the southern end of it, as like Carver said, just 4mi to my W/NW, Radarscope is estimating Bean Station has had close to 6in of rain!!! -
2026-2027 Super El Nino
GaWx replied to Stormchaserchuck1's topic in Weather Forecasting and Discussion
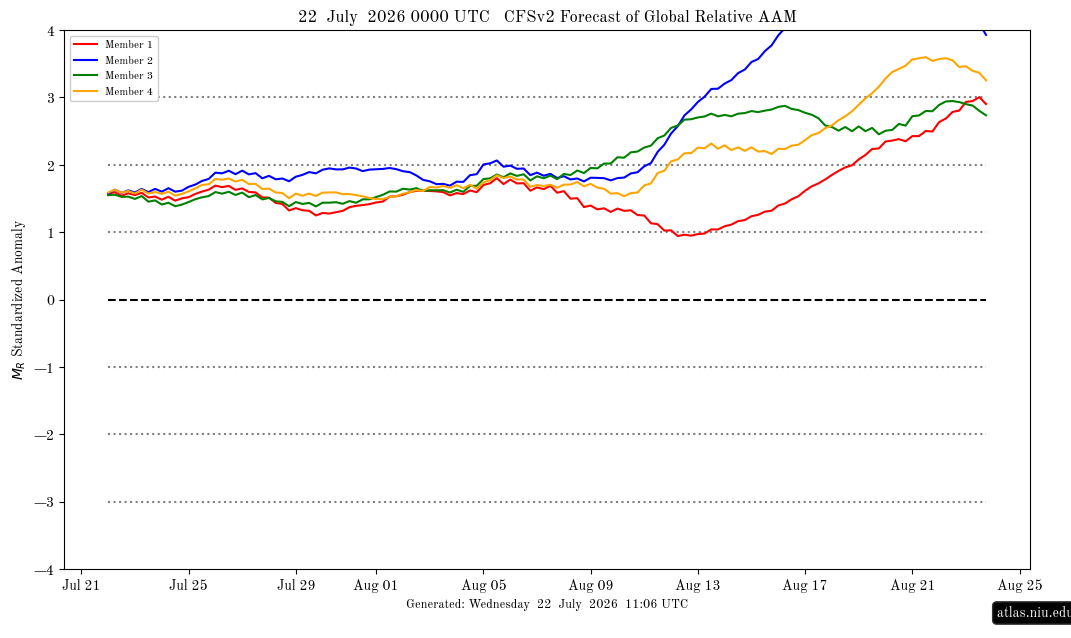
Latest mean of CFS AAM prog: steady as she goes +1.5 to +2.0 into mid August indicative of strong El Niño (further out usually higher/too high due to + bias):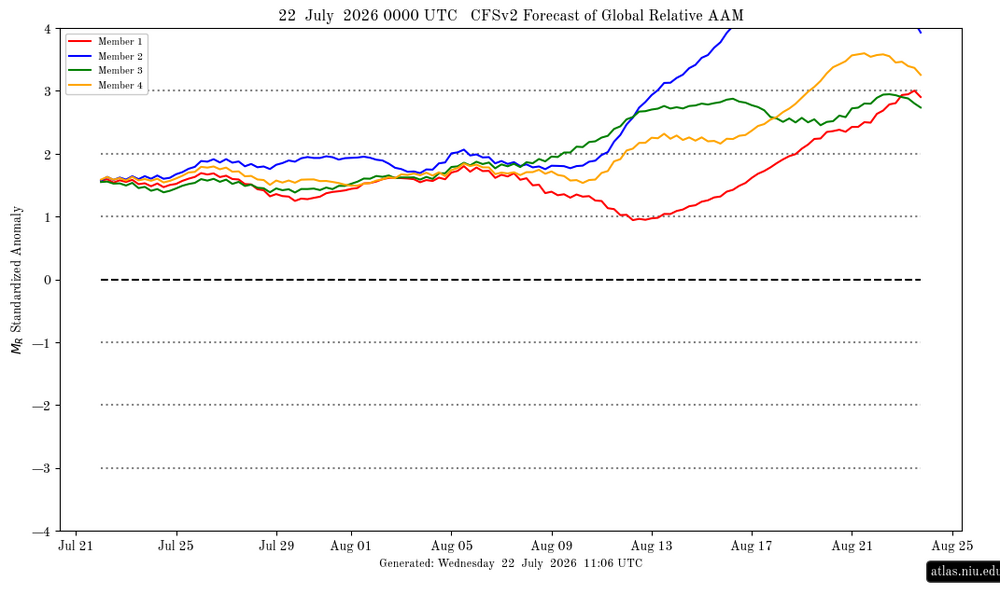
-
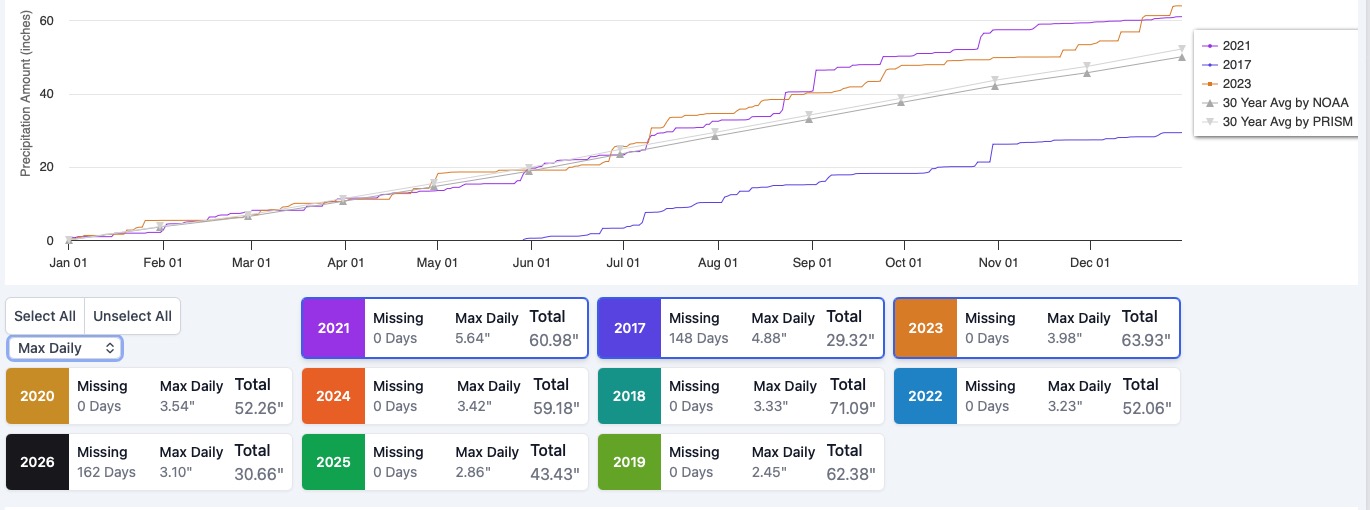
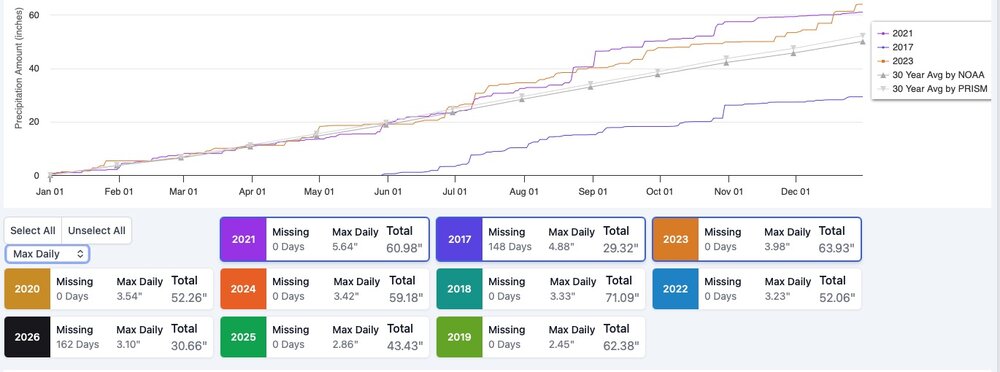
This is what I could find on the fly. Have to get out the door. Will dig further for max monthly. Note: I don't track by calendar day. Obs. are from 8am - 8am.
- Today
-
 Another nice day in Vermont, under that Mount Mansfield glacier… the fabled Picnic Table Icesheet.
-
My records go back to 2005.
-
Don't have any information on rainfall rates here. My period of record here is just about 9 years. Will have to go back and look to see what my wettest month was. Good question.
-
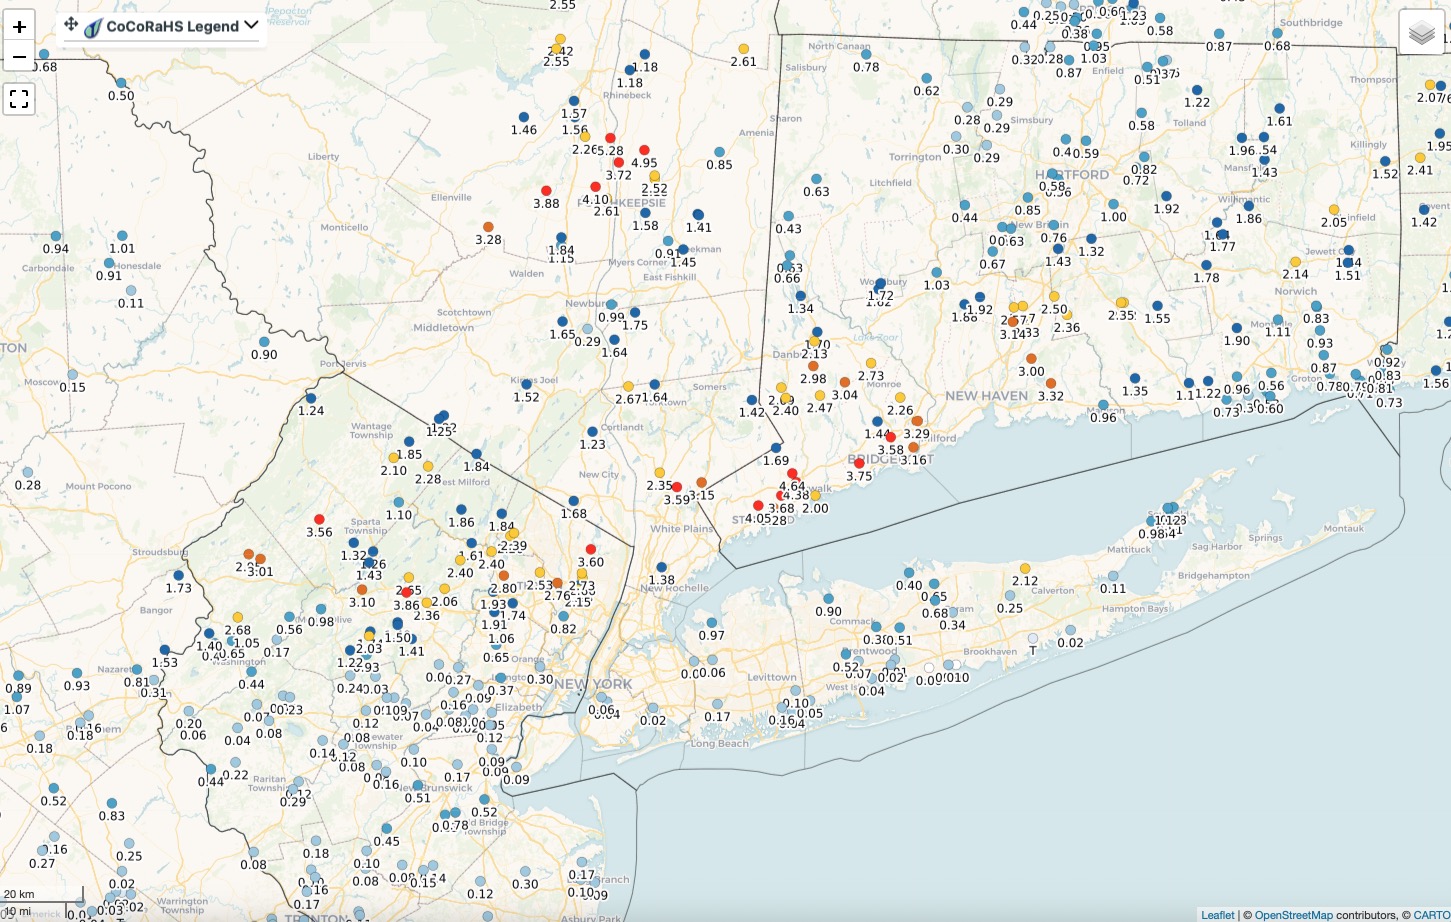
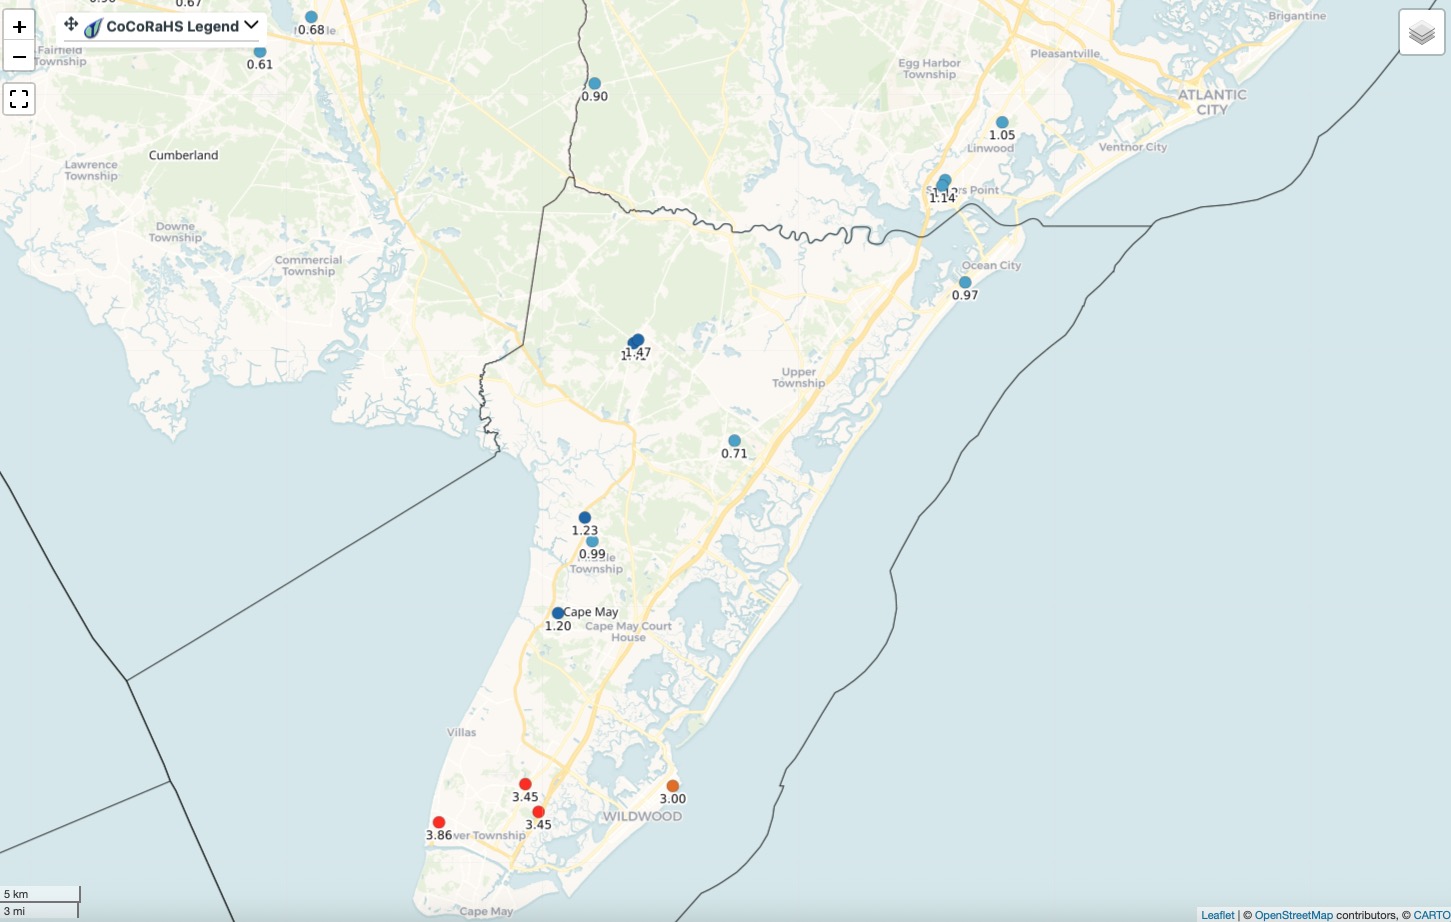
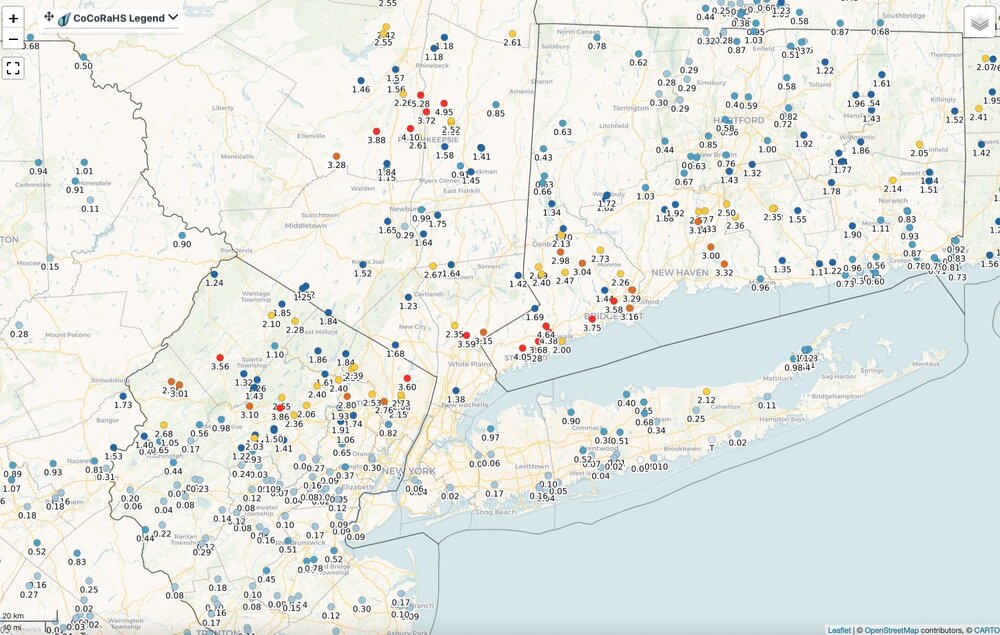
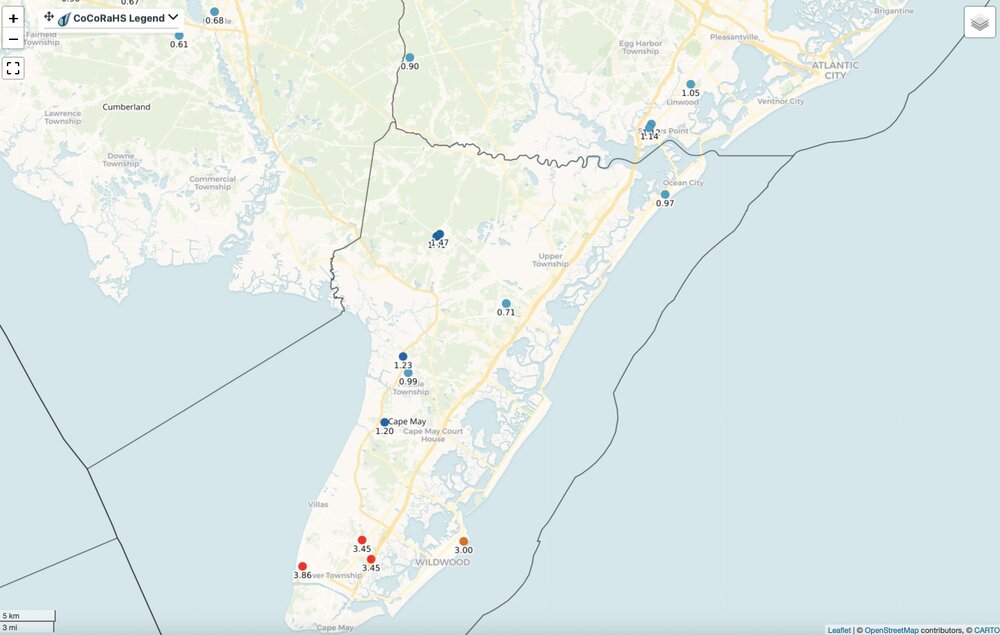
Rainfall totals yesterday. You either got in on it or you didn't. Click map to enlarge.
-

Spring/Summer 2026 Pattern Discussion Thread
Carvers Gap replied to Carvers Gap's topic in Tennessee Valley
One thing which is nice about this in NE TN(not relief for everyone as has been shared), the drought is getting busted up here. We aren’t there yet, but much better off than during spring and winter.