All Activity
- Past hour
-
Low was 22.4 around 4 am. Currently 24.7/22.8 at 8 am.
-
Just gimme a dusting. Something small is ok. A snow that will make my leaves look like Xmas cookies with powdered sugar on them.
-
The 80s were considered worse than the 90s depending on point of view. The 90s had more above average snowfall winters (2) compared to the 80s (1), however, the 90s were warmer. The 1970s were cold but only 2 above average snowfall winters (one was just 2 inches above average). Please be cautious when listening to posters writing in definitives. The posters that just give the current facts statistics and seasonal opinions are the most reliable IMO. There was a reason people always worried about the return of the 1980s (cold dry, warm wet) pattern during the good stretch. Now we are in it.
-
We need something to push here... and we just dont have it.
-
I don't expect even that much here. Even some snow falling would surprise me at this point.
-

2025-2026 Fall/Winter Mountain Thread
nchighcountrywx replied to Buckethead's topic in Southeastern States
GSP 717am Updates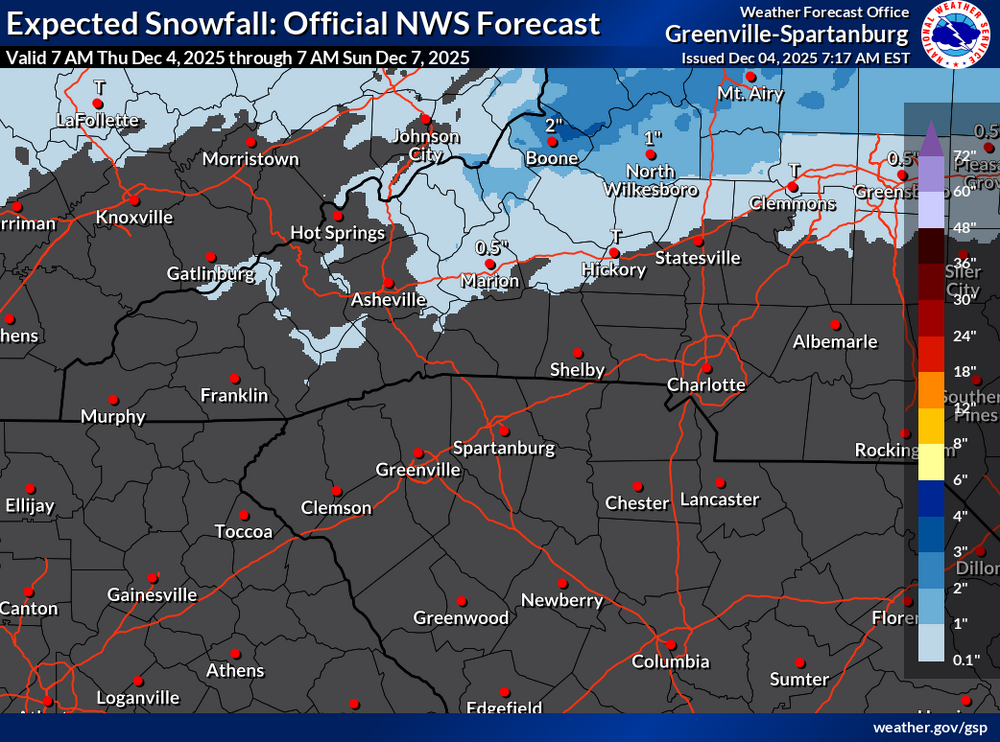

-
Probably, but you never know. Those types of things are dictated more by nuances within any framework. One ingredient of a good storm though is a good baroclinic zone. Which we don't have if everything is warm. I like seeing the cold and then we'll see what happens.
-

Central PA Fall Discussions and Obs
mahantango#1 replied to ChescoWx's topic in Upstate New York/Pennsylvania
Hopefully it's not late in the 4th quarter around the 2 minute warning that ole man winter decides to throw a hail-mary. -
Need the ridge in the west to get stronger.
-
-5 this morning here. First subzero of the season.
-

The Return of the 12/5 Snowstorm
NorthArlington101 replied to SnowenOutThere's topic in Mid Atlantic
6z EUROs were slightly improved. Not calling this one until it’s Friday morning and the precip is stuck in Fredericksburg. We’ve seen crazier north shifts -
 gotcha, i didnt see any reports from Suffolk county. I always include the climo sites EWR, NYC, LGA, JFK, ISP, BDR...regardless of snowfall amount even if its 0. Otherwise, all other reports are at least a T or higher.
 -

Southern MD / Lower Eastern Shore weather discussion
SOMDweather replied to PrinceFrederickWx's topic in Mid Atlantic
How we looking for tomorrow? -
I think it’s about time to face the music for us. Imma hang on till after 12z
-
Are there stats comparing average snowfall in a neg epo pattern verse wpo driven? I would imagine it would be less but not abysmal.
-
December 2025 Short/Medium Range Forecast Thread
Holston_River_Rambler replied to John1122's topic in Tennessee Valley
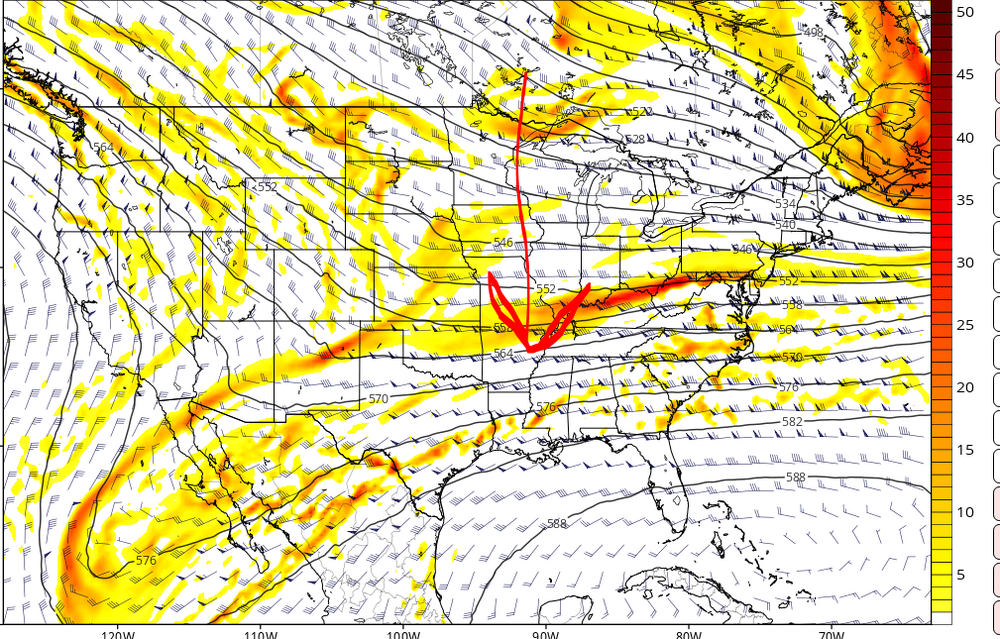
HRRR was keeping me and I 40 north snow overnight but has trended NW and warmer since 6z. Both RAP and HRRR have a warm nose between 850 and 750mb: HRRR: RAP" That's not a huge one, but it's there. Keep in mind this is also just for my area in and around Knoxville, and Oak Ridge. Just one county to the north near Oneida, both of the above models keep snow around, but it does look to me like there is a NW trend the past few runs of the Hi Res models. On to 12z. -
Central PA Fall Discussions and Obs
mahantango#1 replied to ChescoWx's topic in Upstate New York/Pennsylvania
We been through this before. Wasn't last year too we experienced this also? -
During the 1970s and 1980s NYC averaged around 6.2”more of snow than we have over the last 7 seasons and ISP 8.0” more. We didn’t have to rely exclusively on KU NESIS events back then like we do now to get over 20” of snow on the season. We used to get snowy clippers and SWFEs. Plus the colder climate allowed for heavier snows on the front end before mixing became an issue. We never experienced a climate before that was so challenging to get over 20” from EWR to NYC and ISP. Monthly Total Snowfall for NY CITY CENTRAL PARK, NY Click column heading to sort ascending, click again to sort descending. Mean 0.0 0.9 2.3 3.7 6.4 1.6 T 14.9 2024-2025 0.0 0.0 2.8 3.0 7.1 0.0 0.0 12.9 2023-2024 0.0 T T 2.3 5.2 T 0.0 7.5 2022-2023 0.0 0.0 T T 2.2 0.1 0.0 2.3 2021-2022 0.0 T 0.2 15.3 2.0 0.4 0.0 17.9 2020-2021 0.0 0.0 10.5 2.1 26.0 T 0.0 38.6 2019-2020 0.0 0.0 2.5 2.3 T T T 4.8 2018-2019 0.0 6.4 T 1.1 2.6 10.4 0.0 20.5 Monthly Total Snowfall for NY CITY CENTRAL PARK, NY Click column heading to sort ascending, click again to sort descending. Mean T 0.2 2.2 7.9 7.6 2.7 0.6 21.1 1988-1989 0.0 0.0 0.3 5.0 0.3 2.5 0.0 8.1 1987-1988 0.0 1.1 2.6 13.9 1.5 T 0.0 19.1 1986-1987 0.0 T 0.6 13.6 7.0 1.9 0.0 23.1 1985-1986 0.0 T 0.9 2.2 9.9 T T 13.0 1984-1985 0.0 T 5.5 8.4 10.0 0.2 T 24.1 1983-1984 0.0 T 1.6 11.7 0.2 11.9 0.0 25.4 1982-1983 0.0 0.0 3.0 1.9 21.5 T 0.8 27.2 1981-1982 0.0 0.0 2.1 11.8 0.4 0.7 9.6 24.6 1980-1981 0.0 T 2.8 8.0 T 8.6 0.0 19.4 1979-1980 T 0.0 3.5 2.0 2.7 4.6 T 12.8 1978-1979 0.0 2.2 0.5 6.6 20.1 T T 29.4 1977-1978 0.0 0.2 0.4 20.3 23.0 6.8 T 50.7 1976-1977 0.0 T 5.1 13.0 5.8 0.6 T 24.5 1975-1976 0.0 T 2.3 5.6 5.0 4.4 T 17.3 1974-1975 0.0 0.1 0.1 2.0 10.6 0.3 T 13.1 1973-1974 0.0 0.0 2.8 7.8 9.4 3.2 0.3 23.5 1972-1973 T T T 1.8 0.8 0.2 T 2.8 1971-1972 0.0 T T 2.8 17.8 2.3 T 22.9 1970-1971 0.0 0.0 2.4 11.4 T 1.3 0.4 15.5 1969-1970 0.0 T 6.8 8.4 6.4 4.0 T 25.6 Monthly Total Snowfall for ISLIP-LI MACARTHUR AP, NY Click column heading to sort ascending, click again to sort descending. Mean T 0.6 2.1 6.0 7.1 1.0 T 16.8 2024-2025 0.0 0.0 2.1 2.7 6.9 0.0 0.0 11.7 2023-2024 0.0 T T 3.1 7.8 0.0 0.0 10.9 2022-2023 0.0 0.0 0.4 T 3.0 1.6 0.0 5.0 2021-2022 0.0 T 0.3 31.8 3.3 1.6 0.0 37.0 2020-2021 T 0.0 7.5 1.1 24.9 T T 33.5 2019-2020 0.0 0.1 4.2 2.5 0.0 T T 6.8 2018-2019 0.0 4.3 T 0.9 3.5 4.1 T 12.8 Monthly Total Snowfall for ISLIP-LI MACARTHUR AP, NY Click column heading to sort ascending, click again to sort descending. Mean T 0.3 3.3 8.8 8.5 3.0 1.0 24.8 1988-1989 0.0 0.0 10.4 4.4 1.2 3.0 T 19.0 1987-1988 0.0 1.1 4.2 10.7 0.1 3.4 0.0 19.5 1986-1987 0.0 T 3.4 8.8 8.6 1.7 0.0 22.5 1985-1986 0.0 T 2.1 2.6 10.4 0.1 T 15.2 1984-1985 0.0 T 4.7 13.5 8.7 T T 26.9 1983-1984 0.0 T 2.6 11.9 T 13.0 0.0 27.5 1982-1983 0.0 0.0 3.2 1.5 26.1 T 1.1 31.9 1981-1982 0.0 0.0 1.0 18.1 0.3 T 16.0 35.4 1980-1981 0.0 T 0.5 13.2 T 7.1 0.0 20.8 1979-1980 T 0.0 1.5 4.0 1.5 2.0 0.0 9.0 1978-1979 0.0 4.0 T 6.9 17.2 T T 28.1 1977-1978 0.0 0.8 0.2 27.7 28.9 10.4 T 68.0 1976-1977 0.0 T 6.2 11.2 6.6 4.0 0.0 28.0 1975-1976 0.0 T 11.0 7.8 7.5 3.9 0.0 30.2 1974-1975 0.0 0.5 T 1.8 11.0 1.2 T 14.5 1973-1974 0.0 0.0 T 9.0 17.0 8.0 T 34.0 1972-1973 T 0.0 T 1.5 3.0 T T 4.5 1971-1972 0.0 T T 2.1 12.5 1.0 T 15.6 1970-1971 0.0 0.0 2.1 11.3 2.0 1.0 2.5 18.9 1969-1970 0.0 T 12.0 7.0 7.0 1.0 T 27.0
-
Only have one run of the retiring NAM on our side.. what could go wrong lol
-
I wouldn’t say it’s a miracle. We don’t live in the Carolinas. We average in the mid 20s inches per winter even right on the coast. We were due for a significant regression after the bonanza 2000-18 period but it’s become a lot harder to get the 2-4” type clippers and front end to rain events in the last few years as well. Bluewave and others have pointed out the background changes that have taken place that have made even fairly minor snow events less common. Even back during the bonanza years we lucked out with the big snow events that pushed us over the long term average. Without the minor events, we totally strike out and end well below average for snow.
-

Central PA Fall Discussions and Obs
Blizzard of 93 replied to ChescoWx's topic in Upstate New York/Pennsylvania
Looks like a very cold night tonight! Unfortunately for us, the light event tomorrow is not getting north of BWI, but good to see those folks getting the chance to score a little snow. This coming week we need to see if we can get some table scraps from any of these Clippers. The advertised pattern for the next few weeks should keep us mostly in the game. Hopefully it’s just a matter of time before we are back to tracking a specific chance for more snow. -
GREENFIELD NO. 3, its been around since the late 90s at least. i see it everytime im looking for COOP reports for all the past storms. Back then all there was, was COOP data, cocorahs didn't exist yet.
-
2000-2001 central park had 35 inches. I believe the 30 year average at that time was approx 27 so slightly above average. 2008-2009 central park had 27.6, which at that time I believe that average was approx 28 so basically average. 2007-2008 was only 11.9 so a dude. So IF we only took those three examples an equal chance of above, average and below snowfall.
-
I would say north of Danville. More like Lynchburg.
-
yeah I am leaning more in the Danville direction for now. Worst case is I get wrecked on slots at Caesars.