All Activity
- Past hour
-
 You can always cancel if it looks bad.
 -
Picked up 0.89” here, which isn’t as much as I thought. I was in the city last night and they definitely got more.
-

Chester County PA - Analytical Battle of Actual vs. Altered Climate Data
chubbs replied to ChescoWx's topic in Climate Change
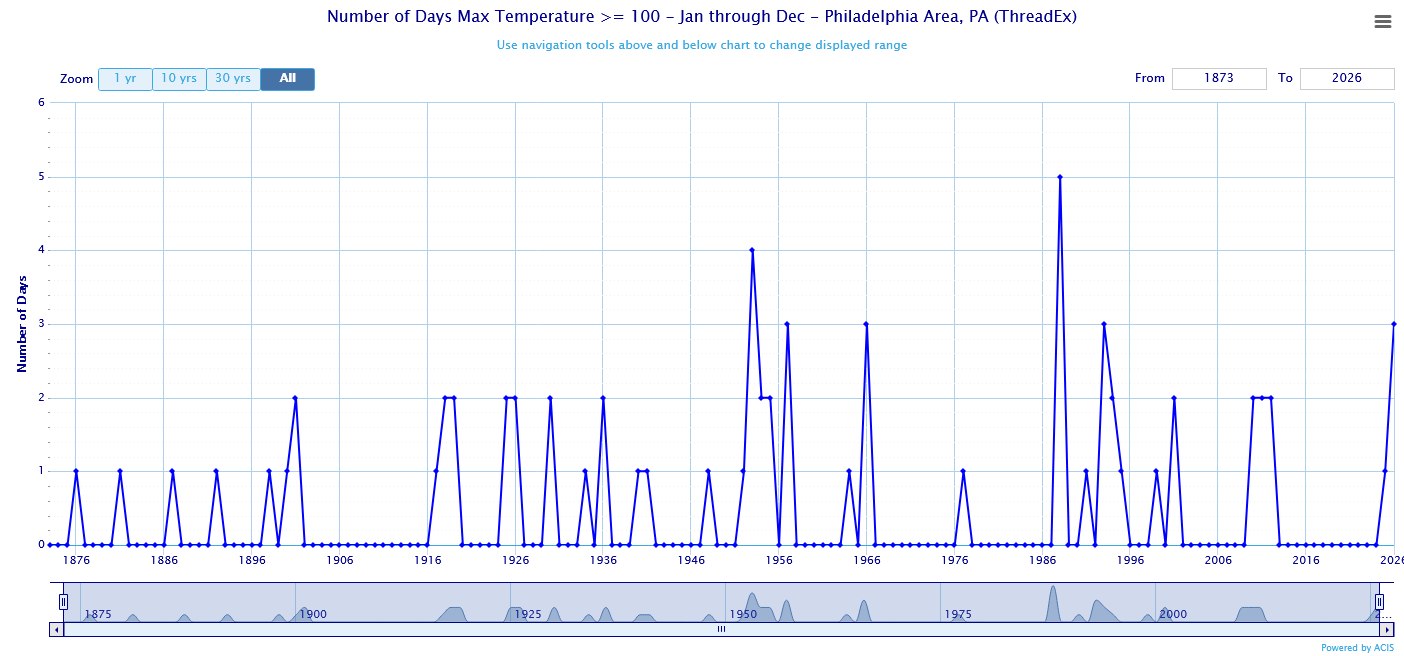
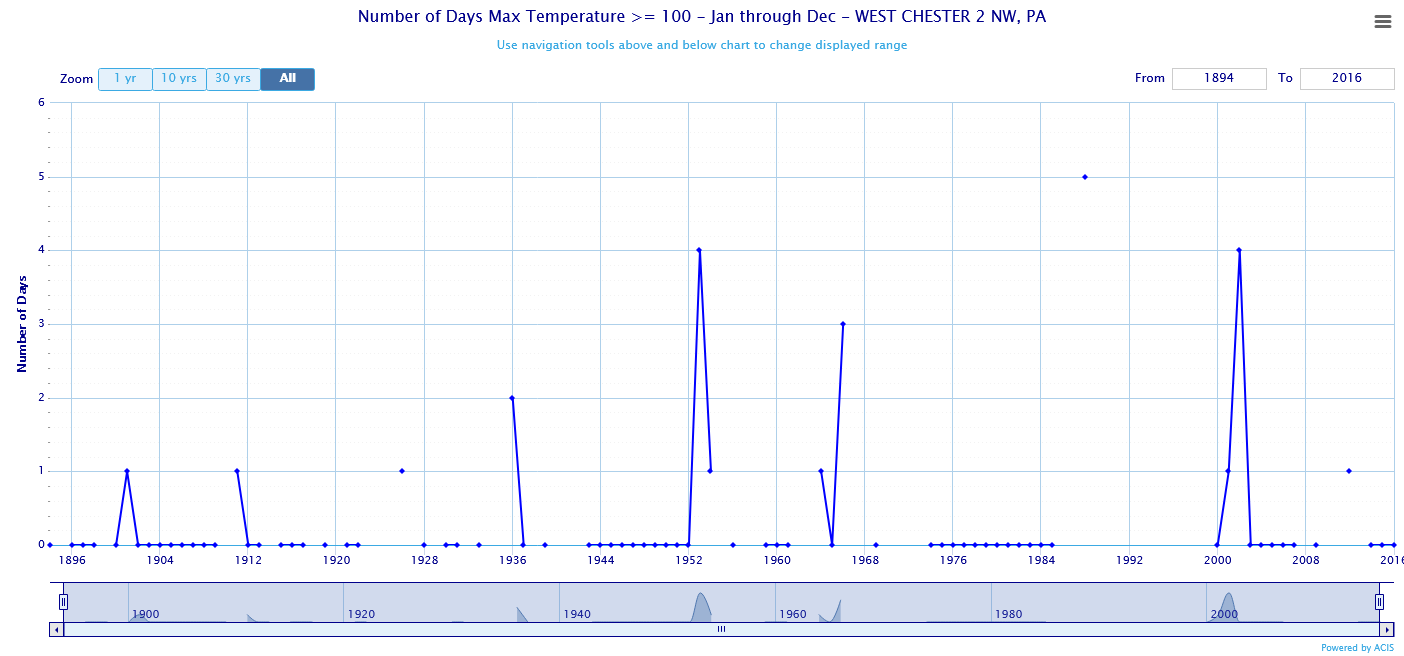
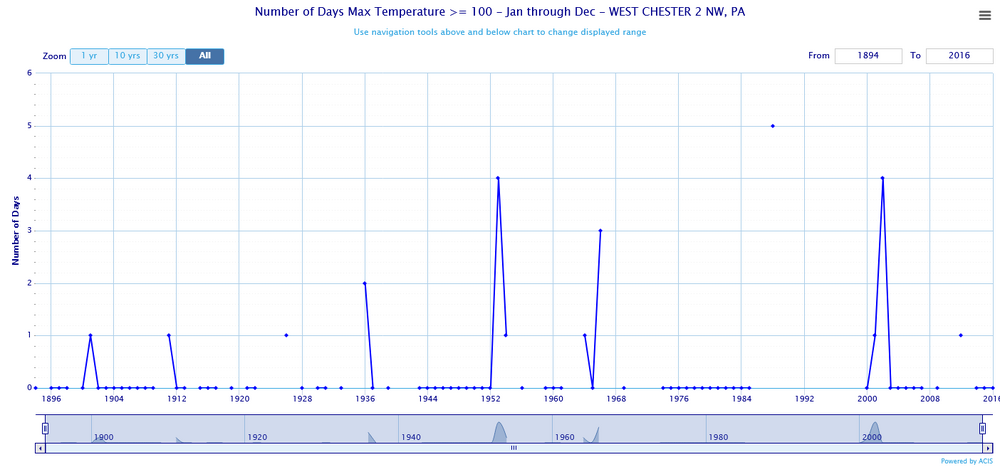
Nope no dust bowl in Chester County, just Phoenixville with a bad shelter location. Philadelphia and West Chester don't agree at all with your plot. Not surprising since once again you are confounding station changes and weather. East Nantmeal and West Grove are a little different than the City of Coatesville or West Chester don't you think?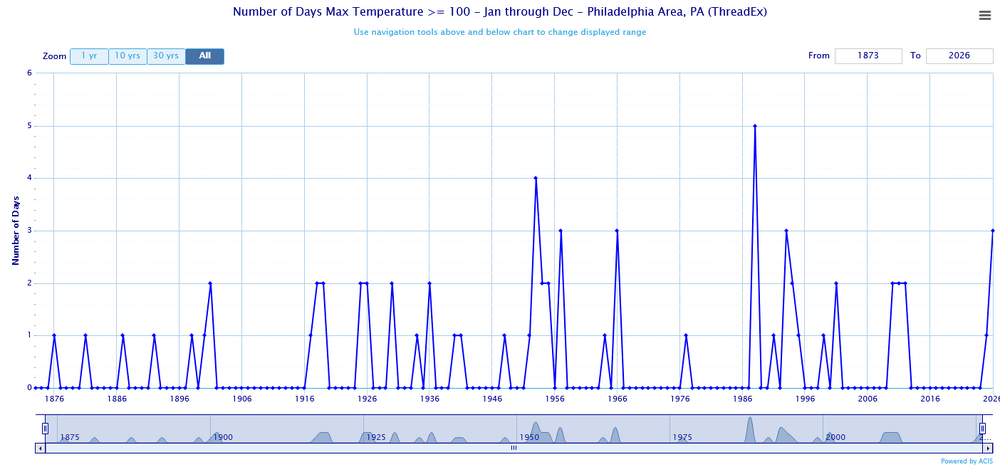
-
Congrats north, south, east, and west of me. .60 here while just about everyone received 3-6". Ugh the boring drought continues in my area. I'm going to have to start chasing rain events. So bored. I can't wait until LES season lol
-
 Pft. 0.34". Sent from my SM-S921U using Tapatalk
 -
 Glad to see we both could get in on the action. I’m a little to your southwest, on the norwell/scituate line. This was def a much needed soaker for the south shore and much of eastern ma too!
 -
 What a deluge of rain this morning in my area of NS. Looks like another heavy slug later this morning also. Certainly not the dry summer we had last year..
 -
Chester County PA - Analytical Battle of Actual vs. Altered Climate Data
chubbs replied to ChescoWx's topic in Climate Change
Clear that you do not understand the science behind bias adjustments. Bias adjustments are not made in an ad hoc manner or to raise or lower the temperature of a station. Bias adjustments are only made to correct station changes. If the station observation time doesn't change, then no adjustment is needed. Adjustments are based solely on raw data. A station has to change with time in a manner that is different from all other stations that experience the same weather. The goal is to include weather and exclude station changes when calculating long-term climate trends. The only way to evaluate bias adjustments is to inspect raw station data at the time of the station change. Here's an example using the West Chester 1970 move. The old West Chester COOP shut down in December of 1969 and re-opened in May of 1970 at a new location. Subtracting Coatesville from West Chester isolates the relative temperature changes at the two stations at the time of the move. The raw data shows that the new West Chester site cooled by significantly relative to Coatesville after the move. That's all the proof needed to identify a major station change at either Coatesville or West Chester. We know from raw data from Phoenixville that West Chester is the guilty party. The Chesco raw data clearly shows that West Chester cooled significantly after its 1970 move. The NOAA bias adjustment is in complete agreement with the raw data from Coatesville and West Chester. That shouldn't be surprising. NCEI is using all the raw data that experiences the same weather as West Chester, hundreds of stations potentially. I've looked at multiple large station changes at the Chesco COOPs and NCEI nails every one. Note that NCEI is asking a similar question as your AI analysis. Does West Chester respond to local May 1970 weather in the same as the other regional stations? However the NCEI procedure is much more targeted than AI, is using more data, and it is using the right conceptual model. The temperatures at West Chester do not vary independently of the temperatures at Coatesville or other stations. This gives the NCEI analysis much more power. It can correctly flag the West Chester move as a major station change. While your AI analysis can not. The raw data is the final arbiter and in this case NCEI is clearly superior to AI.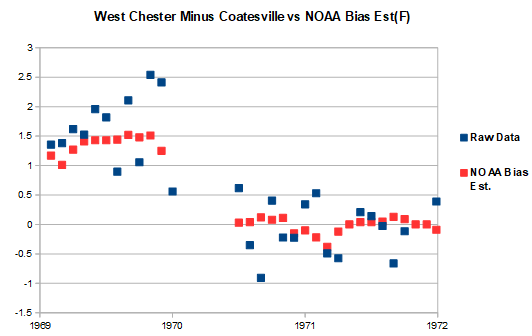
- Today
-
 Some good news! Average temps have maxed out and we start trending downward again!
 -
 Cialis over the counter: Cheap Cialis - PrecisionRX
 -
 Cape cod getting rocked again in another couple hours
 -
catastrophic flooding in central WV.
-
0Z UKMET: similar to 12Z with a TS passing just S of Galveston at hour 45 heading W with a 999 mb 44 knot winds then with most of the rain in the S quadrant; the remnant inland low then moves SW TROPICAL STORM BERTHA ANALYSED POSITION : 29.2N 87.5W ATCF IDENTIFIER : AL022026 LEAD CENTRAL MAXIMUM WIND VERIFYING TIME TIME POSITION PRESSURE (MB) SPEED (KNOTS) -------------- ---- -------- ------------- ------------- 0000UTC 22.07.2026 0 29.2N 87.5W 999 42 1200UTC 22.07.2026 12 29.3N 88.3W 998 37 0000UTC 23.07.2026 24 28.5N 90.4W 997 40 1200UTC 23.07.2026 36 28.8N 92.7W 998 44 0000UTC 24.07.2026 48 29.0N 95.9W 1002 31 1200UTC 24.07.2026 60 27.6N 99.2W 1006 26 0000UTC 25.07.2026 72 CEASED TRACKING
-
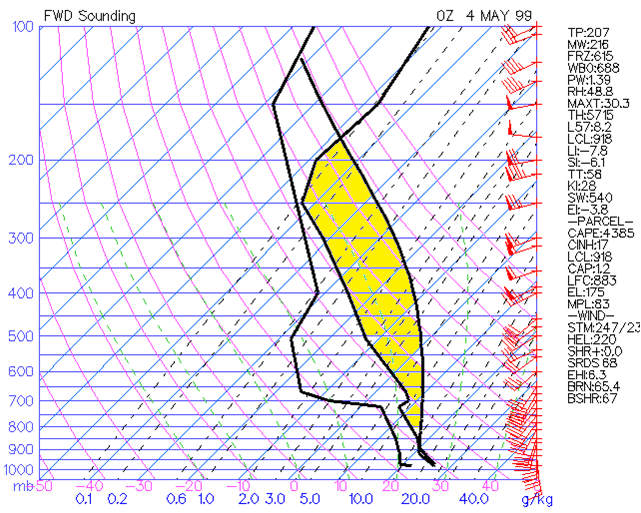
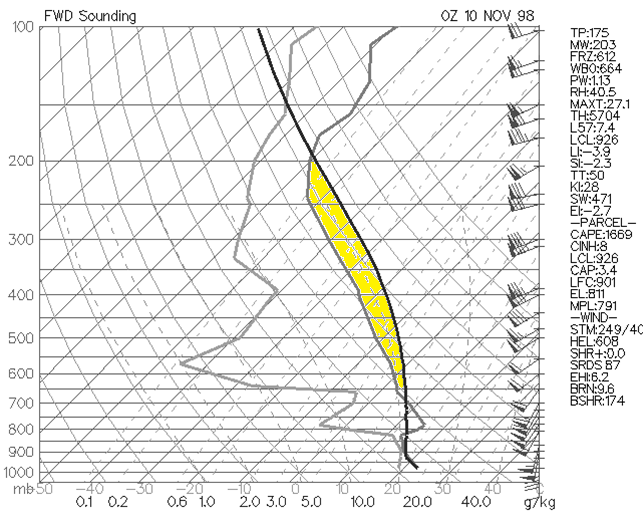
I am not versed in the exact physics of the processes, but I can say this. "Fat" CAPE on a sounding plot is not the same as "skinny" CAPE. "Fat" CAPE promotes more rapid updraft acceleration (image 1), and "skinny" CAPE promotes less rapid updraft acceleration (image 2). If you want svr wx, "fat" CAPE is more conducive to produce it. "Skinny" CAPE is better for heavy rainfall and flash flooding potential.
- 1,446 replies
-
- 1
-

-
- severe
- thunderstorms
- (and 7 more)
-
.thumb.jpg.6a4895b2a43f87359e4e7d04a6fa0d14.jpg)
Central PA Summer 2026 Discussion/Obs Thread
Yardstickgozinya replied to Voyager's topic in Upstate New York/Pennsylvania
The Great Chuck Chodes wouldn't have screwed it up this bad. Speaking of the king, he had a term for this kind of storm behavior. I believe he called it circle jerking the Commonwealth, but I could be mistaken.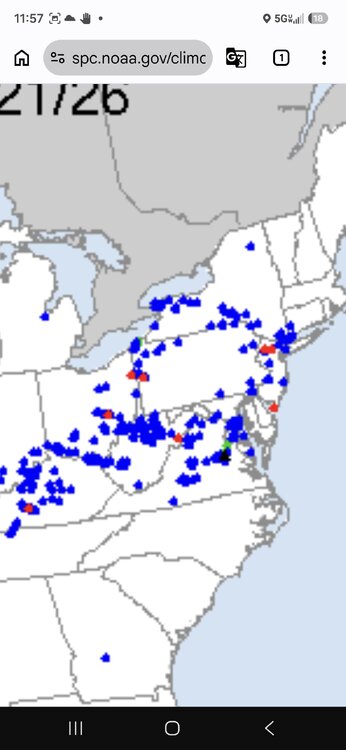
-

2026 Mid-Atlantic Severe Storm General Discussion
WEATHER53 replied to Kmlwx's topic in Mid Atlantic
Some of the details of the upward column is like two hoses but of different sizes so the flows are different? -

2026-2027 Super El Nino
snowman19 replied to Stormchaserchuck1's topic in Weather Forecasting and Discussion
+AAM as far as the eye can see In other news, +IOD forecasts continue to go up…. -
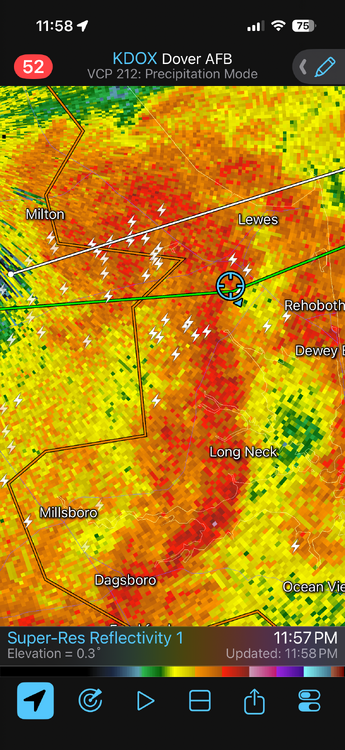
Getting some quality thunder and lightning over here.House shakers.
-
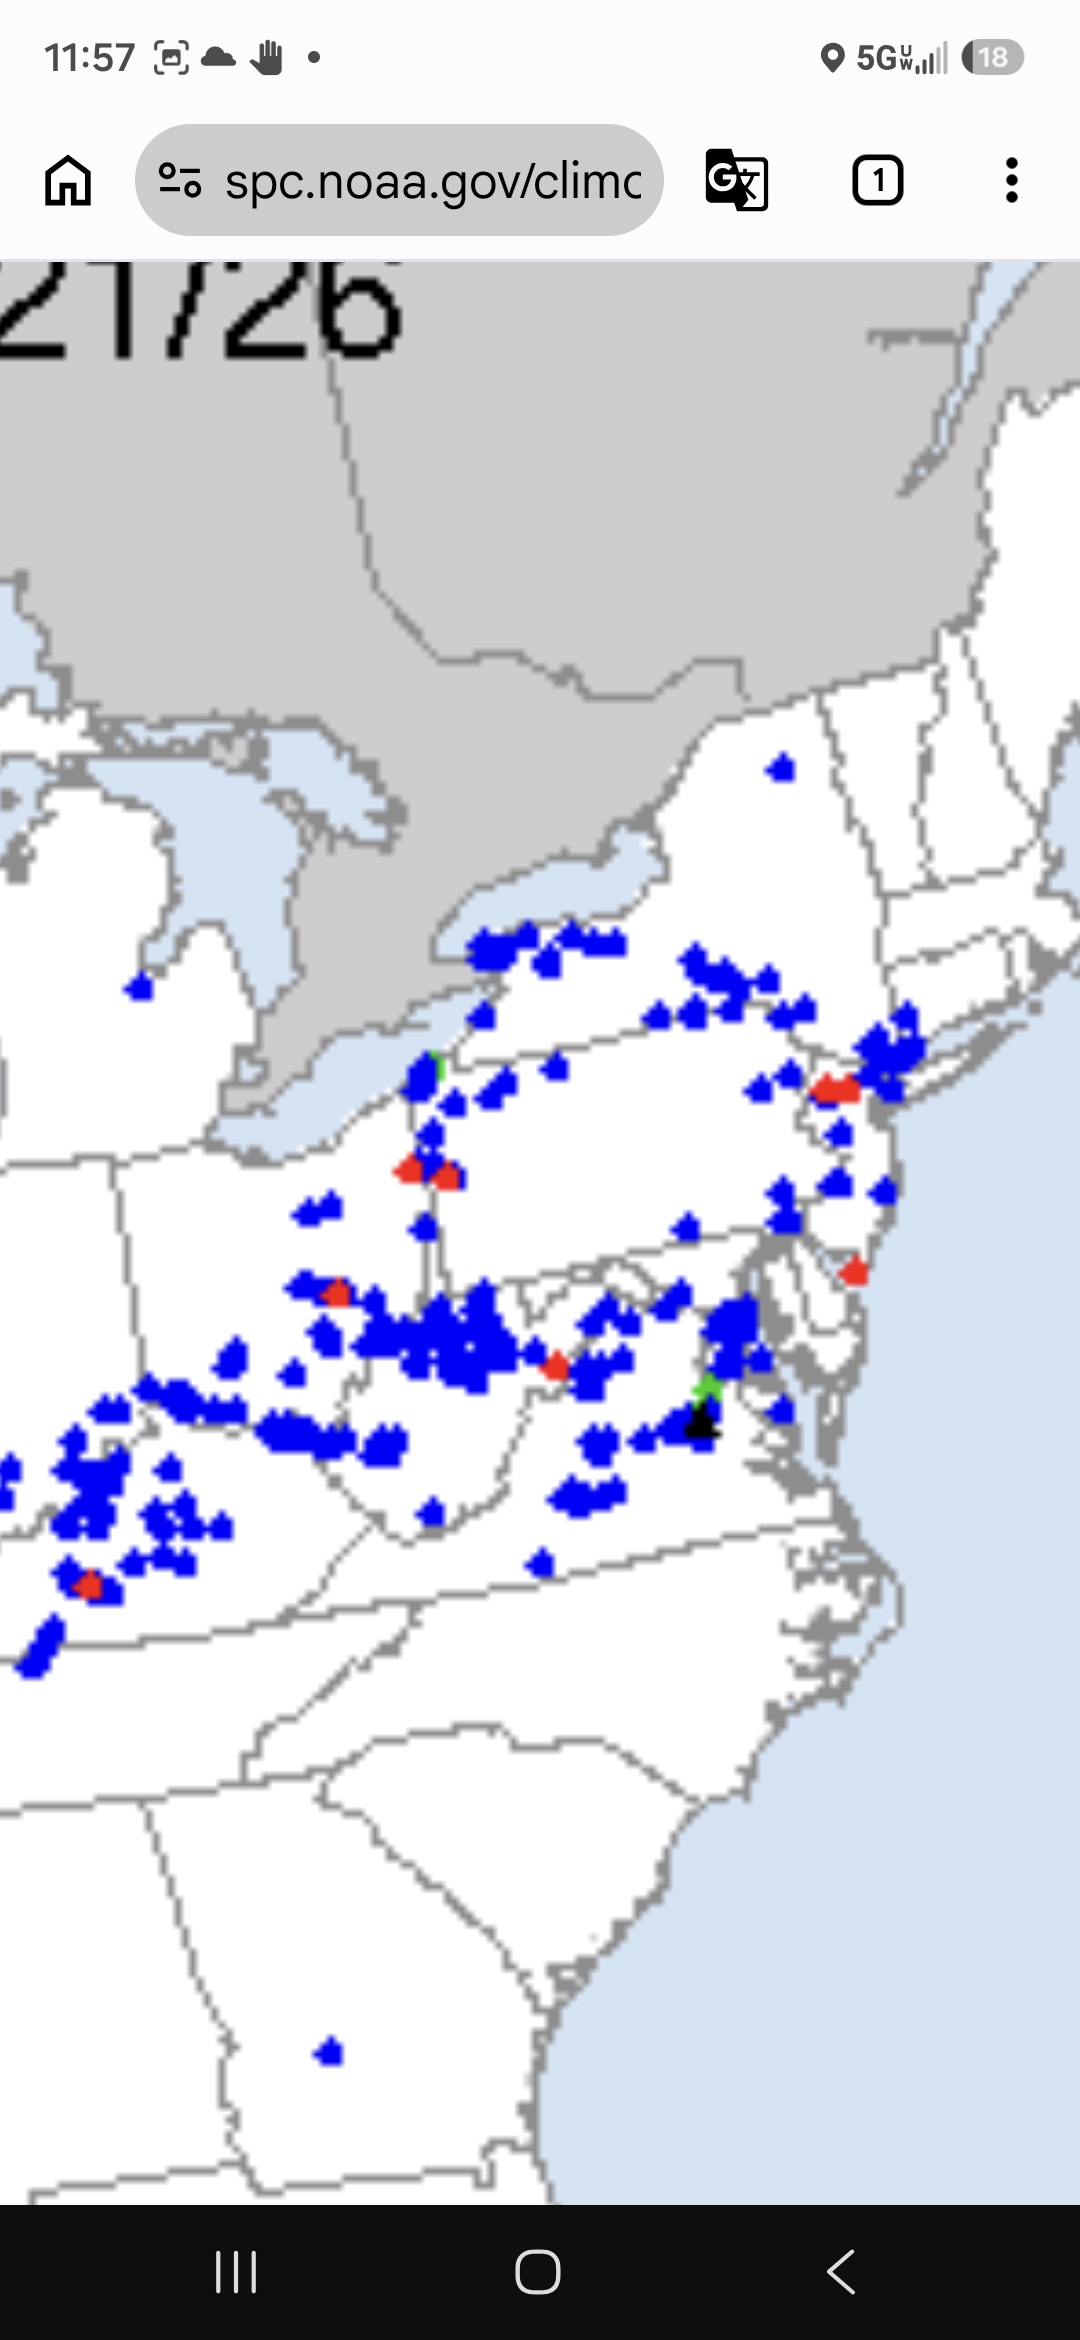
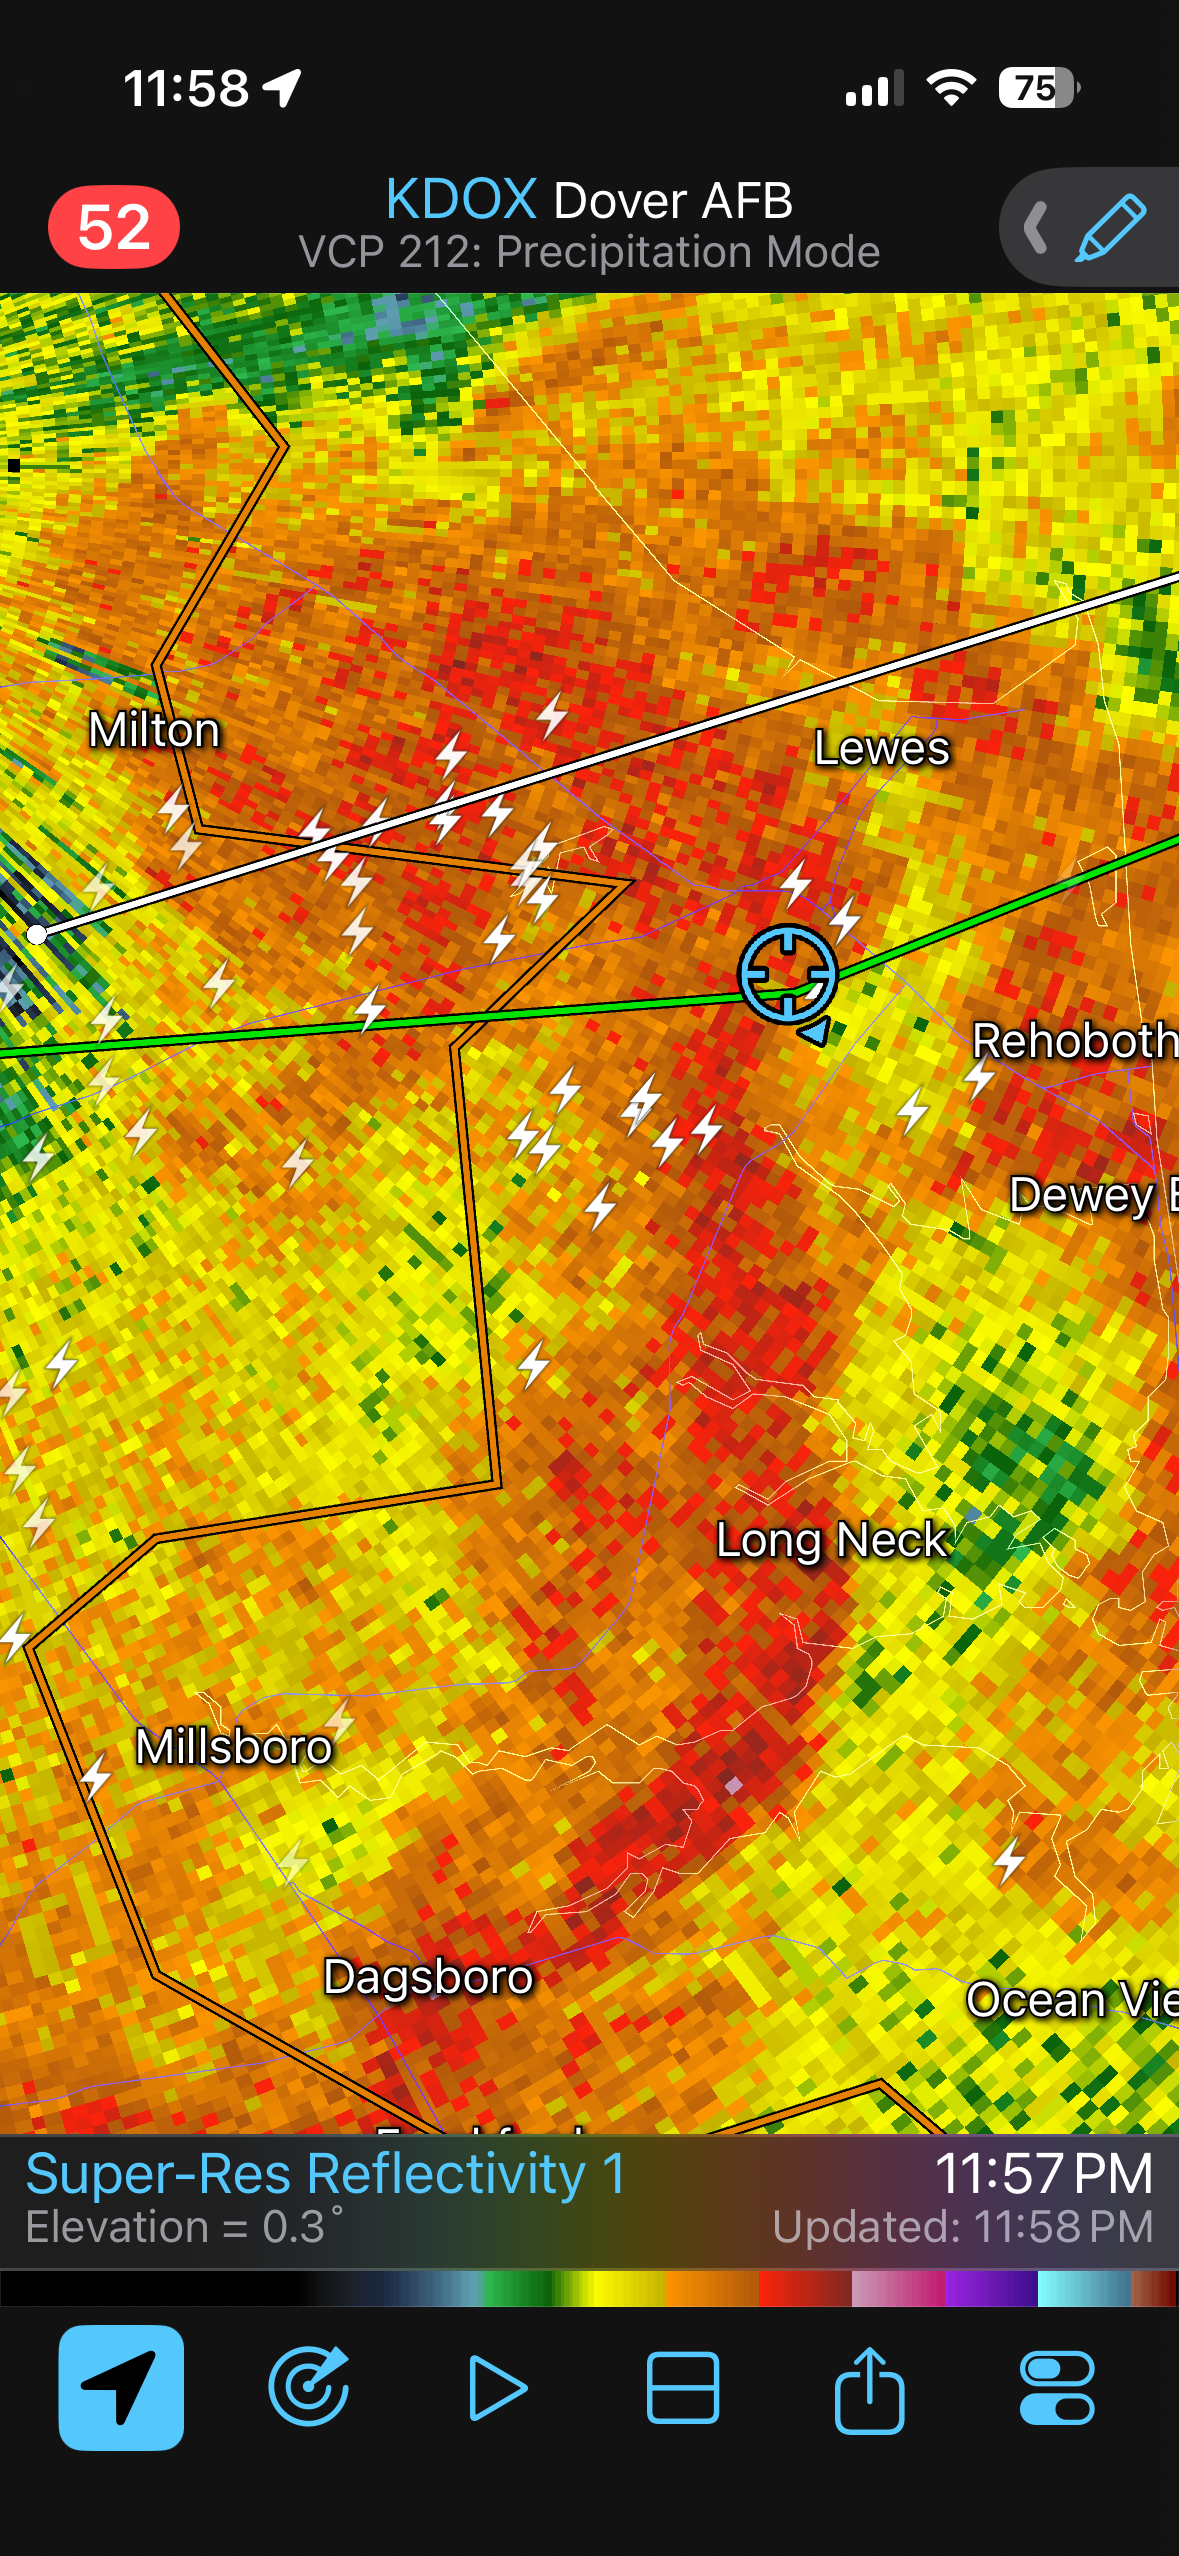
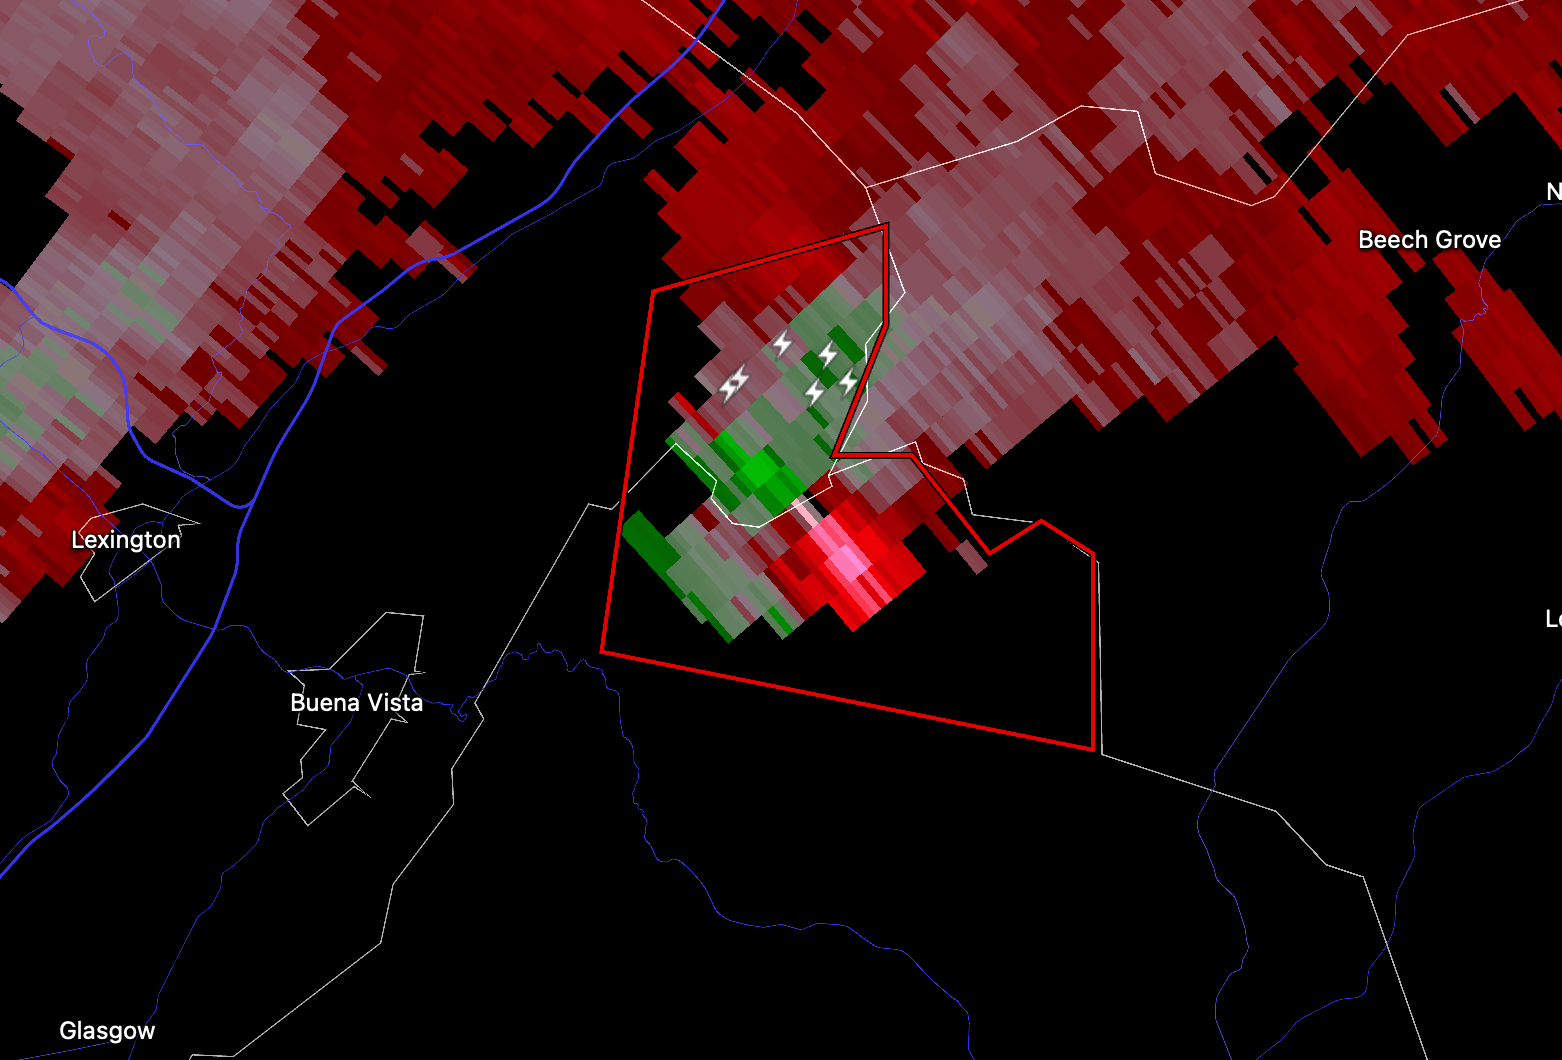
Are these things ever going to end today? TORs issued this late in the evening for an approaching cold front are not common these parts, but we are dealing w/ a rather strong 500 trof for summer and a decent 250 speed max in the area. And that's not something borderline either! Small but quite intense mesocyclone.
- 1,446 replies
-
- 1
-

-
- severe
- thunderstorms
- (and 7 more)
-
2026 Mid-Atlantic Severe Storm General Discussion
midatlanticweather replied to Kmlwx's topic in Mid Atlantic
Man, that warned cell in West central VA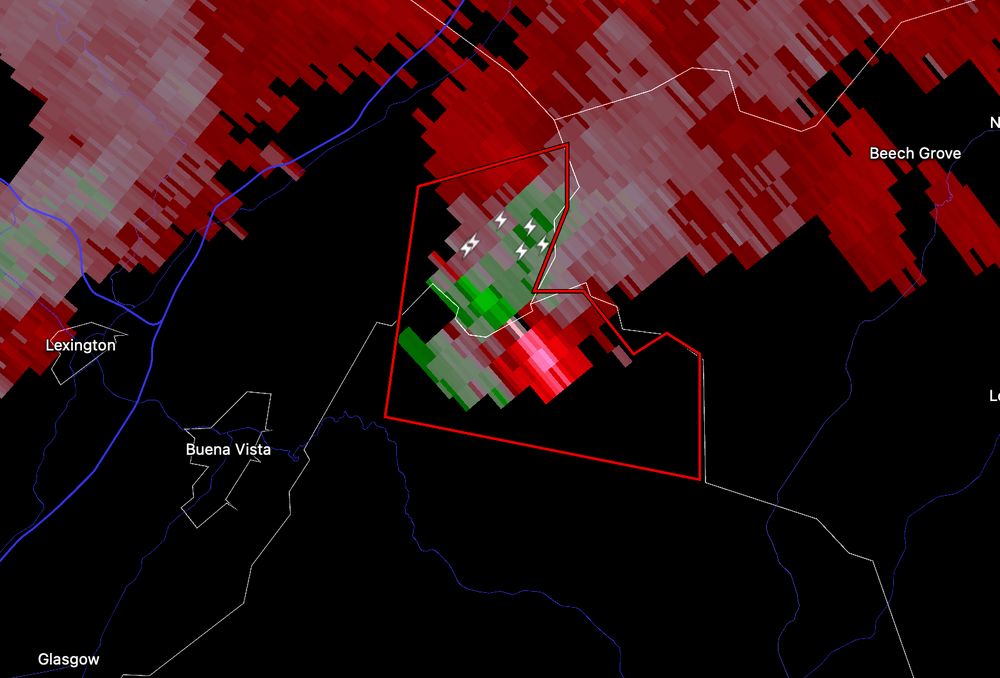
-

2026 Mid-Atlantic Severe Storm General Discussion
AlexD1990 replied to Kmlwx's topic in Mid Atlantic
Tornado warning wicomico county -
https://www.instagram.com/reel/DbFAX4RuIus/?igsh=eDZxcTJwNmdmaG8x
-
It not easy b/c it depends on the CAPE distribution in the vertical column. In other words, you can't apply one updraft value at all levels of the atmosphere where there is CAPE b/c the amount of CAPE can vary a lot depending on the level you are at. Total CAPE does not necessarily tell the entire story as to full updraft potential. Yes, generally more the CAPE the better, but it does not always mean the same type of svr wx or even things like lightning frequency or most efficient rainfall rates. And CAPE (hence updraft potential) is almost never realized fully by a storm, b/c of 1) dry air entrainment and 2) precip loading. And it goes one step further. Updraft strength is also dependent on pressure perturbations induced by a mesocyclone. For instance, mesocyclones are typically strongest at mid-levels. So you actually have lowest pressure here. This results in dynamic uplift b/c of the pressure deficit aloft. Now, this is superimposed on CAPE that is present. A mesocyclone present can effectively double the updraft strength that would exist just from CAPE alone, which is why supercell updrafts are so intense. More CAPE down at low-levels is better for tornadogenesis b/c you increase updraft acceleration potential where it matters most (stretching of a vortex). That's why we look at how much CAPE exists 0-3 km for one ingredient for tornado potential. I'm just scratching the sfc here, but you get the idea. It's hard to set nice, neat values in a given atmosphere due to so many factors.
-
A stunning 1.3 which is more than the whole month of July before this! It's also the most rain at one time since I moved to the southern MD desert. We'll need more in the next couple weeks to avoid a seventh straight below normal month.
-
Cape May only had 0.71" for the entire month before today. There up to 2.83" for today, including 1.89" for the past hour and the radar is still training over that area. Amazing how you can get a lot of it back within a short time frame.