All Activity
- Past hour
-
I find that hard to believe. I'm not sure these guidance have a very good clue there. Why? they are less reliable when climate is in fact in a state of aggressive d(C) so the averages are moving. I just think these seasonal tools with climatology baked into them when we have global temperature surges that were also, not predicted by climate models - that's a wee bit of hint there, huh - happening, whilst also we are entering a winter already at historic global thermal state. These have implicated the climate modeling system already... I also am suss that the subtropics are going to lose the global thermal anomaly around those latitudes so readily. This is likely to fall on deaf ears ... because it's lowering the potency of d-drip, I know ... but I'd be cautious with that.
-
2026-2027 Record-breaking El Nino
40/70 Benchmark replied to Stormchaserchuck1's topic in Weather Forecasting and Discussion
If you were to fathom a scenario that would at long last, reposition that dreaded west-warm pool, this is it. -
-
Records: Highs: EWR: 97 (1983) NYC: 97 (1955) LGA: 98 (1955) JFK: 100 (1983) Lows: EWR: 52 (1949) NYC: 55 (1949) LGA: 58 (1949) JFK: 55 (1949) Historical: 1794: The "Battle of Fallen Timbers" took place on the Maumee River in northwestern Ohio at the sight of a windfall from a tornado. (Ref. Wilson Wx. History) 1816: The “Year Without a Summer” continued as hard frost occurred in much of New England. Frost was seen as far south as Connecticut. (Ref. Wilson Wx. History) 1863: A tornado struck Charlestown Navy yard, east Boston, MA. (Ref. NOAA Boston Weather Events) 1886 - The 1886 Indianola Hurricane destroyed the town of Indianola, Texas and as such had a significant impact on the history and economic development of Texas. The storm ended the rivalry between Galveston and Indianola as the chief port of Texas. With the abandonment of Indianola and the unwillingness of the former residents to rebuild close to shore, Galveston became the essential Texan port until the 1900 Galveston Hurricane led to the rise of Houston as a major port. It was the fifth hurricane of the 1886 Atlantic hurricane season and one of the most intense hurricanes ever to hit the United States. 1904: A destructive, estimated F4 tornado moved east-southeast from 7 miles west-northwest of Willow Lake, SD through the town, and on into Bryant, SD. All buildings on at least three farms were blown away. One woman died in Bryant, as the tornado swept across the residential west side of town. Another man was killed just west of Willow Lake, as his farm house was scattered for miles. (Ref. Wilson Wx. History) 1910 - The big blow up of forest fires finally came to an end in Idaho. A record dry August fueled 1736 fires which burned three million acres destroying six billion board feet of timber. The fires claimed the lives of 85 persons, 78 of which were fire fighters, and consumed the entire town of Wallace. The smoke spread a third of the way around the world producing some dark days in the U.S. and Canada. The forest fires prompted federal fire protection laws. (David Ludlum) 1928 - A tornado estimated at F4 intensity initially touched down in Winnebago County, Iowa, moved to Freeborn County, Minnesota, and hit the south side of Austin, MN. Five of the six deaths were in Austin with 60 injuries. 1939: On the 19th and 20th the remnants of a tropical storm dumped 14.81 inches of rain on Tuckerton, NJ on the 19th and 20th. That remains the state's greatest 24-hour rainfall at an official weather observation station. (Ref. Hurricane Map and NWS Monthly Weather Review ) 1950: Canadian high pressure brought record low temperatures for the date. The following locations reported record low temperatures for August: Owen, WI: 28°, Blair, WI: 33°, Cresco, IA 34°, Platteville, WI: 38°, Trempealeau, WI: 40°, Alma, WI: 42°, Quincy, IL: 42° and Lynxville, WI: 44°. (Ref. Many Additional Temperatures Listed On This Link) 1955: Diane flood highest in state since 1942; Wisconsin Ave. gauge at 8.75 ft Diane's Storm Track - NOAA. Gov.- National Hurricane Center 1969: Camille on the 20th had 27.00 rain in Nelson Co., VA. 24 hour record 113 drowned. No warning was issued but this would have made little difference since most were asleep as houses were destroyed. It was said that the rain was so heavy that birds, which have nostrils on the tops of their beaks, drowned while perched on trees. The James River in Richmond, VA at Westham crested at 24.8 feet or Richmond's 3rd worst flood. June of 1972 after Hurricane Agnes the crest was 28.62 feet which was Richmond's second worst flood, the worst flood was May 27th, 1771. After this event, the total damage from Camille was $1.4 billion dollars. Camille in Virginia - Wikipedia.org (Ref. More About Hurricane Camille)(Ref. for River level) 1983: The remnants of Hurricane Alicia brought heavy rain and flooding to parts of southern and central Oklahoma. Rainfall of 4 to 6 inches in less than 6 hours occurred in the Oklahoma City metropolitan area, the hardest hit part of the state. Major flooding occurred west of El Reno, while high water crept into a few buildings at the University of Oklahoma campus in Norman. (Ref. Wilson Wx. History) 1983: The temperature at Greenville, GA reached 112 °F to establish a state maximum temperature record for Georgia. (Ref. Lowest and Highest Temperatures for the 50 States) 1987 - Half a dozen cities in the Central Plains Region reported record high temperatures for the date, including Pueblo CO with a reading of 102 degrees, and Goodland KS with a high of 104 degrees. Hill City KS reached 106 degrees. (The National Weather Summary) 1988 - Sheridan, WY, reported a record hot temperature reading of 100 degrees. Evening thunderstorms produced golf ball size hail near Fortuna ND, and wind gusts to 70 mph near Webster SD. (The National Weather Summary) (Storm Data) 1989 - Early morning thunderstorms produced heavy rain in southeast Kansas and northeastern Oklahoma, with up to six inches reported around Tulsa OK. Some roads in the Tulsa area were closed by water 10 to 12 feet deep. Evening thunderstorms produced severe weather in northern Oklahoma and southern Kansas. Thunderstorms produced winds gusts to 75 mph in Major County OK, and hail two inches in diameter at Jennings KS. (The National Weather Summary) (Storm Data) 1992: Tropical Storm Andrew continued his struggle to maintain himself near 22N/63W as strong upper level winds from a cold upper low to its north sheared the convection. Despite Andrew's broad, poorly organized center with a lowest sea level pressure of only 1015 millibars or 29.97 inches of mercury, an Air Force reconnaissance plane still found sustained 80 mph winds at the 1500 foot level in the northeastern quadrant of the storm. Andrew managed to hold his own and once the wind shear abated late on the 21st, the storm began a rapid intensification curve. Andrew eventually became a strong category five hurricane that went on to devastate south Florida as a massive high pressure area built to Andrew's north and steered him westward. Temperatures fall into the 30s in some rural areas in Michigan during the coldest August on record at Grand Rapids. Record lows for the day include 42° at Muskegon, MI and 43° at Grand Rapids, MI. (Ref. Wilson Wx. History) 1997: One of the worst floods in history for parts of southern New Jersey occurred as heavy thunderstorms dumped torrential rain from Delaware into southeastern New Jersey. 11.12 inches of rain at Atlantic City, NJ shattered their record precipitation for the date and for any single date. The rains brought the total for the month to 15.74 inches which broke the old monthly record set in 1967. At the marina in Atlantic City, just 10 miles from the airport, only 2.60 inches fell. 3.17 inches of rain fell in one hour at the airport. The airport and almost every road in the area were closed. (Ref. AccWeather Weather History) 2001: Double jeopardy or triple jeopardy at South Carolina's Isle of Palms, lightning struck the CB antenna of a pickup. When the driver stepped out of the truck to check the damage another bolt hit the bed of the truck throwing him onto the highway but but he wasn't hit and survived. (Weather Guide Calendar with Phenomenal Weather Events 2007 Accord Publishing, USA) Two farmhands in a three-sided, metal, calf-feeding pen were killed by lightning on a farm near Remington in Fauquier County, VA. (Ref. Lightning - Virginia Weather History)
-
Central PA Summer 2026 Discussion/Obs Thread
pawatch replied to Voyager's topic in Upstate New York/Pennsylvania
66 degrees I guess we will see what the rain gods deliver. -
73 / 67 sunny. Clouds pushing into C/E PA and should move in between 9 - 1030 AM. The we watch for where the heaviest showers/storms and rain which looks like a widespread 1 - 4 inches locally. A brief reprieve from the unsettled weather tomorrow/Friday before a cloudier / stormy and potential 1-2 inch rain Sunday night into Monday. Beyond there below normal through the 26th/ Moderation to normal 8/27 to close the month.
-

2026 Mid-Atlantic Severe Storm General Discussion
RickinBaltimore replied to Kmlwx's topic in Mid Atlantic
Ok, so North Point by Kane will be flooded. Duly noted. -
0.01” shower to kick off the day
-

Augdewst 2026: Summer's Last Stand
Damage In Tolland replied to Prismshine Productions's topic in New England
south
-
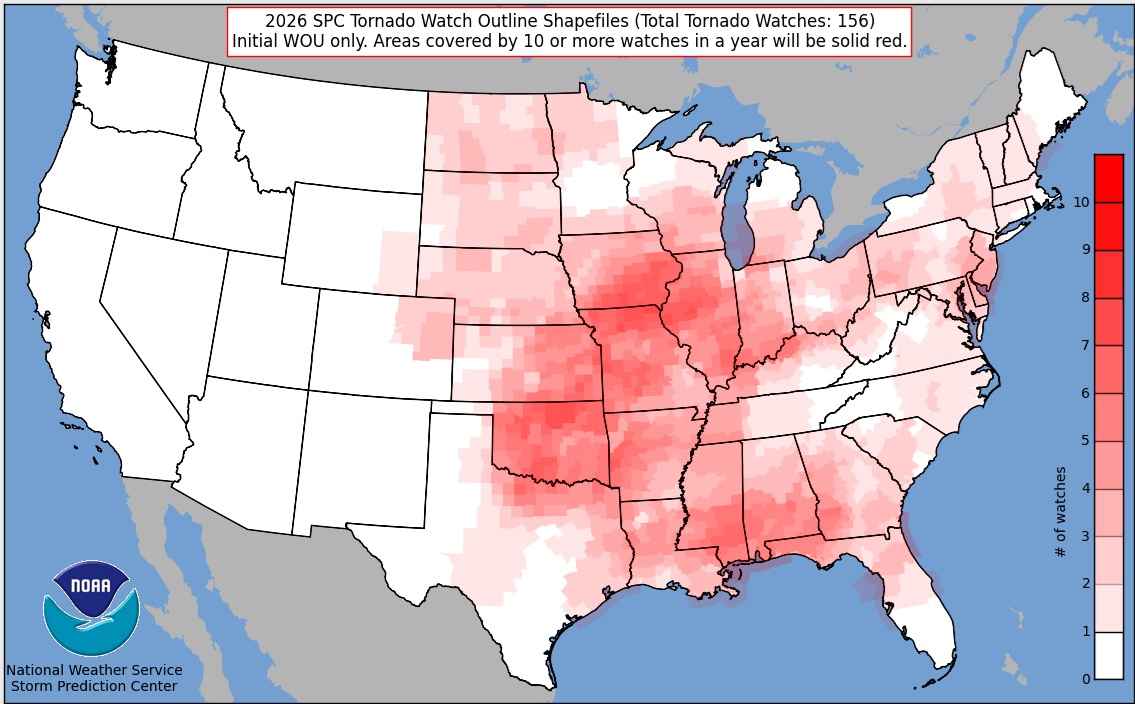
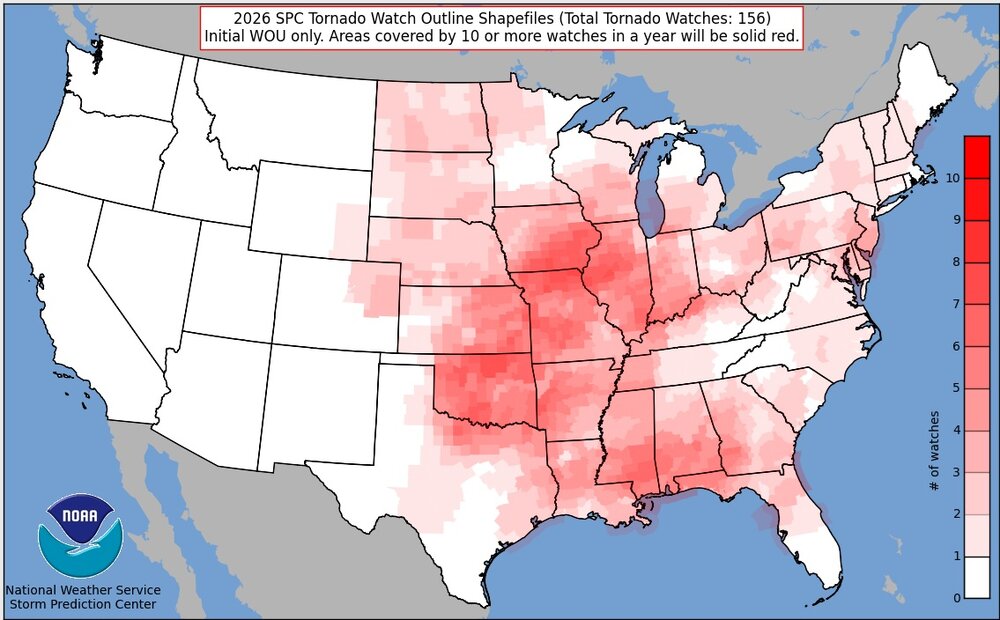
Kind of interesting that Illinois doesn't really stand out on the tornado watch summary map.
-
Sneaky shower complex caught even me off guard, looked at the radar and it was coming in from the West . I don't believe this was in the forecast I hope I get surprised by a few snow squalls doing the winter
-
This season is more conformation that the a long term regime shift occurred back in 2007. Thickness dramatically fell as the older sea ice melted. A June and July pattern like this season with deep low pressure north of Alaska before 2005-2007 would have resulted in a September minimum in the 6 to 8 million sq km range. But since the thickness was so low where the big Pacific side melt recently occurred, the area couldn’t hold the extent gains like it would have back in the colder climate era with thick multiyear ice more resistant to higher pressure and warmer recent conditions. https://www.nature.com/articles/s41586-022-05686-x Regime shift in Arctic Ocean sea ice thickness Manifestations of climate change are often shown as gradual changes in physical or biogeochemical properties1. Components of the climate system, however, can show stepwise shifts from one regime to another, as a nonlinear response of the system to a changing forcing2. Here we show that the Arctic sea ice regime shifted in 2007 from thicker and deformed to thinner and more uniform ice cover. Continuous sea ice monitoring in the Fram Strait over the last three decades revealed the shift. After the shift, the fraction of thick and deformed ice dropped by half and has not recovered to date. The timing of the shift was preceded by a two-step reduction in residence time of sea ice in the Arctic Basin, initiated first in 2005 and followed by 2007. We demonstrate that a simple model describing the stochastic process of dynamic sea ice thickening explains the observed ice thickness changes as a result of the reduced residence time. Our study highlights the long-lasting impact of climate change on the Arctic sea ice through reduced residence time and its connection to the coupled ocean–sea ice processes in the adjacent marginal seas and shelves of the Arctic Ocean The relationship between sea ice residence time in the Arctic Ocean and ice thickness distribution highlights the importance of coupled ocean–sea ice processes in the Alaskan and Siberian sectors of the Arctic (areas A and B in Fig. 3b). Several interrelated factors have become more prominent in the late twentieth century and have contributed to preconditioning the ocean–sea ice system before the stepwise changes in the ice formation areas: Arctic-wide rise of surface air temperature35, thinning of sea ice36, decrease of sea ice albedo37 concurrent with a reduction of multi-year sea ice38, increase of ocean heat flux through the Bering Strait39 and increase of the upper ocean heat content40. September sea ice concentration in the Siberian sector dropped below 40% in 2005 and the dramatic Arctic summer sea ice extent minimum occurred in 2007 (ref. 41). This series of events initiated intensive and widespread ice–albedo feedback in the Alaskan and Siberian sectors in the summer42,43, which resulted in a perennial increase of ocean heat content in areas of ice formation (Extended Data Fig. 1). After 2007, suppression of winter ice growth due to the accumulated ocean heat became conspicuous44 and the resultant thinner ice pack became more vulnerable to summer melt in the following year. Prolongation of the summer melt season promoted further ice–albedo feedback45 and has increased oceanic heat absorption in the summer7. Thus, summer ice extent and thickness in areas of ice formation has not recovered to the state before 2007 (Fig. 4c). In addition, continuing weakening of the cold halocline in the Siberian sector also influenced the upper ocean heat content46 and possibly slowed down ice growth offshore of the Laptev Sea in recent years17. Our analysis demonstrates the long-lasting impact of climate change on Arctic sea ice through reduced residence time, suggesting an irreversible response of Arctic sea ice thickness connected to an increase of ocean heat content in areas of ice formation. The large reduction of summer ice extent in the Alaskan and Siberian sectors in 2005 and 2007 triggered intensive ice–albedo feedback42,45 and initiated the perennial increase of ocean heat content in these areas44. This resulted in the stepwise reduction of residence time of sea ice in the Siberian sector of the Arctic, and hence a nonlinear response of the system. Before the shift, sea ice formed in and offshore of the Siberian shelves overwintered (spent about 15 months) in this area before entering the TPD (Extended Data Fig. 2), during which the ice thickened and increased its deformed fraction. After the shift, ice stayed in this area only about 6 months on average (Extended Data Fig. 2), resulting in recruitment of newly formed younger ice into the TPD and more sea ice formation during TPD transit to the Fram Strait26. The younger ice is thin, weakly linked and features ridges with more shallow keels; hence, it is more prone to wind forcing pushing the ice towards the Atlantic sector of the Arctic28,47. This process accelerated the TPD from 2007 onwards (Fig. 4d), while enhanced wind forcing after 2007 may also have contributed to the acceleration of the TPD (Extended Data Fig. 7). Because of the shorter residence time, the part of the ice that has thermodynamically grown is thinner17 (reduction of modal thickness in Fig. 1b) and the relative amount of the deformed fraction of ice has decreased (Figs. 1band 2). Impacts of this regime shift in Arctic sea ice on the pan-Arctic environment are extensive and require further investigation. Thinner and less deformed sea ice causes reduced momentum exchange between ice and ocean, contributing to reduced mixing in the upper ocean underneath areas that are fully covered with ice. This may affect entrainment of heat and nutrients from subsurface to surface ocean with a potential consequence on the biogeochemical cycles involving higher trophic levels. By contrast, however, sea ice retreat in marginal ice zones and continuing weakening of the cold halocline in the Atlantic sector allows for more turbulent mixing and winter convection in the upper ocean46. These counteracting effects can influence the regional contrasts of the ocean environment between fully ice-covered areas and marginal ice zones in the Arctic. In addition, habitat conditions of younger, level sea ice are different from those in older multi-year ice and might affect the sympagic (ice-associated) communities and their diversity48,49. Ridged sea ice supports higher biomass48 and represents safe havens for organisms to hide from predators50. The amount of ridges and deformed ice has also consequences for human activity. Thinner, more level ice is less challenging for ship navigation than in thicker, deformed ice and, along with less ice/shorter ice seasons in general, may allow for an increase in Arctic maritime traffic. Finally, interdisciplinary studies in the Atlantic sector of the Arctic and downstream of the Fram Strait outflow are needed to shed light on the consequences of the described sea ice regime shift and its impacts on physical and biogeochemical processes. Zack Labe @zacklabe.com · 3d It's time! Join me in tracking this year's #Arctic sea ice minimum! A new record is unlikely again this year. Sea ice melt substantially slows every September as solar energy decreases and temperatures drop in the far north. Follow along with the data at zacklabe.com/arctic-sea-i... ALT
-
 http://cashbridgeconnect.com/# quickest payday loans online
 -

Augdewst 2026: Summer's Last Stand
Sey-Mour Snow replied to Prismshine Productions's topic in New England
Ya good call, although I wouldn’t be surprised if we get a last second push north for the south coast. -
Central PA Summer 2026 Discussion/Obs Thread
Mount Joy Snowman replied to Voyager's topic in Upstate New York/Pennsylvania
Low of 69. Could be some potent storms around this afternoon. I expect my mowing prospects will be disrupted. -
Morning discussion from LWX DISCUSSION... KEY MESSAGE 1...Severe weather is possible, mainly east of the Blue Ridge this afternoon into early evening. A slow-moving cold front arcs down the Saint Lawrence River Valley to the lower Great Lakes back into the central Great Plains. To the south, a largely stationary front was attempting to lift slowly northward as a warm front, and stretched from the Carolinas back to Oklahoma. Showers and thunderstorms were persistently trekking west to east along the northern front, with a weak surface low and MCV/shortwave crossing Illinois. This shortwave will be the impetus for convective development across the Mid-Atlantic later today as the local area sits in between the two aforementioned fronts. Most instability this morning is rather weak and elevated in nature, but is expected to increase rapidly in the I-95 corridor from south to north as higher moisture air advects into the area, as well as near the Appalachians ahead of an approaching shortwave, both by late this morning. For now, weak lift and CAPE is keeping things limited to a few WAA showers near the metros. Additional development, perhaps even deeper convective cores, is possible by as early as late morning given the anticipated rapid increase in CAPE and lift. Flow aloft is seasonably strong by late August standards, with a 100+ knot 300 hPa jet streak expected to pivot over the Saint Lawrence River Valley into northern New England by evening. The tail of this upper jet may actually strengthen and persist near the Mason-Dixon Line early this evening, which could briefly enhance large scale ascent locally via RRQ dynamics. In the mid levels, the previously mentioned shortwave has trended notably deeper and a bit slower over the last 12-24 hours. This brings the axis of the shortwave, its enhanced flow, and PVA across the Appalachians around midday, then across areas near and east of the Blue Ridge/Catoctin Mountains east to I-95 and the Chesapeake Bay during peak heating. In addition to bringing large scale ascent, this pushes effective deep layer bulk shear into the 35- to 50-knot range later today (highest north/northeast). Shear of this magnitude is favorable for sustained, organized updrafts, including line segments and supercells (discrete or line-embedded). Thermodynamically, the atmosphere will be very moist, especially further east. Strong low-level theta-e advection is expected to persist through early evening ahead of the approaching shortwave and cold front. Widespread clouds will limit heating somewhat, especially west of the Blue Ridge where the storm threat is notably less, but with the strong low-level moisture advection and slow-but-steady cooling aloft, the net result should be about 1000-2000 J/kg MLCAPE in the moist plume east of the Blue Ridge heading into this afternoon, possibly as early as late morning. The moist low-level advection beneath cooling aloft may also result in re-generative CAPE and multiple rounds of thunderstorms in any one location. This would be most likely from near the DC metro north and east where large scale ascent is strongest, with the added component of enhanced low-level convergence along bay or river breezes (and eventually composite outflow boundaries). Finally, PWs will approach or exceed 2 inches in the moist axis near and east of I-95 this afternoon into early evening. Deep warm cloud layers in the high PW airmass will yield heavy to extreme instantaneous and sub-hourly rainfall rates in the stronger precip cores. Individual cell motion is expected to be progressive (30-40 mph) given enhanced flow through the column and the potential for modest cold pool development with any persistent cells, clusters or line segments. However, the wavy slow-moving front approaching from the north may lie close to parallel to the mean steering flow at times, especially when modulated by outflow from potential multiple rounds of storms. This, coupled with the bay breeze which often takes on a similar orientation, plus the urban footprint that has seen heavy rain recently raises a (primarily urban/poor drainage) flash flood risk over the I-95 corridor in northeast Maryland, including the Baltimore area. The threat is a bit more conditional further south and west into areas like Annapolis and the DC/Capital Beltway region; these areas also feature urban sprawl and inherently lower FFG, but the training potential is more conditional based on favorable outflow or cell interactions given slightly further displacement from the synoptic front(s) and bay breeze. Multiple hazards are possible today, and are outlined below. Damaging Wind... Straight-line/downburst winds are likely the highest threat today, at least from an areal coverage standpoint. Tall, skinny CAPE profiles with modest pockets of mid-level dry air yield DCAPE of 600-800 J/kg, which would be marginally favorable for strong to severe downdrafts. Background mid-level flow may approach 40 knots around 700 hPa. With the high PW air and modest DCAPE, water-loaded downdrafts via precip drag would be possible especially with any bowing line segments or collapsing mesocyclones/mesovorticies. The lack of steeper lapse rates (hence modest DCAPE) should keep most wind gusts within the strongest storms in the 55-70 mph range, with more widespread 40-55 mph potential. Given heavy precip and late summer, leafed- up trees, would anticipate scattered to numerous instances of tree and branch falls and subsequent power outage potential. The risk is highest near and east of I-95 where storms are most likely to become linear and be a bit more intense, since they`re further east in the moist axis with a little more time to heat. To the west, especially west of the Blue Ridge, less moisture and heating should keep the coverage of more intense storms low. Tornadoes... A conditional risk for a brief spin-up is evident for most areas east of the Blue Ridge given the magnitude of low/mid-level flow and high PWs/lower LCLs. Relatively greater tornado potential may exist closer to the front near the I-70 corridor east of Frederick where surface winds will be backed and low-level SRH will be higher, especially in close proximity to the bay breeze along the western shore of the Chesapeake Bay into northeast MD. Potential would be further maximized by (1) discrete supercells occurring earlier when the synoptic low-level winds remain backed and SRH is higher on a broad scale, and (2) with any favorable QLCS surge/mesovortex interactions with residual outflow or the bay breeze. Although unlikely due to a lack of stronger 0-1 km shear/SRH and steeper lapse rates, robust 3CAPE near the bay could result in a conditional risk for a strong tornado if all of the above factors were to coalesce. Flash Flooding... We have been in a wetter pattern recently, but the majority of the region is still in or just coming out of drought. Poor drainage and urban areas are susceptible to heavy rain, especially the intense sub-hourly rates possible today, regardless. Additionally, areas near and just northeast of Baltimore have seen multiple episodes of heavy rain over the last few weeks. Individual storms should move pretty swiftly, but the slowing southwest end of any lines or clusters would orient parallel to the nearby surface front, bay breeze, and mean steering flow. This brings a risk of flash flooding to northeast MD in particular, with a more conditional risk further south and west into the greater DC metro. Hail... Although lapse rates aloft will be modest at best given the moist profiles, supercellular shear and modest mid-level cooling will be favorable for at least some marginal/spotty severe hail potential. Should mid-level shear/cooling be more potent or cells be more discrete, the hail risk could increase, but this seems unlikely given the otherwise tropical-esque airmass. The threat for severe weather and flooding appears highest between 2 PM this afternoon and 8 PM this evening, progressing west to east in one or two rounds. However, it may start a couple hours earlier further west (or on the bay breeze), and could linger through late evening over southern Maryland. By later this evening, the departure of large scale lift and the loss of daytime heating should end the severe/flood threat.
-
Hazardous Weather Outlook National Weather Service Baltimore MD/Washington DC 650 AM EDT Thu Aug 20 2026 ANZ530>543-DCZ001-MDZ008-011-013-014-016>018-504-506-508- VAZ053>057-527-211100- Chesapeake Bay north of Pooles Island MD- Chesapeake Bay from Pooles Island to Sandy Point MD- Chesapeake Bay from Sandy Point to North Beach MD- Chesapeake Bay from North Beach to Drum Point MD- Chesapeake Bay from Drum Point MD to Smith Point VA- Tidal Potomac from Key Bridge to Indian Head MD- Tidal Potomac from Indian Head to Cobb Island MD- Tidal Potomac from Cobb Island MD to Smith Point VA- Patapsco River including Baltimore Harbor- Chester River to Queenstown MD-Eastern Bay- Choptank River to Cambridge MD and the Little Choptank River- Patuxent River to Broomes Island MD- Tangier Sound and the inland waters surrounding Bloodsworth Island-District of Columbia-Cecil-Southern Baltimore- Prince Georges-Anne Arundel-Charles-St. Marys-Calvert- Central and Southeast Montgomery-Central and Southeast Howard- Southeast Harford-Fairfax-Arlington/Falls Church/Alexandria- Stafford-Spotsylvania-King George- Central and Southeast Prince William/Manassas/Manassas Park- 650 AM EDT Thu Aug 20 2026 This Hazardous Weather Outlook is for the Maryland portion of the Chesapeake Bay, Tidal Potomac River, and I-95 corridor through central Maryland, northern Virginia, and District of Columbia. .DAY ONE...Today and Tonight Numerous thunderstorms are expected between about 3 PM and 9 PM. These storms may contain damaging wind gusts and potentially a couple of tornadoes, especially near northeast Maryland. There is also a threat of urban flash flooding, with the highest risk near and northeast of Baltimore.
-
https://tadahealthrx.com/# Buy Tadalafil 10mg
-
Premier league starts tomorrow for those of you who enjoyed the World Cup.
-

Augdewst 2026: Summer's Last Stand
SJonesWX replied to Prismshine Productions's topic in New England
you have been here long enough to know that reality does not exist here. This place runs on hopes, dreams, and trolls. -
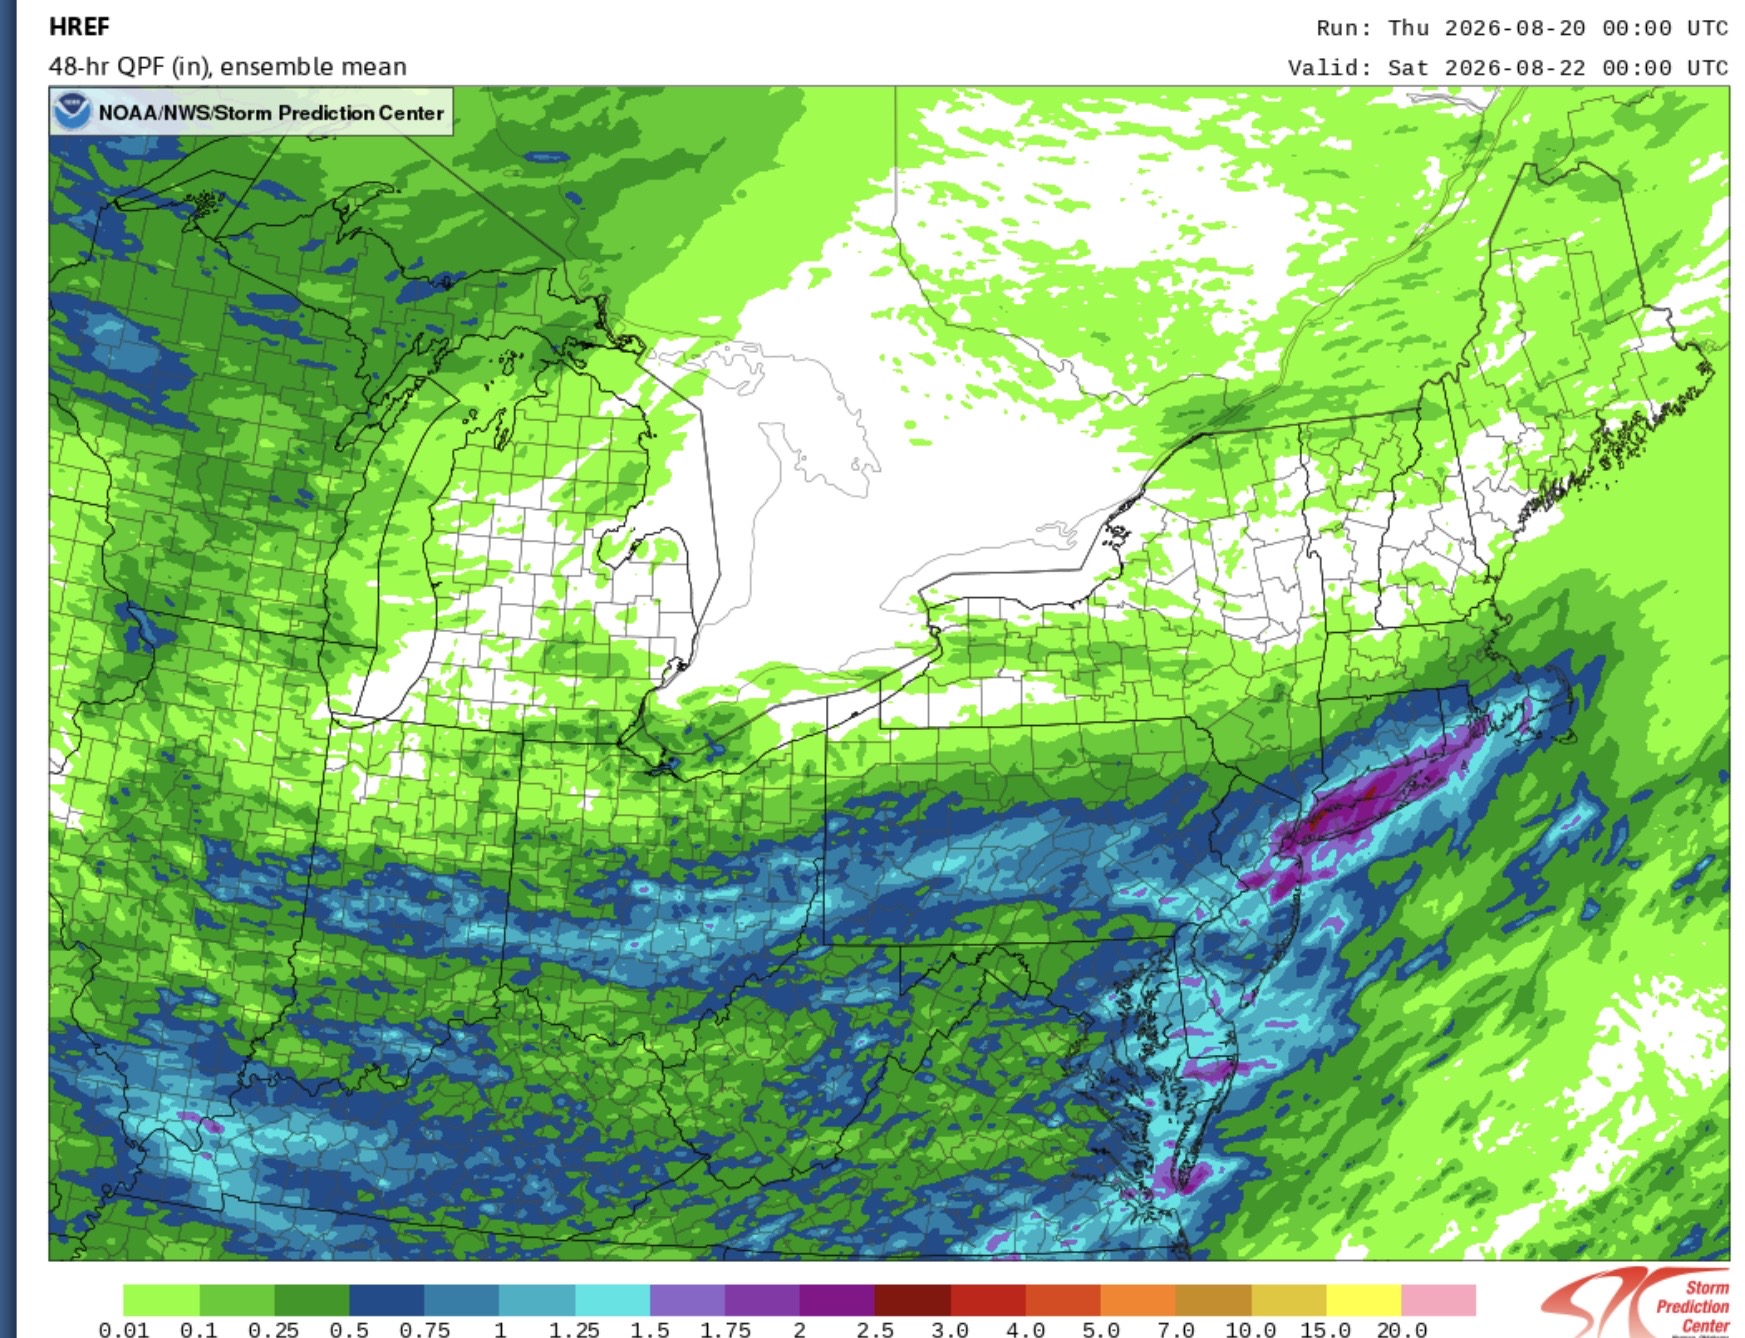
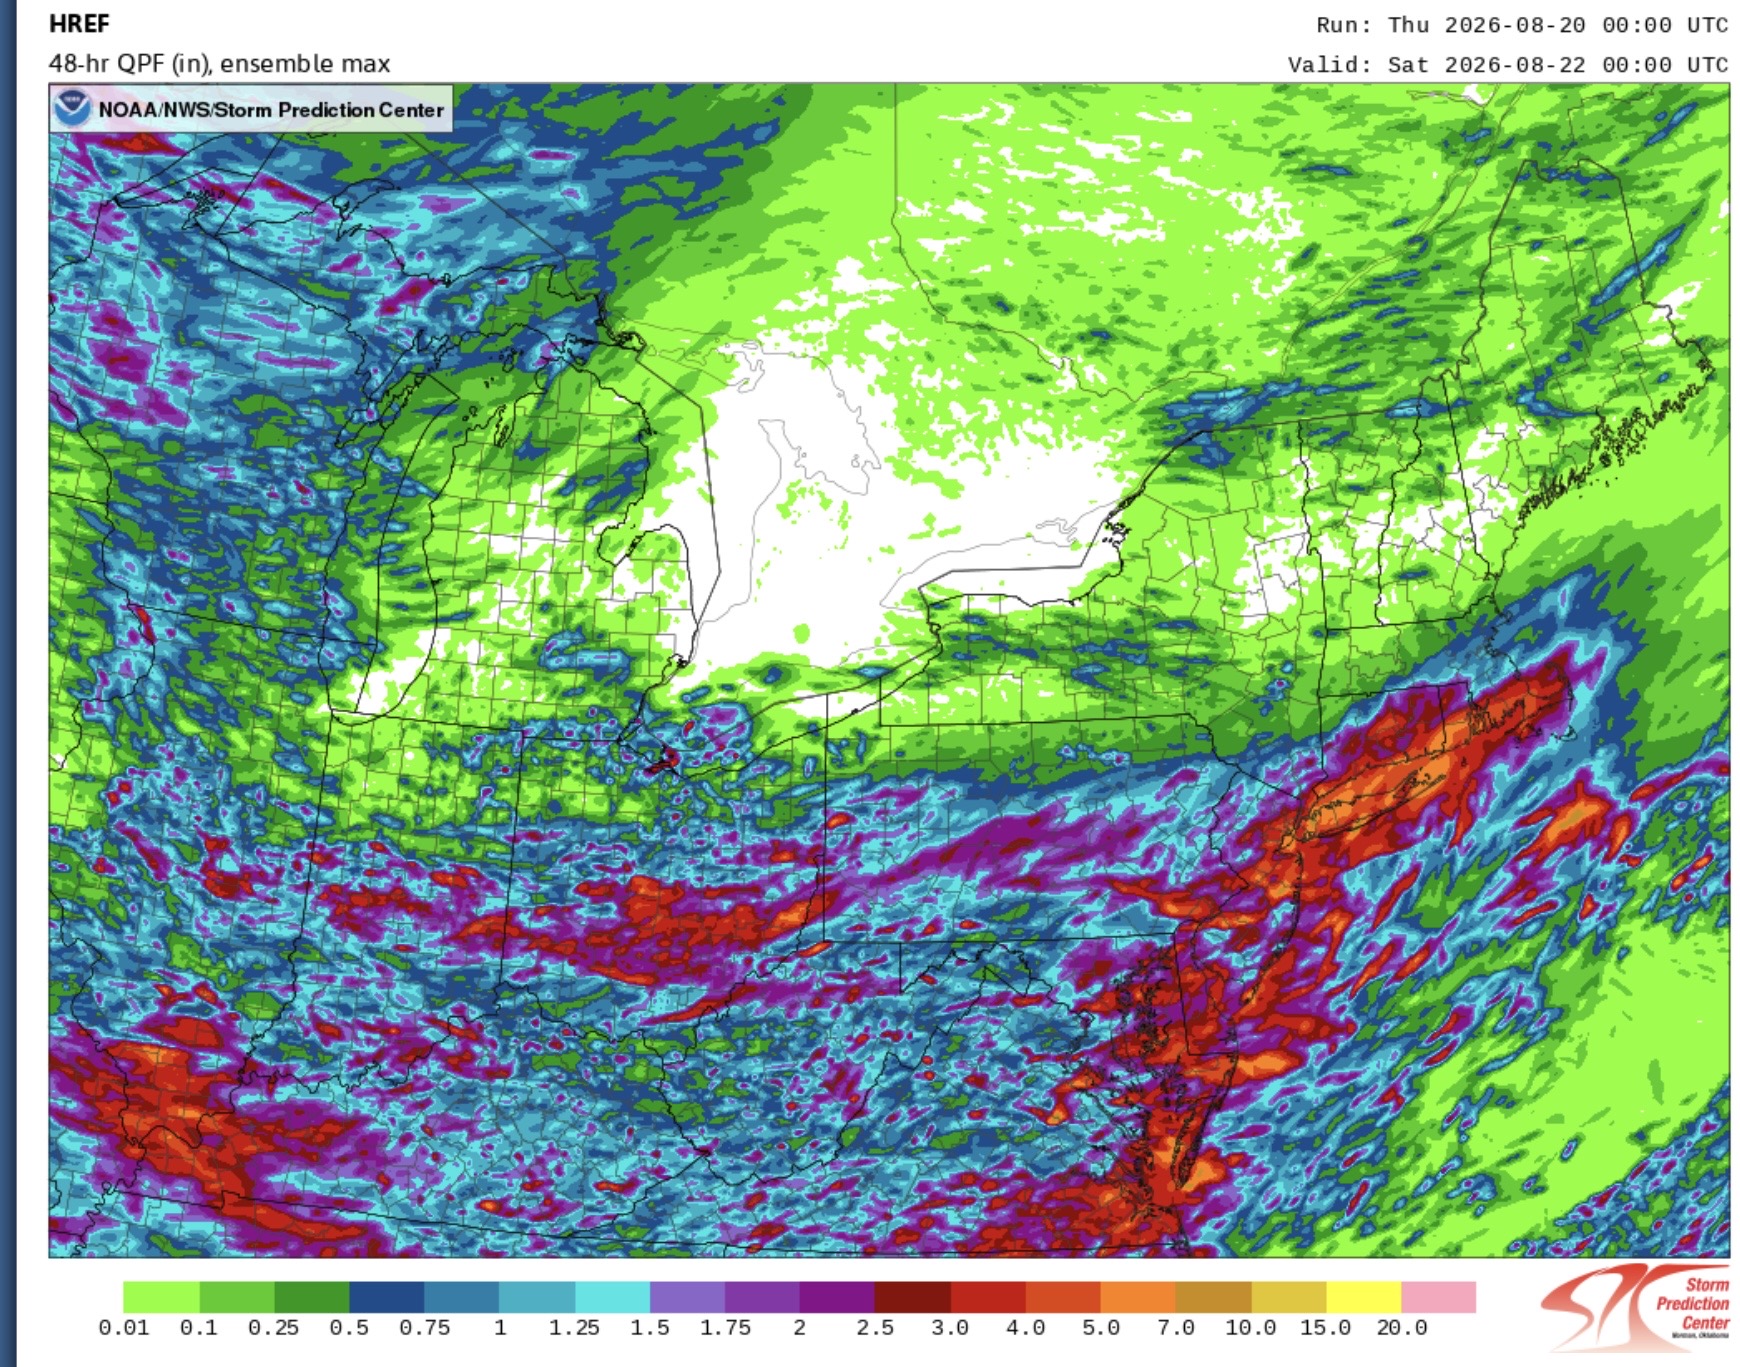
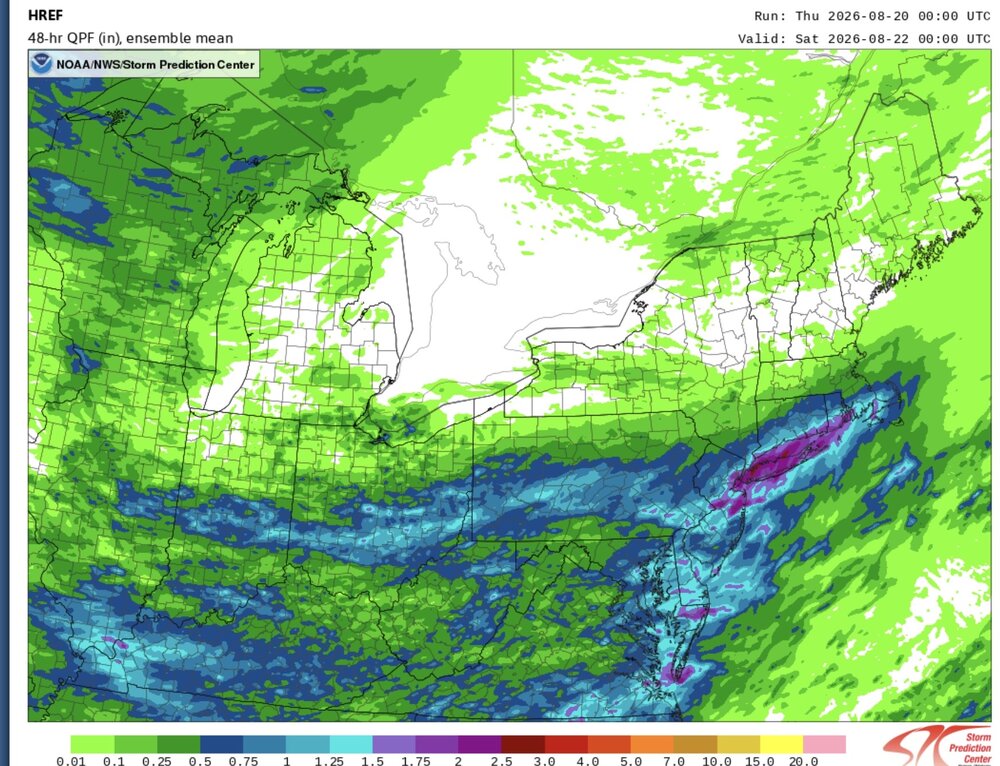
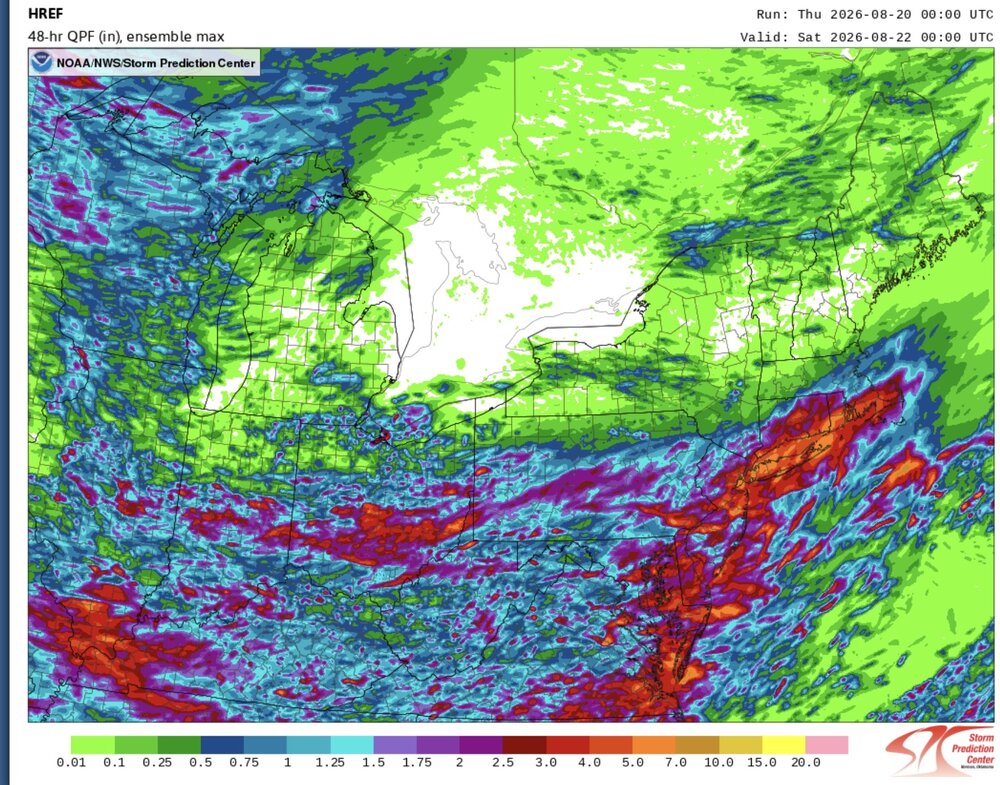
HREF has a widespread 1.5 to 2.5 potential. Localized 3-5 possible where the best training sets up. So a continuation of the heaviest summer rains coming after we get the 100° heat early in the season. Like our local version of a monsoon pattern.
- Today
-
Where is that from? Weathermodels.com? That looks very much like my extra tropical Pacific composite.
-

2026-2027 Record-breaking El Nino
bluewave replied to Stormchaserchuck1's topic in Weather Forecasting and Discussion
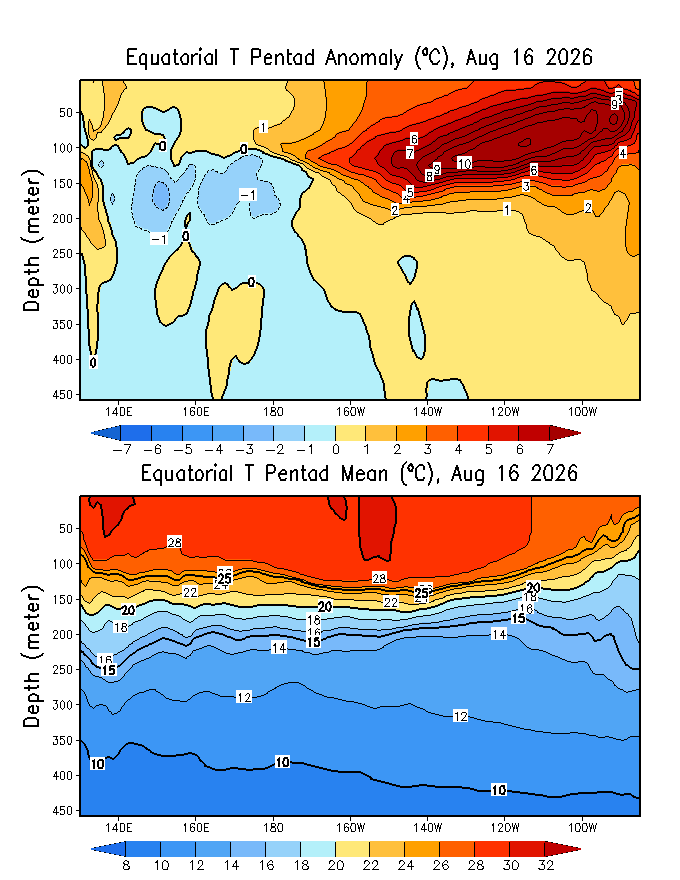
Starting to see +11 subsurface anomalies now.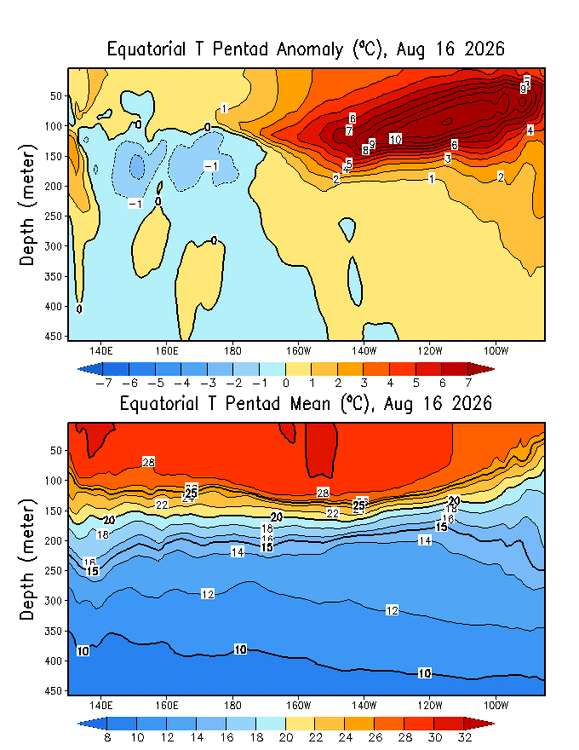
-
No thanks.
-
I’ve been enjoying seeing and experiencing some monsoon convection since I arrived in CO. Saw some good ones on the way to and inside the awesome Rocky Mtn State Park. Trail Ridge Road is so spectacular that it’s almost beyond words. It went from 80s in Boulder to as cold as 53 at 11,500-12,000 feet up! It was cold enough there for a light jacket, especially when considering the steady winds up there.