WEATHER53 Posted January 24, 2016 Share Posted January 24, 2016 I have two cars and an ordinary driveway with apron and 30' sidewalk. I thin it will take 3 hours to dig it and clear it Link to comment Share on other sites More sharing options...
The Dude Posted January 24, 2016 Share Posted January 24, 2016 Good to hear. I'm in the Chevy Chase area near Conn Ave and the Beltway a bit to your southeast. Also saw a report of 26.4" in Garrett Park a few miles up the road. Makes me feel a bit more confident with my 24.0 amount that I measured/estimated. It was a tough one to measure. I used the top of my trash can, which I wiped clean several points during the storm. With the wind blowing, I don't know if some of it was caused by snow redeposited from the roof or trees. Snow depth reached 22" on my deck by noon on Saturday, and never went above that despite it snowing at least 2"/hr rates for part of the afternoon. Other parts of the neighborhood had an average snow depth of around 26". I'm right at Grosvenor Metro, so I'd be surprised if I ended up with 6 inches more than you. I suppose it's possible because we were right on the very edge of the dry slot, but kept snowing at a decent clip most of the morning, but that range over 2-3 miles would be surprising. Link to comment Share on other sites More sharing options...
Bob Chill Posted January 24, 2016 Share Posted January 24, 2016 It was a tough one to measure. I used the top of my trash can, which I wiped clean several points during the storm. With the wind blowing, I don't know if some of it was caused by snow redeposited from the roof or trees. Snow depth reached 22" on my deck by noon on Saturday, and never went above that despite it snowing at least 2"/hr rates for part of the afternoon. Other parts of the neighborhood had an average snow depth of around 26". I'm right at Grosvenor Metro, so I'd be surprised if I ended up with 6 inches more than you. I suppose it's possible because we were right on the very edge of the dry slot, but kept snowing at a decent clip most of the morning, but that range over 2-3 miles would be surprising. I'm probably around 6 miles nw of you. That edge during the day was like a knife. Clear demarcation line to the east and west of it with all the spotter reports. We got very lucky. I never lulled beyond a couple brief periods of -SN and a couple half inch an hour periods. Other than that it was 1"+/hr for the duration. My front yard was a uniform 27" depth this morning. As were adjacent homes. We live at a low point on the street protected from wind.Up the street at the top of the hill was much more affected by wind. Depths were all over the place. Link to comment Share on other sites More sharing options...
Ltrain Posted January 24, 2016 Share Posted January 24, 2016 I saw an NWS storm snow results map on one of the local TV channels, so one exists but can't find it online. http://www.weather.gov/lwx/pnsmap?type=snow Link to comment Share on other sites More sharing options...
arlwx Posted January 24, 2016 Share Posted January 24, 2016 School systems in the DC area are already closing on Monday, some Tuesday as well. Appparently there is low confidence that the plow crews will get the primaries done by Monday. Link to comment Share on other sites More sharing options...
BTRWx Posted January 24, 2016 Share Posted January 24, 2016 I'm going with 24.0". Matches well with a nearby spotter ob of 24.2". Fell just shy of 2010. I had a ton of precip, so the models did well there. More like 8.5:1 ratios for the whole storm. I was shy of 2010 by a good 10", but I don't think I was a spotter back then and it very well could have been a drift that I measured. Link to comment Share on other sites More sharing options...
gymengineer Posted January 24, 2016 Share Posted January 24, 2016 So BWI's snow depth (I believe from 12Z this morning) of 26" makes the 29" snow total believable in the way they are related. However, of course the observers could have been measuring a drifted area. IAD's 28" snow depth is very close to its 29" total, meaning to me that perhaps they actually hit 30" in snow total. And as pointed out in the other thread, lol at DCA's 18" snow depth this morning with a 17.8" storm total. Link to comment Share on other sites More sharing options...
snowfan Posted January 25, 2016 Share Posted January 25, 2016 School systems in the DC area are already closing on Monday, some Tuesday as well. Appparently there is low confidence that the plow crews will get the primaries done by Monday. I doubt a single district opens before thursday. Link to comment Share on other sites More sharing options...
Matthew-Northern Italy Posted January 25, 2016 Share Posted January 25, 2016 Man, I followed almost hourly your blizzard, as many italian weatherfans ... I'm happy for you, but meanwhile also terribly ENVY The past two winters sucked greatly in northern Italy (btw at least 2013-2014 was very snowy in the mountains), and this current one is going to be as one of the worst ever ... with endless high pressure, strong thermic inversion, just a week of normal cold (this past one) and almost zero snow, also in the mountains; we have to see what February will do, but the hopes are very low. Congrats to all ! we know that until now your 2015-2016 winter was also horrible, but at least you have had now a nice "price" for your patience Link to comment Share on other sites More sharing options...
jnis Posted January 25, 2016 Share Posted January 25, 2016 Thanks Matthew. It had been a fun and exhausting storm! I hope you winter improves during February. Link to comment Share on other sites More sharing options...
MN Transplant Posted January 25, 2016 Share Posted January 25, 2016 I just took a core sample of my remaining 21". 3.45 liquid. I had to do it twice since I didn't believe the first number. While that is likely partially due to compaction and then drifting again, it supports some of my earlier readings that showed that the ratios during the storm were awful. 7 or 8 to 1. Link to comment Share on other sites More sharing options...
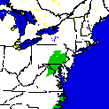
SomeguyfromTakomaPark Posted January 25, 2016 Share Posted January 25, 2016 Paul Jeffrey Kocin 23 mins · First,would just like to say what an honor it was to work with Nick Wiltgen, who was a long time member of TWC's radio network and passed away yesterday way too soon. There also is a preliminary estimate for NESIS for the blizzard, worked up by the NWS. It scored 7.49, placing it as a category 4 storm (crippling). It falls between the Feb 1983 snowstorm (6.3) and Pres Day Il in Feb 2003 (8.9), also cat 4 storms. March 1993 and Jan Blizzard of 1996 remain as Cat 5 storms (as well as the combination of the Feb 5-6 and Feb 9-10 storms). Why does Jan 1996 rate higher, you may ask? Heavier snow over a larger area and greater population. Link to comment Share on other sites More sharing options...
midatlanticweather Posted January 26, 2016 Share Posted January 26, 2016 https://www.climate.gov/news-features/featured-images/january-2016-snowstorm-was-category-4-event Link to comment Share on other sites More sharing options...
Sparky Posted January 26, 2016 Share Posted January 26, 2016 I just took a core sample of my remaining 21". 3.45 liquid. I had to do it twice since I didn't believe the first number. While that is likely partially due to compaction and then drifting again, it supports some of my earlier readings that showed that the ratios during the storm were awful. 7 or 8 to 1. That seems too high. BWI received 2.13" liquid for the storm. That is like a 13.7:1 ratio. Link to comment Share on other sites More sharing options...
hosj III Posted January 27, 2016 Share Posted January 27, 2016 I just took a core sample of my remaining 21". 3.45 liquid. I had to do it twice since I didn't believe the first number. While that is likely partially due to compaction and then drifting again, it supports some of my earlier readings that showed that the ratios during the storm were awful. 7 or 8 to 1. How did you do it? For smaller storms I just melt whatever falls in the outer part of the rain gauge but obviously this storm overflowed it. Link to comment Share on other sites More sharing options...
MN Transplant Posted January 27, 2016 Share Posted January 27, 2016 That seems too high. BWI received 2.13" liquid for the storm. That is like a 13.7:1 ratio. Yeah, I'm almost certain that measurement was too high. My liquid equivalent for the storm was ~2.9", so there is no reason other than compaction/drifting why my day after core was so high. That said, all of the airport measurements done by ASOS are likely wrong. Even famartin in the other thread noted that the IAD number differs from the number they got at the NWS office. How did you do it? For smaller storms I just melt whatever falls in the outer part of the rain gauge but obviously this storm overflowed it. The Cocorahs rules: Snow Cores—Core PrecipitationUnder some circumstances (primarily strong winds), your 4" diameter gauge will not catch all of the snow that has fallen. You can watch windblown snow crystals curve around a rain gauge like water going around a rock in a river. If you believe your gauge has not adequately caught the precipitation that has fallen (or, if you're just curious), then take a core sample of the fresh snow that has fallen. After first measuring the water content in the gauge, then take the 4" outer cylinder and "cut a biscuit" in the fresh snow by pushing it straight down. It is best to do this on your snowboard (after you've measured the snow depth, but before you have cleared the snow and put it back on the surface). Use a thin sturdy cookie sheet or something like that to slide under the cylinder so that you can lift it up without spilling the contents. Be sure to measure in a representative location -- not in a drift or in a wind-blown or melted area. Then proceed to melt and measure the water content like you would with any other measurement. Link to comment Share on other sites More sharing options...
Ian Posted January 28, 2016 Author Share Posted January 28, 2016 Final NESIS - Cat 4, #4 since 1950s. http://www.noaanews.noaa.gov/stories2016/012816-noaa-ranks-january-2016-blizzard-category-4-on-the-northeast-snowfall-impact-scale.html Link to comment Share on other sites More sharing options...
gymengineer Posted February 3, 2016 Share Posted February 3, 2016 Final NESIS - Cat 4, #4 since 1950s. http://www.noaanews.noaa.gov/stories2016/012816-noaa-ranks-january-2016-blizzard-category-4-on-the-northeast-snowfall-impact-scale.html Interesting comparisons from the RSI (Regional Snowfall Index), where the NCDC breaks down the population affected by >=20" and >=30". These comparisons are normalized for population growth by using the 2010 Census data. In terms of the snowfall contours themselves, they are more or less consistently 'stingy' compared to the maps Kocin himself would produce (no spotter reports accepted for the NCDC): For >=20" 1) 1/96: 28,928,278 2) 1/16: 21,000,936 3) 2/03: 19,242,275 4) 12/47: 13,501,073 5) 2/13: 10,662,789 For >=30" 1) 2/69 (late February New England storm): 2,009,520 2) 11/50: 1,207,570 3) 2/78: 1,169,430 4) 1/16: 1,121,182 5) 3/93: 729,753 6) late 2/10 (the NY storm): 677,436 7) 1/66 (including lake effect): 611,484 8) looks off with a huge spread in dates (2/25/1900- 3/2/1900): 526,154 9) 1/96: 493,778 So, for NCDC's climate records, this latest blizzard was in the tradition of 1/96 and 2/03 with the massive geographical coverage of 20"+ snow totals. But it far outpaced 1/96 and 2/03, normalized to the 2010 Census, for the amount of people experiencing 30"+ snow totals. Link to comment Share on other sites More sharing options...
midatlanticweather Posted February 25, 2016 Share Posted February 25, 2016 No one bumped for the 1 month remembrance. Seems longer already! Link to comment Share on other sites More sharing options...
Symblized Posted June 2, 2016 Share Posted June 2, 2016 This counts as an observation, right? "Massive snow pile still melting away in South Baltimore" http://www.baltimore...0601-story.html Link to comment Share on other sites More sharing options...
nw baltimore wx Posted June 2, 2016 Share Posted June 2, 2016 That's really gross. Link to comment Share on other sites More sharing options...
The Dude Posted June 3, 2016 Share Posted June 3, 2016 That's really gross awesome. FYP Link to comment Share on other sites More sharing options...
Jebman Posted June 3, 2016 Share Posted June 3, 2016 This counts as an observation, right? "Massive snow pile still melting away in South Baltimore" http://www.baltimore...0601-story.html I really need to take a long leisurely snow jebwalk there. How surreal, its early June with 85/67 conditions. Link to comment Share on other sites More sharing options...
Dalfy Posted March 14, 2017 Share Posted March 14, 2017 Reading through this thread again... so many good memories. Sorry for the pulling it back up again lol. I was going to put this up earlier but it's just as good now (documenting the second half of the storm). I was a bit taken by my own excitedness so pardon the excessive emotion . Link to comment Share on other sites More sharing options...

Recommended Posts
Archived
This topic is now archived and is closed to further replies.