All Activity
- Past hour
-
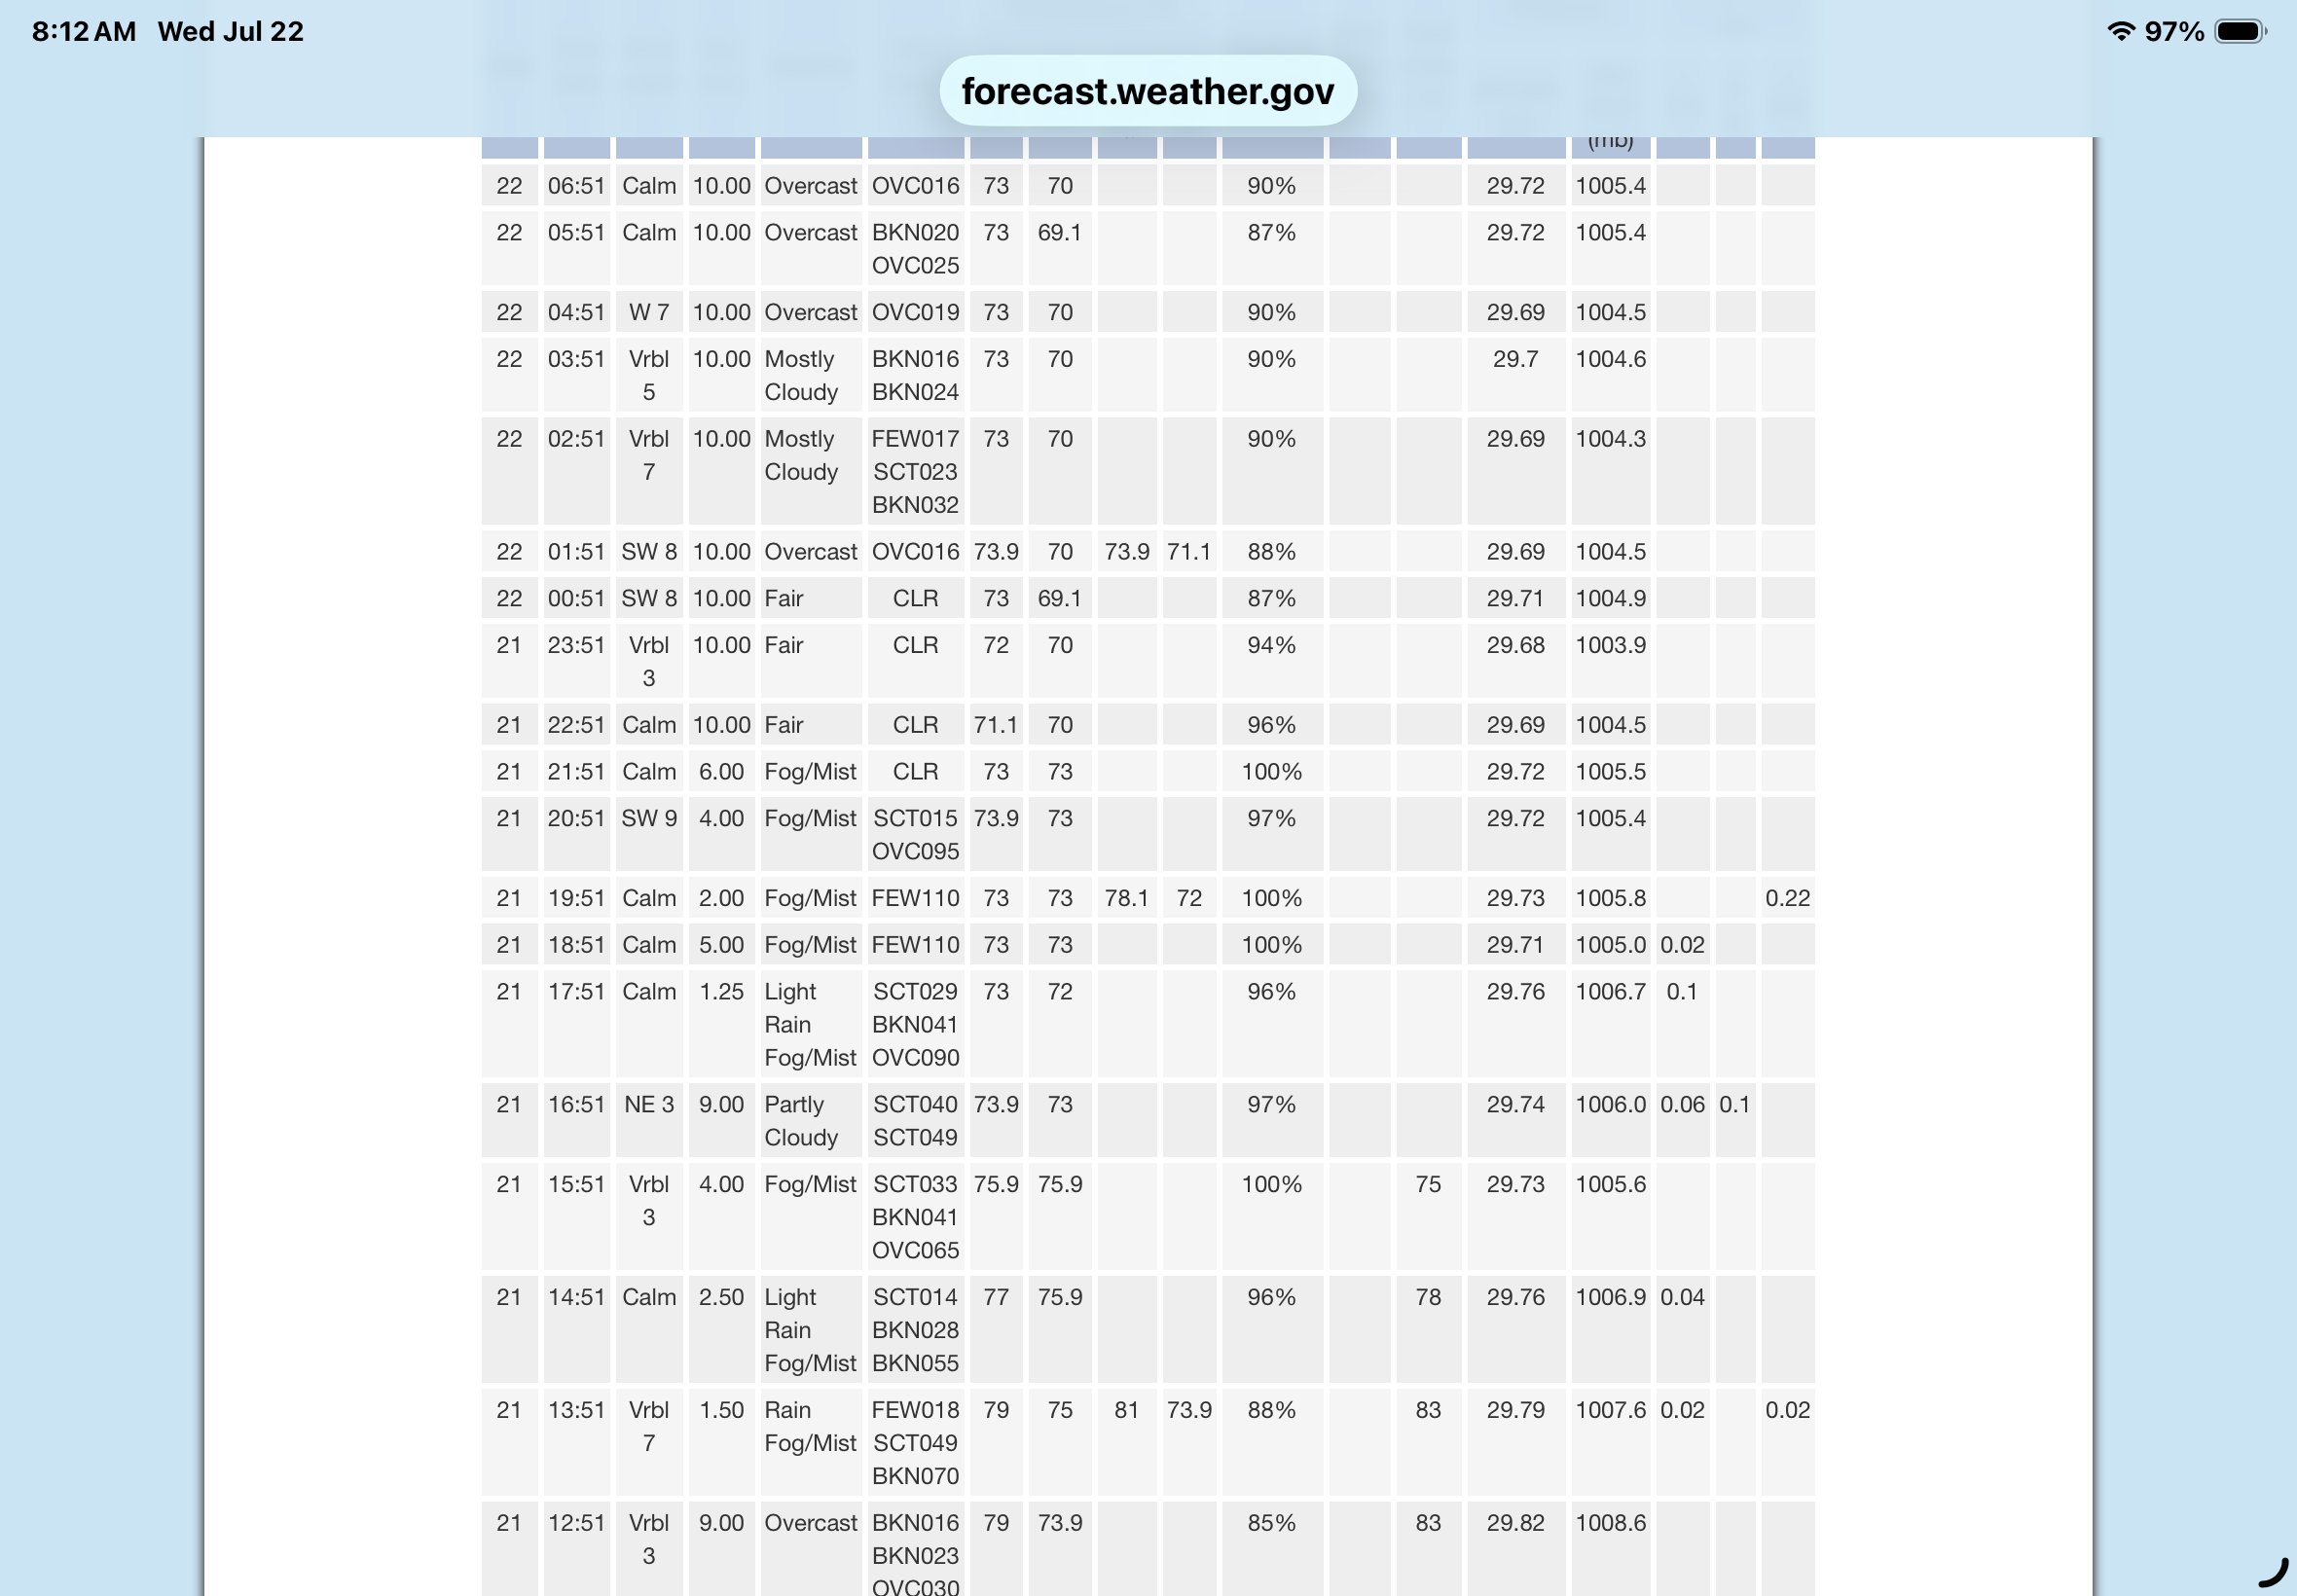
 Do you know what our annual average is?
 -
C'mon Sun, heat that ground!
-
-

2026-2027 Super El Nino
Typhoon Tip replied to Stormchaserchuck1's topic in Weather Forecasting and Discussion
I'm suspecting that we're heading for a troughy/humid end game myself. If so ... that would lower the "big heat" transport circumstances, blocked by ongoing synoptic balancing. Doesn't mean it can't happen... talking 'tendency' here ( sorry, not you per se but the common reader tends to formulate extremes in their interpretation .. failing idiosyncratic nuance and/or 'lean' ) We'll see... but there's a leitmotif in the major ensemble sources to pin a trough here regardless of the Pacific. Ex, over the next 7 days the eastern Pac passes through an impressive -PNA for mid summer... but we don't see heights rising much E of Chicago. Proooobably this is owing to the shortened wave lengths of summer in general - how that gets away with that. But here's the rub... that positive anomaly over the N-NE Pac decays, and the pattern moves ends up with trough anyway. So we're fucked either way, is what the modeling argues. Okay - Altho some folks have a more toxic relationship with heat expectations so for them, this is probably the opposite of fucked intimation haha -
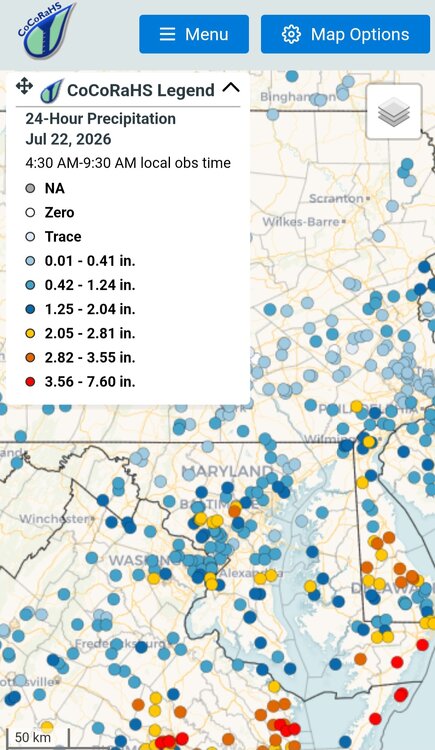
 Havent said this in a couple years but no more rain for awhile please-10 inches+ this month here with 9 days to go
 -
The 9.74" masks it the second wettest July for me, only topped by 2023 with 13.95". My average is 4.85". Interesting to note that I had .08" more in the Stratus than in the Davis which had to be due to splash out from the Davis in the 12.52" per hour rate for five minutes followed by a 11.76" rate for five minutes around 9:30pm last night.
-
E PA/NJ/DE Summer 2026 Obs/Discussion
BBasile replied to PhiEaglesfan712's topic in Philadelphia Region
They said it's gonna be virtual. I saw a video of when it came onshore. It looked very weak by that point. -
yes, not as much thunder as the other day, but deeper and more crashing. was up past midnight calming down my dog
-
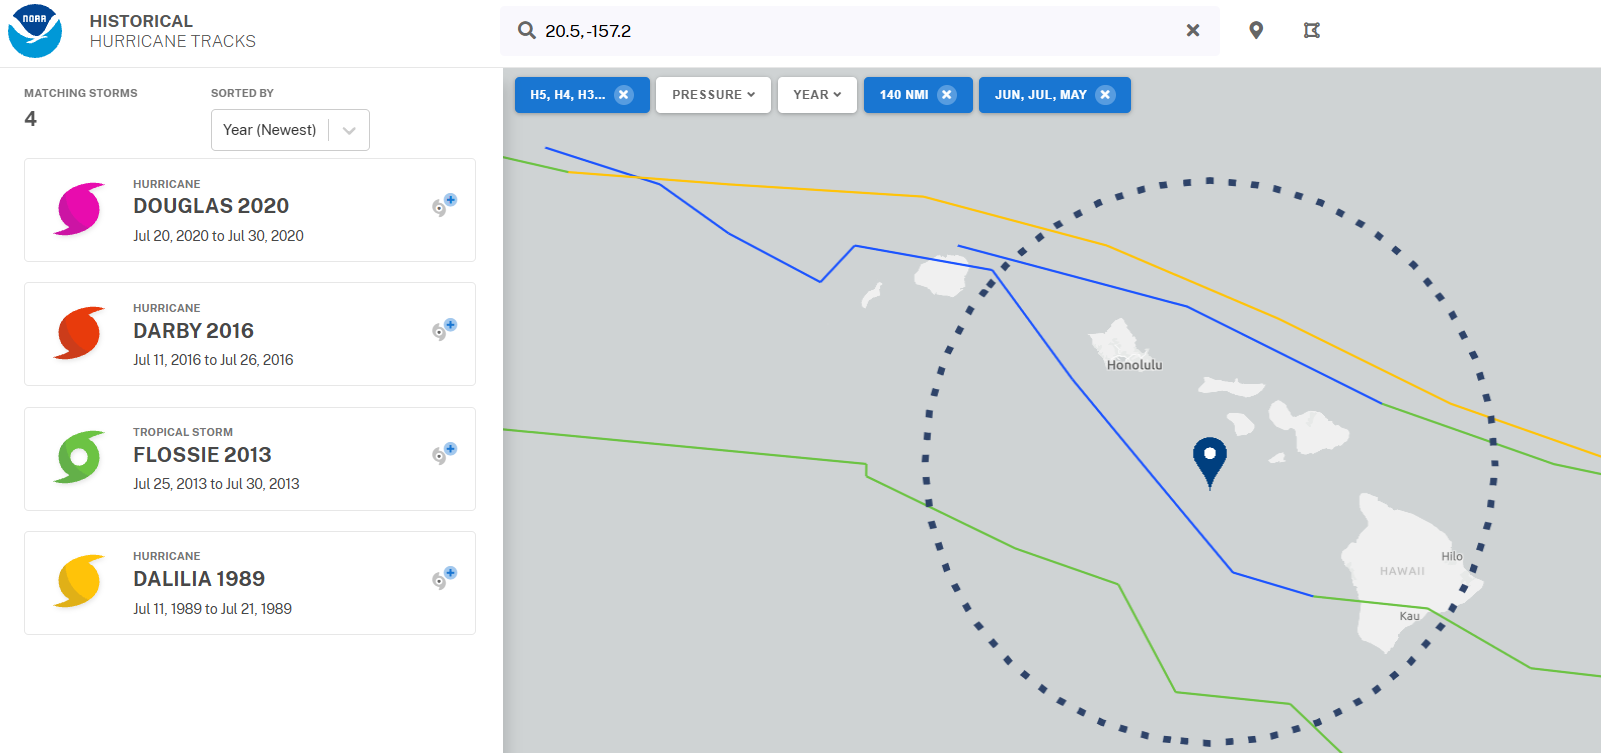
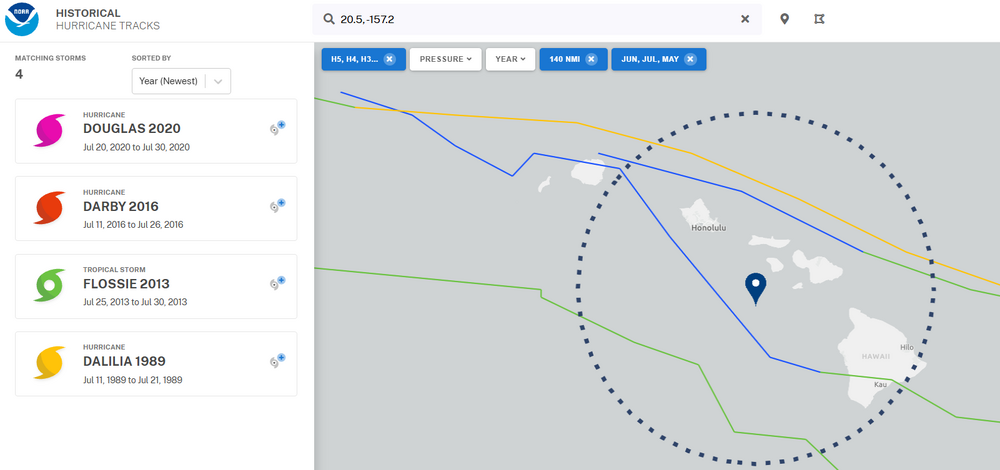
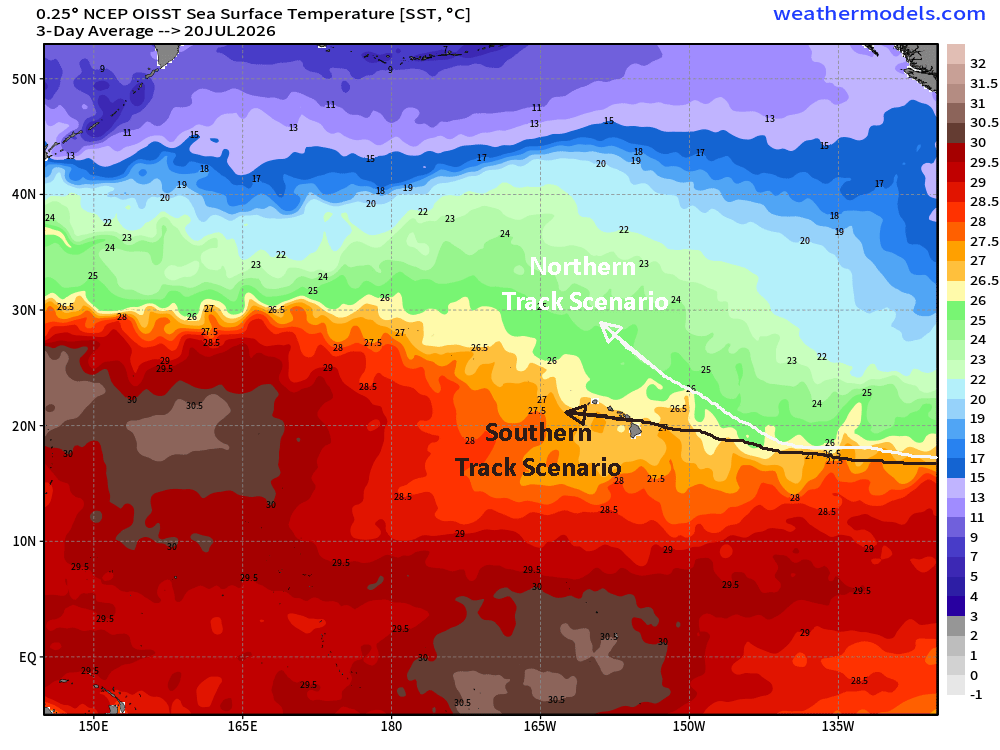
Our next US hurricane threat comes from an unlikely place so early in the season - the eastern/central Pacific! Fausto is expected to track west in general direction of Hawaii by mid next week, but big questions remain on whether it turns more NW and weakens (a la EPS) or continues westward and threatens Hawaii. Even a tropical storm strength system passing near Hawaii so early in the season would be in rare company. Check out my latest blog with more details: https://hurricanehacker.substack.com/p/eastern-pacific-stealing-tropical (Note - while my blog is mainly Atlantic focused, when there is a land threat in the eastern or central Pacific I will cover it. The subsequent posts on Fausto will be more in-depth than this one... please follow the blog on Substack for updates.)
-
Bertha has been a rather confounding/challenging TC to forecast. I'd be wary of being fooled by its current appearance (LLC decoupled from convection). Posted in-depth thoughts on Bertha's future here at my blog: https://hurricanehacker.substack.com/p/bertha-gaining-strength-heading-for
-
Yes, was actually pretty happy not to get the bigger rains after Saturday. 4.35" for the month is pretty nice
-

2026-2027 Super El Nino
bluewave replied to Stormchaserchuck1's topic in Weather Forecasting and Discussion
Boston just had their warmest June 1st to July 16th. Significantly warmer than any other developing super El Niño. So an unusually strong mid-latitude or subtropical ridge response for such a strong El Niño. This year was +5.5° above the mean of the previous 5 early summer average. Developing super El Niño June 1st to July 16th average temperatures 2026….73.9° 2023….68.9° 2015…..67.3° 1997…..70.5° 1982….66.9° 1972….68.2° -
Records: Highs: EWR: 108 (2011) NYC: 104 (2011) LGA: 104 (2011) JFK: 103 (2011) Lows: EWR: 56 (1944) NYC: 58 (1890) LGA: 62 (1956) JFK: 59 (1966) Historical: 1918 - A single bolt of lightning struck 504 sheep dead in their tracks at the Wasatch National Forest in Utah. Sheep often herd together in storms, and as a result the shock from the lightning bolt was passed from one animal to another. (David Ludlum) 1926: State maximum temperature record was set today at Troy, New York which was 108 °F. Also the maximum temperature of 105 °F was recorded at Waterbury, Connecticut but their state record is now 106 °F in 1995. (Ref. Lowest and Highest Temperatures for the 50 States) 1959: Two one-hundredths of an inch of rain was recorded ending a streak of 150 days with no measurable precipitation at Las Vegas, NV. (Ref. Wilson Wx. History) 1972: One person in Virginia was killed by lightning while playing softball. (Ref. Lightning - Virginia Weather History) 1986 - Hurricane Estelle passed 120 miles south of the Hawaiian Islands creating a ten to twenty foot surf. The large swells resulted from a combination of high tides, a full moon, and 50 mph winds. The hurricane also deluged Oahu Island with as much as 6.86 inches of rain on the 24th and 25th of the month. (Storm Data) 1987 - Barrow, AK, receives 1.38 inches in 24 hours on the 21st and 22nd, an all-time record for that location. The average annual precipitation for Barrow is just 4.75 inches. Thunderstorms in Montana produced 4 to 6 inches of rain in Glacier County causing extensive flooding along Divide Creek. Missoula, MT, received 1.71 inches of rain in 24 hours, a record for the month of July. (The National Weather Summary) (The Weather Channel) 1988 - Six cities in the south central U.S. reported record low temperatures for the date, including Pueblo, CO, with a reading of 48 degrees. Thunderstorms over the Atlantic Coast Region drenched Wilmington, NC, with 6.49 inches of rain in about eight hours. (The National Weather Summary) 1989 - Showers and thunderstorms prevailed across the southeastern third of the country. Afternoon thunderstorms in Florida produced wind gusts to 86 mph at Zephyrhills, and gusts to 92 mph at Carrollwood and Lutz. Thunderstorm winds gusting to 69 mph at Crystal Lake damaged nineteen mobile homes. (Storm Data) (The National Weather Summary) 1992: Lightning hit on or near a concrete mixing truck near Walla Walla, WA; a man was knocked off the truck. 10 minutes later a 2nd strike knocked him away from the truck again. He was fortunate he was only slightly hurt. (Weather Guide Calendar with Phenomenal Weather Events 2011 Accord Pub. 2010, USA) 1993: The levee, holding back the flooding Mississippi River at Kaskaskia, Illinois, ruptures, forcing the town's people to flee on barges. The incident at Kaskaskia was the most dramatic event of the flood. At 9:48 a.m., the levee broke, leaving the people of Kaskaskia with no escape route other than two Army Corp of Engineers barges. By 2 p.m., the entire town was underwater. 1999: The Cedar River in Charles City, IA reached its all-time crest of an estimated 22.8 feet. Approximately 100 homes had flood damage in Charles City. Almost 12 inches of rain fell in a 48 hours period over these counties. Rainfall totals that day: New Hampton, IA: 7.10 inches (wettest day on record), Charles City, IA: 6.65 inches, West Union, IA: 4 inches. (Ref. Wilson Wx. History) 2003: "The Mid-South Derecho of 2003" States affected....AR, TN, MS, AL, GA, SC (Ref. For More Information) 2006: Palm Springs, California: Mercury soars to 121 °F. (Ref. WxDoctor) 2006: Widespread damaging winds, estimated around 90 mph, raked most of Jefferson County in south central Illinois. The city of Mt. Vernon was especially hard hit, where about 14% of all homes received at least minor damage. In Mt. Vernon, damage assessments indicated 1,107 homes were affected by some type of damage. 491 homes received minor damage such as roofs blown off, 152 received major damage, and 18 were destroyed. (Ref. Wilson Wx. History) 2011: A low of 82 degrees Fahrenheit on the 22nd at Norfolk tied for the second highest minimum temperature ever recorded there. Also the highest temperature for 2011 was 103 °F at Norfolk and 102°F at Richmond both on July, 22nd. (Ref.NWS, Wakefield, Virginia - A Near Record High Minimum Temperature for Norfork)
-
77 / 72 leftover showers and humidity as front fully passes through later today, Probably the warmest of the next 5 mid / uppper 80s. Gorgeous stretch Thu - Sun coming up , similar to Monday low - mid 80s. Next trough/front moves through Mon/Tue and then onto drier calmer. Overall below normal throught he end of the month with ridge and heat west , heat does beging pushing east in the 7/31 - 8/5 period and we'll see how much gets into the area and when the next shot at 90s will be.
-
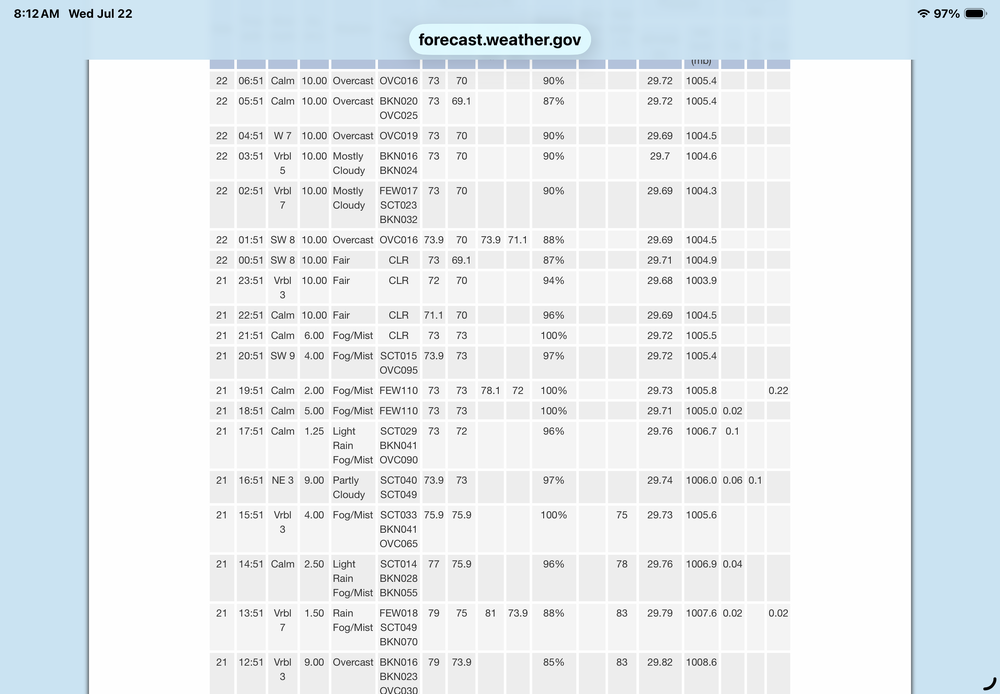
Kind of surprised by the 1651 reading of only 0.06" in CPK. I was in Midtown when that cell flared up at 1600 and it looked like tropical downpours for nearly 10 mins. Sure seemed like a bit more than what they reported.
-
1.83 not sure how.
-
And believed most of them.
-
-

Central PA Summer 2026 Discussion/Obs Thread
mahantango#1 replied to Voyager's topic in Upstate New York/Pennsylvania
Real concert and festival goers will do anything to see their favorite artists. Nothing will stop them unless the promoter says there are unsafe conditions. You are one of those people. I know I am one of those too, been there done that more than once. The worst one was had to evacuate Epicenter festival in North Carolina for tornado warning and sit in our vehicle. Aftermath was bad tent campers stuff destroyed, damage inside festival to one of the stages and several vendors had damage. But festival continued next day with a delayed start. We also experienced the same conditions in Va. with Blue Ridge Rock Festival in 2023 and we were camping at that festival. Luckily we didn't have damage to out tent and canopy we were lucky but a lot of other ones weren't so lucky. A lot lost their tents and canopies and their other stuff got soaked from the torrential rain. There was no warning as the storm formed right over the festival in minutes. -
Central Park reported ,24. As always ….
-
 I heard thunder and saw a crack of lightning yesterday afternoon. By my table of expectations that’s a win for me
 -
Columbia: Another 0.97 inches with the second wave of rain last night bringing the daily total to 1.84 inches and a little over 6 inches now for July. AQI starting the day at a “good” 41.
-
2026-2027 Super El Nino
Typhoon Tip replied to Stormchaserchuck1's topic in Weather Forecasting and Discussion
It's placement geographically is beside the point. The mechanism for it's persistence/necessity in the science of CC attribution et al, or for whatever reason, gets in the way of the NAO/tripole assumption. That is the point. Thus, relying on it as a predictor for atmospheric behavior tendencies/correlations therein, are riskier - because those are driven by disparate total physical processes. The NAO/tripole physics are different than the AMOC for it being a ( possible ) geologic permanent change. I'm not saying the AMOC is collapsing, per se. Maybe it is. Maybe it isn't. However, just advising that it is being scienced as occurring for that reason. So We'll see... But, if so ...the cold blob reflects the AMOC changes... not an NAO forcing (necessarily). Put even simpler... cold blog exists, NAO is biased positive. Tough cookies. The other aspect, the longer term correlation between the Pacific and NAO is transmitted through the N/A via the PNA. It's positive. Which means, when the PNA is positive, the NAO tends to be positive, and vice versa. So ...I'm not sure how a positive ENSO/+PNA correlation favors that -NAO ... it doesn't based on that. But that may not be the whole story - there may be something specific to El Nino that gets that anti-correlation to realize more frequently, during the El Nino winter? These kinds of exceptions exist in principle... worth looking for that. I kind of doubt it though. In the meantime, it makes intuitive sense that a +PNA jives with a +NAO and vice versa, because of winter planetary wave lengths and the speed of the basal flow. It would be hard to maintain a western N/A highly curvaceous flow and then expect the flow to bend back around into block over the D. Straight region, when flow is necessarily screwing along at ludicrous speeds due to the hemispheric gradient during DJF. Fast flow does not like curved surfaces... that's just physics. Curving the flow increases centrifugal -acceleration; and so as the flow speeds up that force is trying to cancel the curvature and flatten out. Ex, in April the flow tends to close off vortices; there is deceleration in the as the geopotential gradient is collapsing. The flow folds in on itself with the loss of basal velocity. That's probably why a latter March thru early May -NAO boat ride isn't that uncommon. Because the flow collapses and the excessive wave transport gets stranded and loads that region. -
The weak dipole pattern has resulted in some parts of the Pacific side having their slowest melt since 1994. This pressure reversal since 2013 has allowed the 2012 low extent record to stand to this day. Since 2012 had big Pacific side melt with record dipole pattern. Some of the climate models actually forecast this weaker dipole pattern with the record mid-latitude heatwaves that we have been experiencing. Rick Thoman @alaskawx.bsky.social Follow Sea ice is very slowly melting the Chukchi Sea, but only slowly. Ice extent as of July 18 is well above last year and is the highest for the date since 1994(!) in NSIDC data. Sea ice in the Beaufort Sea has also been slow to melt but is now slightly lower than mid-July 2025. #akwx #Arctic #SeaIce ALT 2:01 PM · Jul 19, 2026