All Activity
- Past hour
-
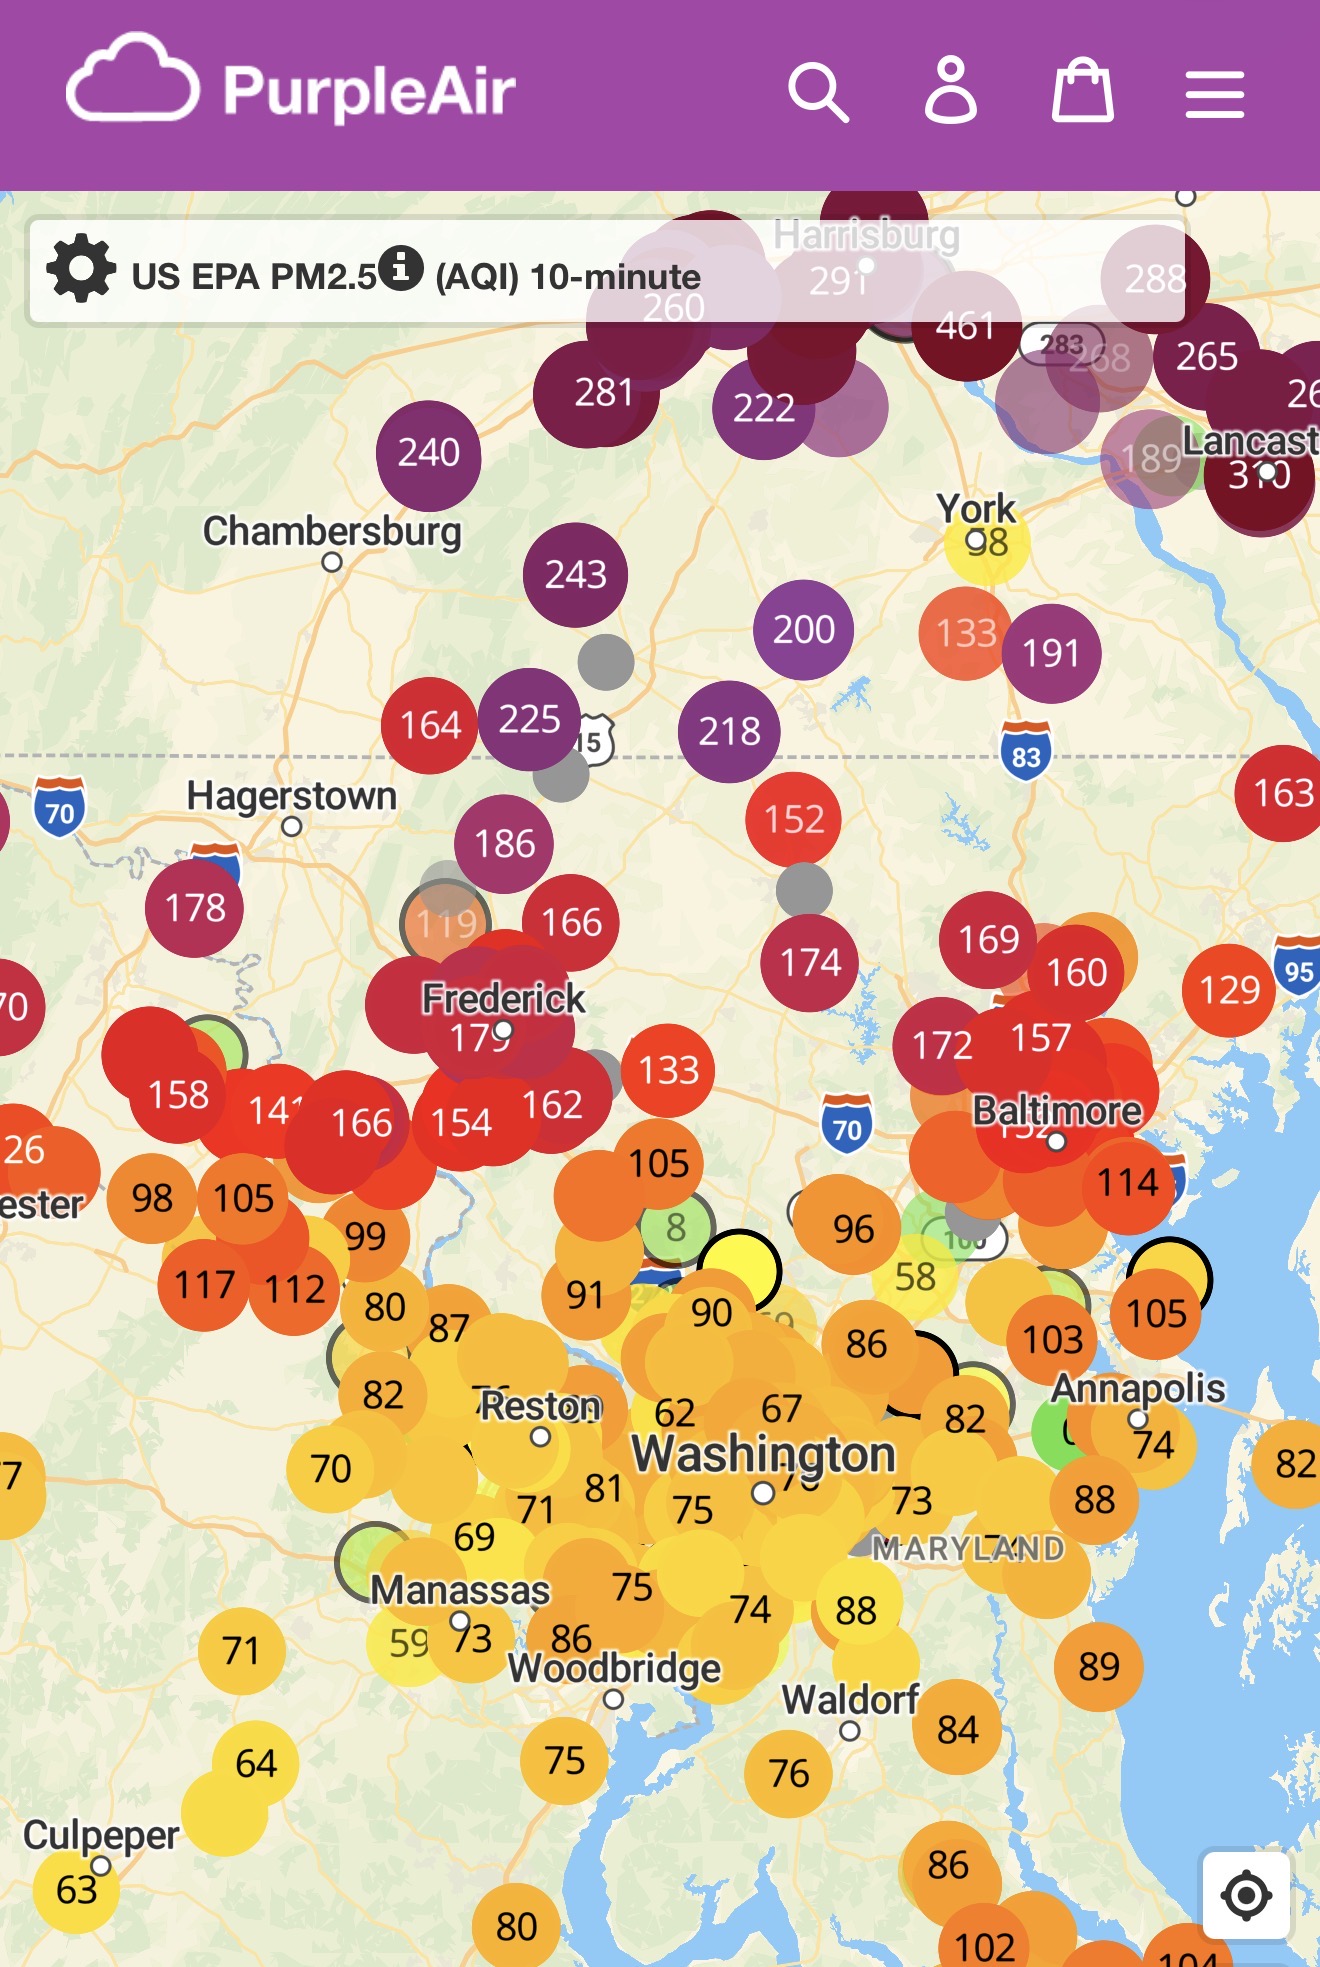
Don't count on it. Yesterday it was so dim that there weren't even any optical effects. Time to break out the PH test kit. There is a pocket to my east of less smokey air as Barrie ON was at 180 last check, unfortunately its not moving my way it is only sagging south to Oshawa. I'm still around 380 but I'm on Day2 of this shit and trust me its far worse than you think it is sustained for this long. I'm a healthy adult who has tried to remain indoors (I briefly went out) and I'm feeling ill effects I know are from this. You almost want to buy a good air purifier and stow away in the basement somewhere.
-
Takes all the fun out of golf.
-
The NAM is woefully outdated as a model. I do not think it has been updated to tweaked in 10 years or so. It is mainly for a "quick, early look" and I think that's why I has stuck around for so long! Generally, I do not use the NAM after 36 hr, as it does odd things. And the model was never designed for TCs, so never use it for them. The NAM and all its derivative models are going away in Oct (was going to be Aug but pushed back), The RRFS will replace it. The RRFS has its issues, but from what I have seen, it does much better than the NAM.
-
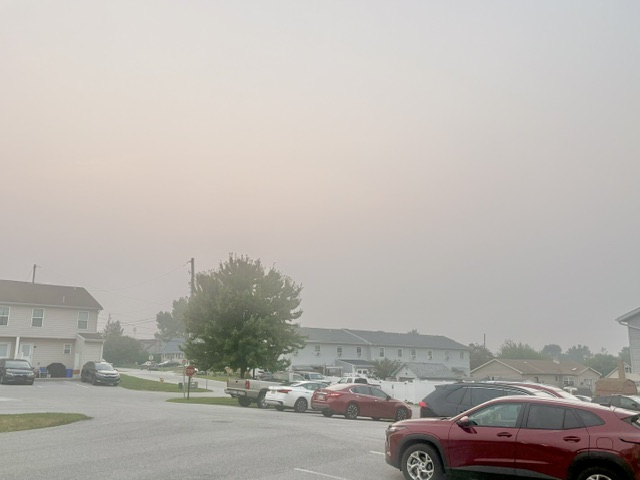
the houses down the street now look like they do in the fog. ugh. the visibility at KMRB has dropped 5 miles in the last 4 hours.
-
Weird wild stuff
-
E PA/NJ/DE Summer 2026 Obs/Discussion
BBasile replied to PhiEaglesfan712's topic in Philadelphia Region
A friend of mine at the Phil's game sent me this photo. Completely healthy atmosphere. lol.thumb.jpg.1bab7cb4566234efa74e28ef1d2d93dc.jpg)
-
The East based Nino folks are not going to agree.
-
E PA/NJ/DE Summer 2026 Obs/Discussion
BBasile replied to PhiEaglesfan712's topic in Philadelphia Region
Wanted to capture a super red sunset, but the smoke is so thick the sun was completely blocked..thumb.jpg.c46563acb8ba50003c9d5c70e30269b2.jpg)
-
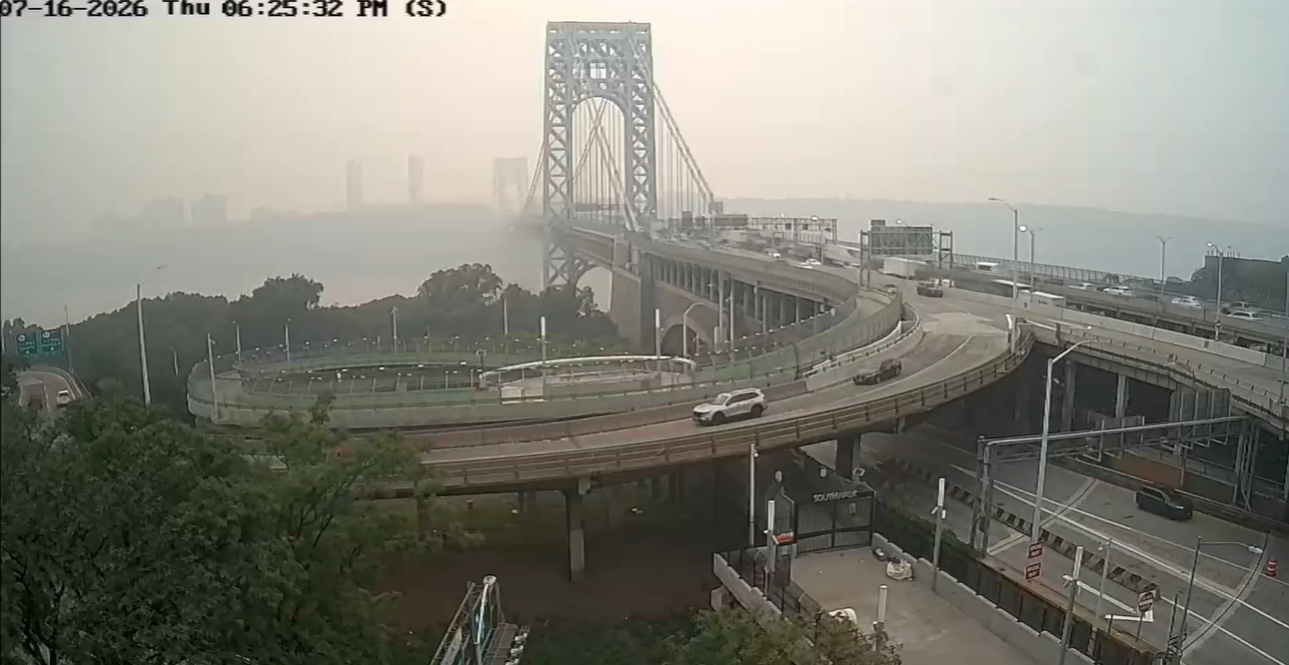
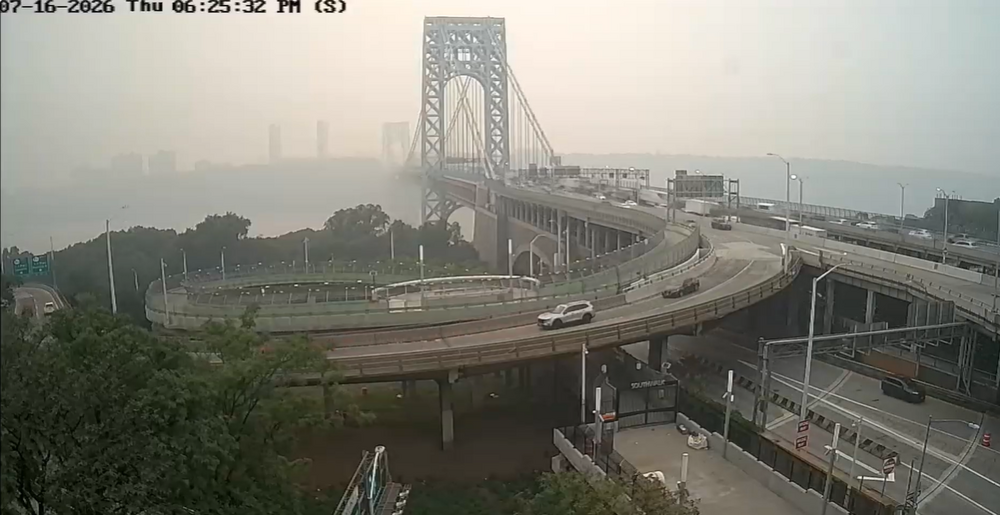
Another hot summer day here. Got to 100.1* today at 15:09 Great view of the GWB looking west towards my home state, Jersey this evening
-
Smoke smell is very strong now. Can see the smoke in the tree tops now as well
-
Seeing some 4 and 5+ inch reports from those jersey storms.
-
 Yes, I figured that is what happened, and you confirmed it. I work w/ fire and smoke detection and mapping where I work. Here is our main product. https://www.ospo.noaa.gov/products/land/hms.html#maps Gets reset every day around 6am, and fire points and smoke areas are added in real time both automatically and manually during the day through late evening. Wind by *far* is the biggest factor in wildfire spread and intensity. And w/ the passage of a cold front you are going to get drier air advected in as well, so smoldering or low-level fires suddenly can get a massive boost. This also happened in central Quebec last summer or the summer before. Smoldering fires ignited by lightning and held at bay by rain occurred, and then the cold front passed, and all at once, you saw multiple fires erupt in sync across the region w/ big smoke plumes. This is was due to strong winds behind the cold front. Some think, "but it just raining a lot, how could things burn so much?" Well, that's a disconnect that exists. Things are a lot more complex than led on. There is a reason why fire wx has it own branch in meteorology, and the nuances and idiosyncrasies are rife and not what you'd expect! It is pretty amazing stuff. The sheer amount of training modules on MetEd/COMET is impressive, so that shows how big and complex this field is. And despite what MSM constantly pushes, drought or hot temps have little or nothing to do w/ wildfires. High winds are low RH are *everything*. You can have the wettest month on record, and then get fire wx warnings not days later. Recall March 2010 how wet it was in SNE, esp. RI? Well, a few days after a big flood event events, fire wx warnings were put up for the region This b/c windy conditions and low RH will dry out grass and shrubs in short order (called 1-hour fuels). Also, being spring, it's all still dead vegetation that burns easily. Open grasslands in the Plains are the same. Massive wildfires occur when no drought is present, again b/c it is largely 1-hour fuels. And in places like CA? Well, you have the wet season, and then the dry season by default, so most everything that sprouts/grows during the wet season, dies and decays in the dry season for a prime fuel load, and the wetter the wet season, often the worse that wildfire season later in the dry season. Couple that w/ Santa Ana winds, and drought conditions are irrelevant. You are going to get dried out and desiccated vegetation for lots of wildfire fuel no matter what every year.
 -
you can thank my best friend forkyfork
-
Is that an app?
-
E PA/NJ/DE Summer 2026 Obs/Discussion
MGorse replied to PhiEaglesfan712's topic in Philadelphia Region
The high dew point and smoke combo this evening is terrible! -

2026-2027 Super El Nino
Stormchaserchuck1 replied to Stormchaserchuck1's topic in Weather Forecasting and Discussion
5 straight days under -34 is pretty impressive 16 Jul 2026 1013.27 1018.25 -36.50 -25.58 -18.73 15 Jul 2026 1012.10 1017.65 -40.01 -24.45 -18.16 14 Jul 2026 1011.36 1016.35 -36.56 -23.53 -17.62 13 Jul 2026 1010.44 1015.10 -34.53 -23.20 -17.20 12 Jul 2026 1009.89 1015.20 -38.53 -23.21 -16.92 It looks like the last time the 30-day was below -30 was 1983. We are -25.58 Since 1905 30 day has only hit -30 twice. 4x since 1876. -
Just went outside for the first time since about 3pm and I can definitely smell the smoke.
-
I have a Kohler 22KW whole house generator (2013) no issues, has about 310 hrs. on it. I do annual service on it, have replaced the battery every 3-4 years.
-
 Power back on here at 7:10 PM. I hit a couple of détours trying to get back to Flying Pond on 41 from Farmington due to downed trees and wires.
 -
Interesting. Thanks.
-
That cell is incredibly unusual. Vis down to less then a mile now at jones beach .
-

2026-2027 Super El Nino
GaWx replied to Stormchaserchuck1's topic in Weather Forecasting and Discussion
We’ll likely exceed 1997’s 72 days, which would put it as 2nd longest on record (back to 1991). But #1 (from 1998) is way up at 100 days. I have no idea if it will get that high. With that still being 33 days away, it would be quite awhile before I could even try to forecast whether or not it will be reached. Since that would be quite the accomplishment, I feel chances are well under 50% as of now. Let’s see how things go. -
It’s coming
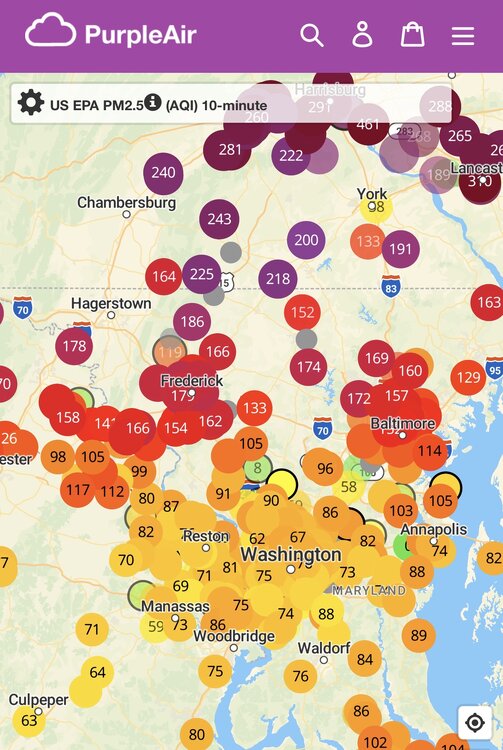
-
Had to play a 6 hour round of golf for a golf outing/fundraiser today. Horrific





.jpg.8497ed148e5ec9b0ba2bc892dea5cdc7.jpg)

.jpg.bd4dd0b3a916e81a12d50ae7470de357.jpg)