All Activity
- Past hour
-
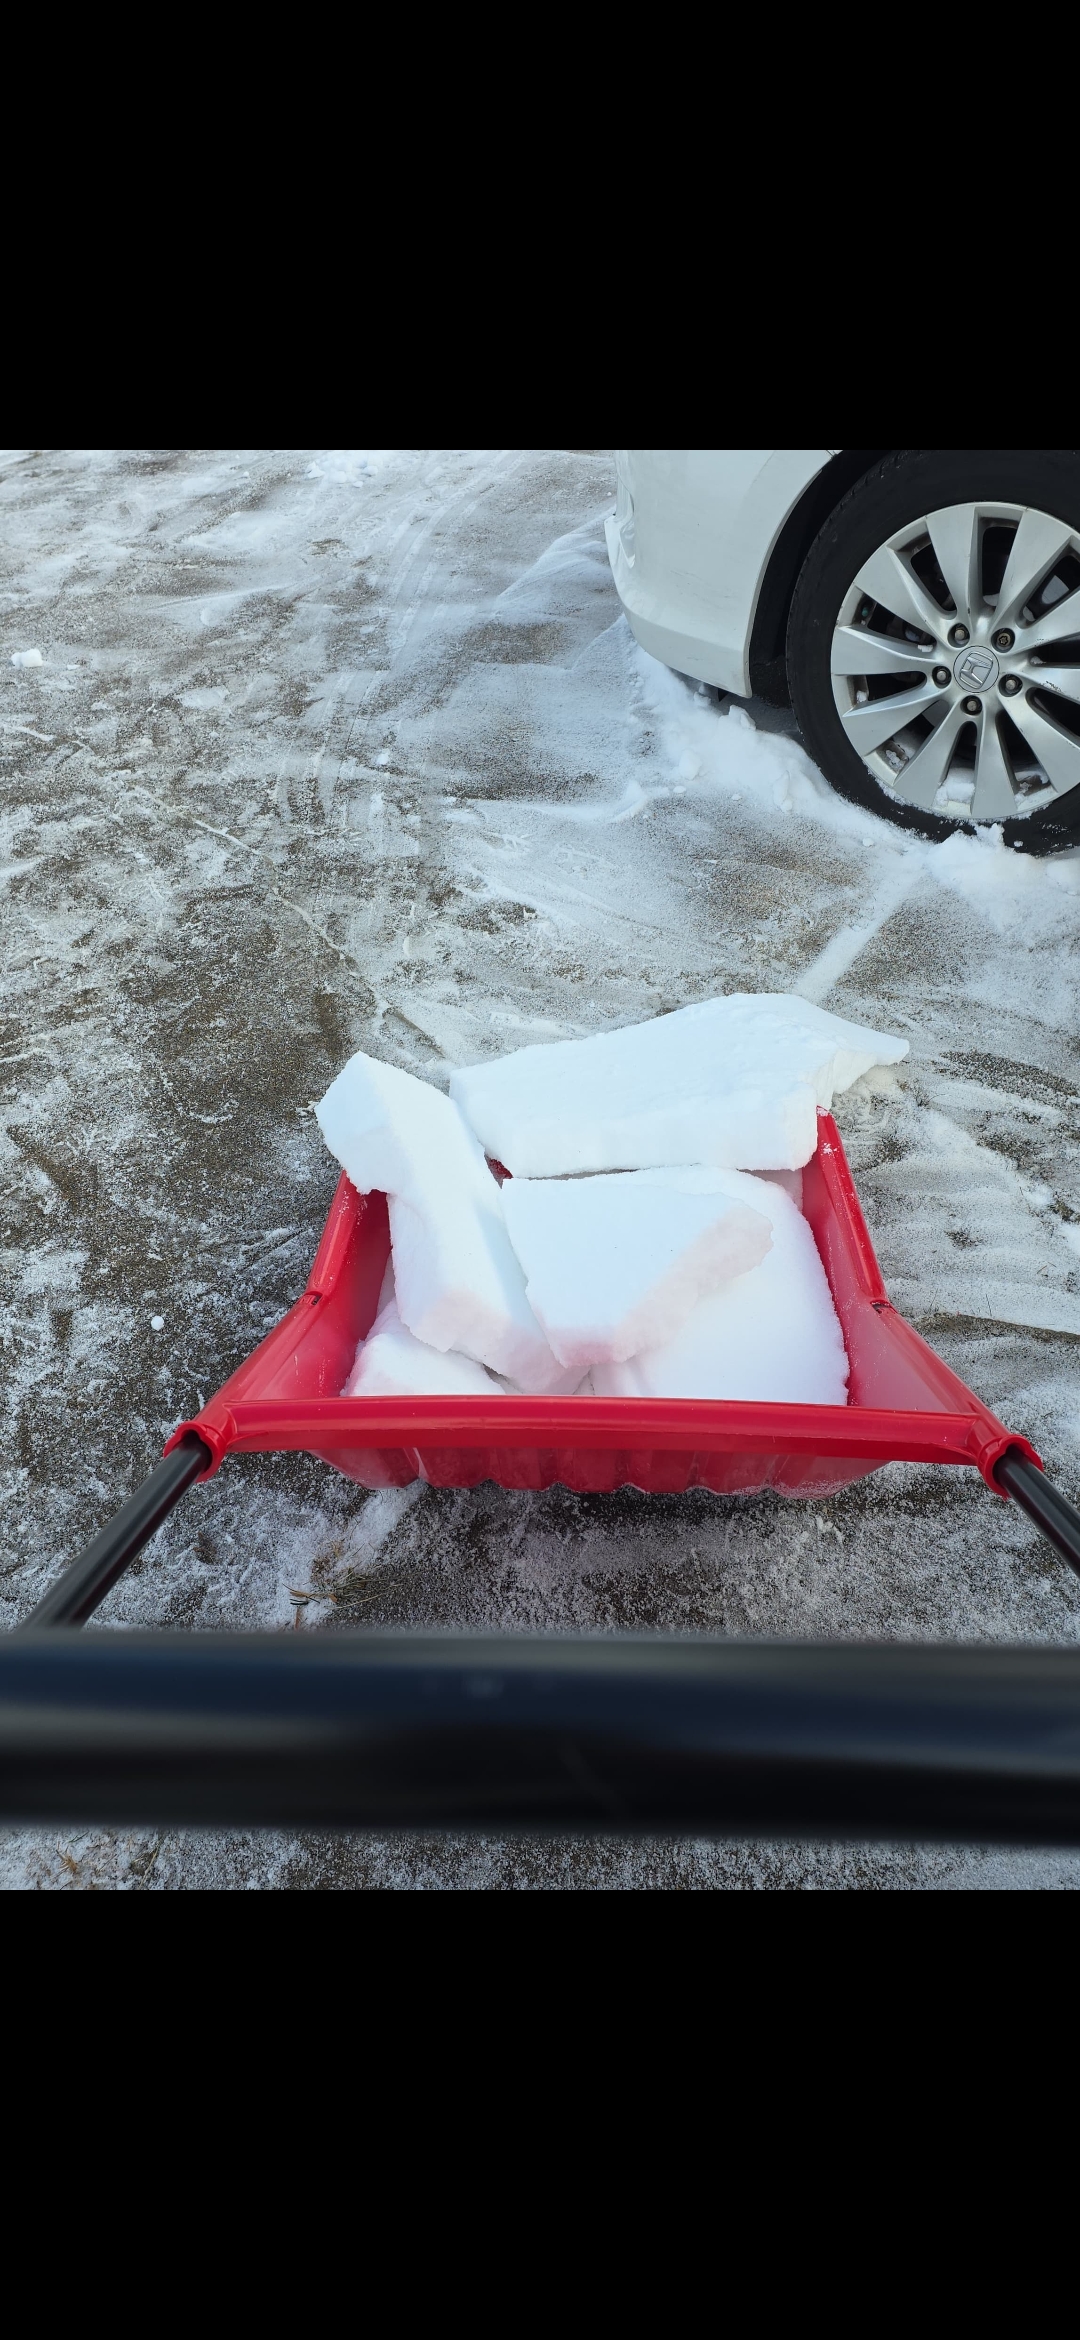
We shoveled snow yesterday then used our super scooper today to get at the compacted sleet. This thing is a game changer. Scraped the sleet off like a hot knife through butter. Currently being passed around the neighborhood, hope we get it back. Its a game changer. What is nice too is the bottom is like a sled so you just slide it up the snow bank and dump. Super easy on the back

-
-
 oh im not, in fact, i make sure to use the main climo sites in every map...and Blue Hill/NWS Norton COOP. So whatever the final is, itll be on there.
 -
I think that’s what weather underground/WeatherBug do.
-
 That map is accurate for MBY. An inch of snow prior to the ice, and about 0.5" of snow last night. The roads were TREACHEROUS this morning in Kingsport. Solid sheet of ice w/ snow on top. Wind chills were around 6F when I got up. They have hovered there all day w/ the current gusts.
 -

1/24-1/25 Major Winter Storm - S. IL, IN, and OH
Roger Smith replied to A-L-E-K's topic in Lakes/Ohio Valley
Toronto City as it is now known used to be a first-order station from its founding in 1840 through to about the 1980s, it gradually became more of a well-maintained climate station but the data have been reported more or less daily all along and I took it upon myself to maintain the data base even though Environment Canada nowadays seem to ignore that data base and only give out press releases about YYZ (Toronto airport, located about 12 miles west of downtown Toronto) where the period of record is 1938 to present. So there are a lot of very significant climate records like the 1936 heat wave that aren't in the YYZ data base. Toronto City has always been located somewhere within 0.5 miles of its longest situated location at the old headquarters building of the former Dominion of Canada weather service at 315 Bloor Street West. This building, next to Varsity Stadium, is now part of the U of T campus. Before 1908 the observations were made about 0.5 miles southeast of there near what is now Hart House and was then Kings College, basically a block west of Queens Park (the Ontario legislature building). Some time around 2003 they stopped making observations at the old h.q. building (which had been replaced by a much larger modern version in suburban Toronto), and moved the instruments to a suitable well-exposed location near Trinity College on the university campus. I assume it is read once daily around 0800h and also the instruments seem to be capable of sending some data hourly because the station reports are hourly as well as daily even nowadays. There was a problem with missing data, I worked through all missing data cases and found that 90% of them could easily be estimated from the hourly observations because those "missing" days were only missing an hour or two and not usually ones critical for estimating max and min temps. Whether by luck or design, almost all the missing days (I would say maybe a total of 50 from 2003 to 2025) are evidently dry days from regional zero reports. I also found that 2020 rainfall data had been compromised to some extent by daily small values that appeared to be the result of lawn sprinkler water getting into rain gauges (Toronto City was showing rain almost every day for several months when other stations were dry). So it's a bit of a challenge to maintain this data base but I have done it best as I can -- as they close in on 200 years of data, I feel they should duplicate my work (I know from experience they won't accept anything I say as in Canada I am basically a non-person) and bring the records back from the dead. Up until around 1980 there was a fully maintained data base with daily records etc. So I have basically extended that to the present day. I was going off memory quoting some of the all-time records, now that I have my file open I can be more precise. The existing one-day records and top ten calendar day amounts (any before 1978 were originally recorded in inches and those after 1978 have been converted from metric) for Toronto City are 1. 19.0" Dec 11 1944 t2. 18.0" Feb 14, 1850, Feb 22, 1846 t4. 16.0" Feb 5, 1863 and Mar 27, 1870 6. 15.7" Jan 23 1966 t8. 15.0" Jan 20 1867 and Mar 21, 1867 and Dec 25 1872, Dec 29 1855 12. 14.9" Jan 2 1999 (38.0 cm) Two-day record values (probably overnight storms) are 23.0" Dec 25-26 1872 (15.0 + 8.0) 22.5" Dec 11-12 1944 (19.0 + 3.5) 22.0" Feb 22-23 1846 (18.0 + 4.0) 20.0" Mar 15-16 1870 (10.0 + 10.0) 19.5" Jan 23-24 1873 (14.3 + 5.2). 18.0" Jan 20-21 1867, 16.6" 18.0" Feb 5-6 1863 (16.0 + 2.0) and also 24-25 1868 (12.0 + 6.0) (18.0" Feb 1850 daily value was not increased by any amounts either side) 16.6" Jan 22-23 1966 16.5" Mar 21-22 1867 15.5" Mar 8-9 1931 (12.5 + 3.0) also Mar 20-21 1876 (9.0 + 6.5) _______________________ The Nov 2d record is 12.5" from Nov 24-25 1950 and the April record is 9.4" from Apr 2-3 1975. As you can see almost all the top ten snowstorms were before YYZ data began. The average snowfall in 19th century winters was about 25% greater than any 30-year averages in the 20th century. 1869-1870 was the snowiest winter back in that era. -
Pittsburgh/Western PA WINTER ‘25/‘26
MikeB_01 replied to Burghblizz's topic in Upstate New York/Pennsylvania
i said it late last night, but for once, the DWTOD didnt win. And i thought it was modeled extremely well -

Pittsburgh/Western PA WINTER ‘25/‘26
Mailman replied to Burghblizz's topic in Upstate New York/Pennsylvania
Appears we're in it for the long haul. -
The Weather Next precip shield has expanded west 3 runs in a row.
-
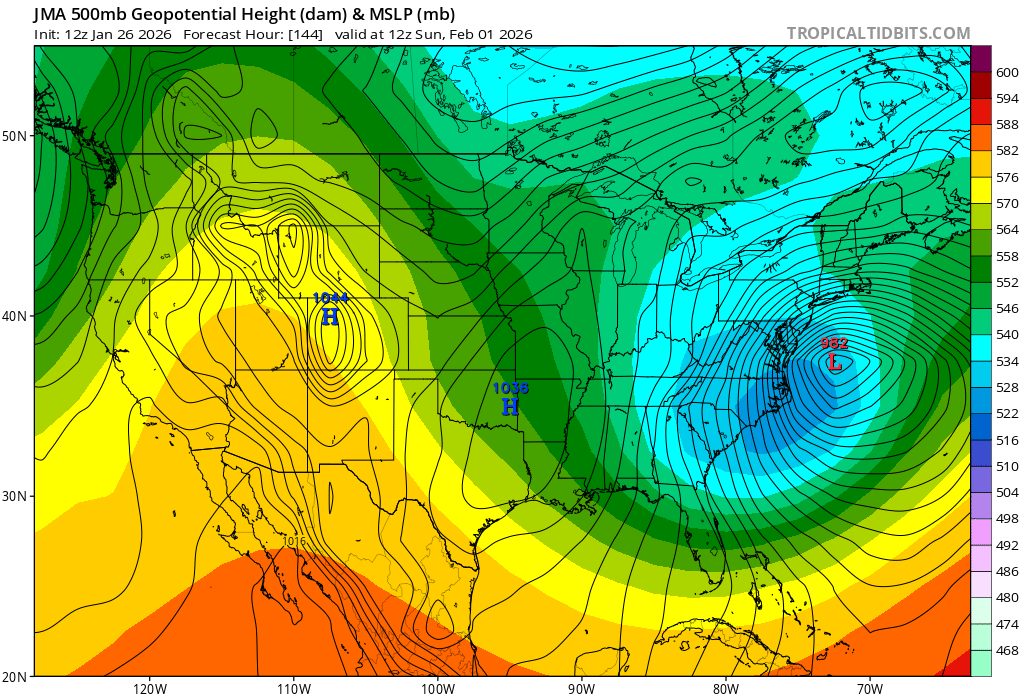
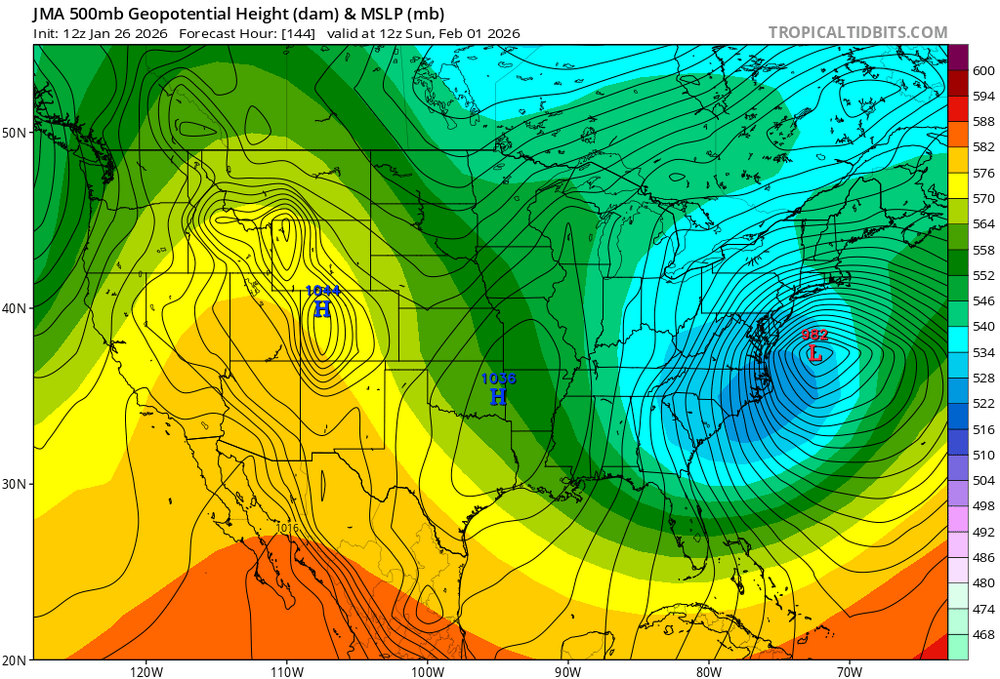
.thumb.png.4150b06c63a21f61052e47a612bf1818.png) Just shows how rare storms with ideal snow growth across the region are.
Just shows how rare storms with ideal snow growth across the region are. -
 Agree. But you can’t really delete it since it’s kind of a legacy site right? Official records going pretty far back
 -
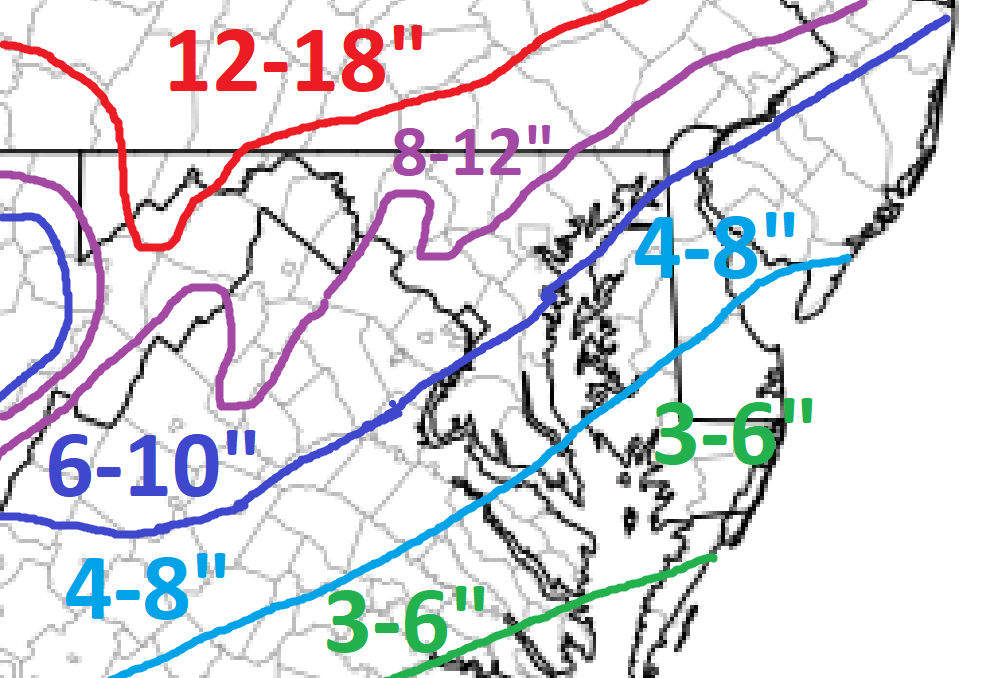
Not grading my last minute adjustment as the storm started for many by then. This is the one I put out 2 days before. I think 90% ended up within the ranges. BWI busted high by 1”. I was too high along the southeast fringes. I’m ok with this.
-

The “I bring the mojo” Jan 30-Feb 1 potential winter storm
wxfool replied to lilj4425's topic in Southeastern States
There were snowdrifts up to 8' on the Crystal Coast from that event. -
Got up to a balmy 28.6 before falling back to 27.3 now. Sun is doing some good work on spots that I shoveled. Still a heck of a lot of shoveling to go....
-
Pittsburgh/Western PA WINTER ‘25/‘26
Mailman replied to Burghblizz's topic in Upstate New York/Pennsylvania
Still shocked I only had 5 minutes of mixed precipitation. -
Apologize if this is stupid, but what's stopping them from just verbatim copying the GFS? AFAIK its public domain and, even if bad practice forecasting wise, would be leaps and bounds better than whatever they're doing right now.
-
Hey Bob! Good to here from you. I always admire your common sense knowledge. You're guidance is well taken. 2 questions It seems that the Euro deterministic has a difficult time differentiating between sleet and freezing rain. There was a large swath of significant freezing rain southwest/northeast across western Va.. I posted Sunday morning that I didn't buy this because 925 temperatures were too cold. In fact, freezing rain was minimal. Thoughts? Last, the AI ens. doubled the received amount of snow on December 8. It nearly tripled the amount received for Augusta County last weekend. Thoughts?
-
They could save money and processing power and just ask Bastardi how much snow. Would probably actually be more conservative in totals.
-
The “I bring the mojo” Jan 30-Feb 1 potential winter storm
wncsnow replied to lilj4425's topic in Southeastern States
Here are the CIPS analogs (March 1980 is number 1)
-
.
-
-
 Legitimately the beef I been silently fuming over all morning Sent from my SM-S166V using Tapatalk
 -
This is correct. Can’t tell ya how I know (some of you in here may know what I do for a living) What I can tell you is it’s something that’s being worked on.
-
no, that's what Dendrite looks like.
-
No idea. But I agree it’s absurd