All Activity
- Past hour
-

Central PA Spring 2026 Discussion/Obs Thread
Jns2183 replied to Voyager's topic in Upstate New York/Pennsylvania
We also have had 3 straight years below normal rainfall with mean deficit of 10%. Nothing has been able to recharge and the antecedent dry background condition amplifies a single dry month significantly Sent from my SM-S731U using Tapatalk -

2026-2027 Strong/Super El Nino
Stormchaserchuck1 replied to Stormchaserchuck1's topic in Weather Forecasting and Discussion
^Right, I'm just running all the data (73 years +events) and showing that in the data there isn't really a difference. -

2026-2027 Strong/Super El Nino
snowman19 replied to Stormchaserchuck1's topic in Weather Forecasting and Discussion
A recent (2025) research paper came up with this conclusion about +PMM El Niños: “A positive Pacific Meridional Mode (+PMM) acts as a crucial driver for developing eastern Pacific (EP) El Niño events, particularly by facilitating wind-evaporation-SST (WES) feedback that warms the subtropical Northeast Pacific and promotes westerly wind anomalies at the equator. This interaction commonly triggers EP-type El Niño, characterized by peak warming in the eastern Pacific, as opposed to the Central Pacific (CP) type.” Link to the research paper: https://www.science.org/doi/10.1126/sciadv.adv8621#:~:text=Other climate modes further complicate,and NPO%2C on ENSO evolution. -

2026-2027 Strong/Super El Nino
bluewave replied to Stormchaserchuck1's topic in Weather Forecasting and Discussion
We had a smaller temperature rise with the 80s into early 90s El Niño events since we were just coming out of the cooler climate prior to 1980. The first global first significant temperature jump occurred in 1997-1998. Then the next one in 2015-2016. Followed by 2023-2024. We didn’t find out what the CRCs were until after the events. So it’s going to take some time to know how all the details following this event also. https://www.nature.com/articles/s41467-025-66143-7 Climate regime shifts (CRSs), characterized by abrupt and persistent transitions between alternative stable states in the climate system, pose serious threats to ecosystems and human well-being. Understanding the potential drivers of CRSs is crucial, particularly in a warming world where CRSs are becoming more frequent. Here, using multiple observations and model simulations, we find that the likelihood of CRS occurrence significantly increases in the context of super El Niño events due to their remarkable climate perturbations. This higher probability is detected across various climate elements, such as surface air temperature, sea surface temperature, and surface soil moisture. In addition, we suggest that this boost effect of super El Niño events on CRSs will be greatly amplified under future greenhouse warming. Our findings underscore a deeper and more persistent climate footprint of super El Niño events, suggesting that early warnings and proactive measures are crucial for mitigating their escalating risks.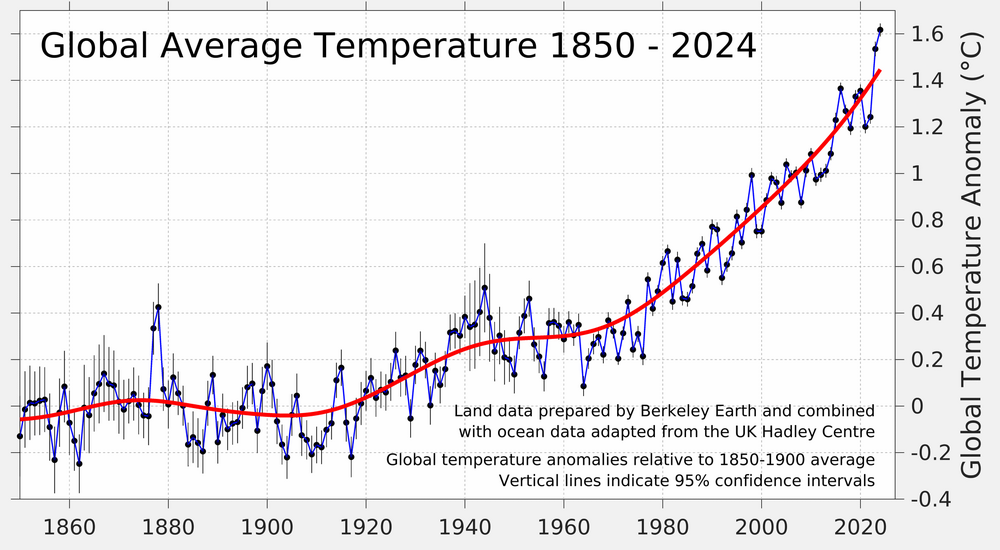
-
A nice cool morning with a low of 37 this morning.
-
Central PA Spring 2026 Discussion/Obs Thread
Jns2183 replied to Voyager's topic in Upstate New York/Pennsylvania
I think a big part of this is where you are located. There is a world of difference between what I'm tracking in Lancaster vs Adams county over the last 90 days soil moisture wise. One is not even -0.5 std dev below normal while the other is flying to -1.5 fast. Here are the precipitation departure from normal over some time periods Sent from my SM-S731U using Tapatalk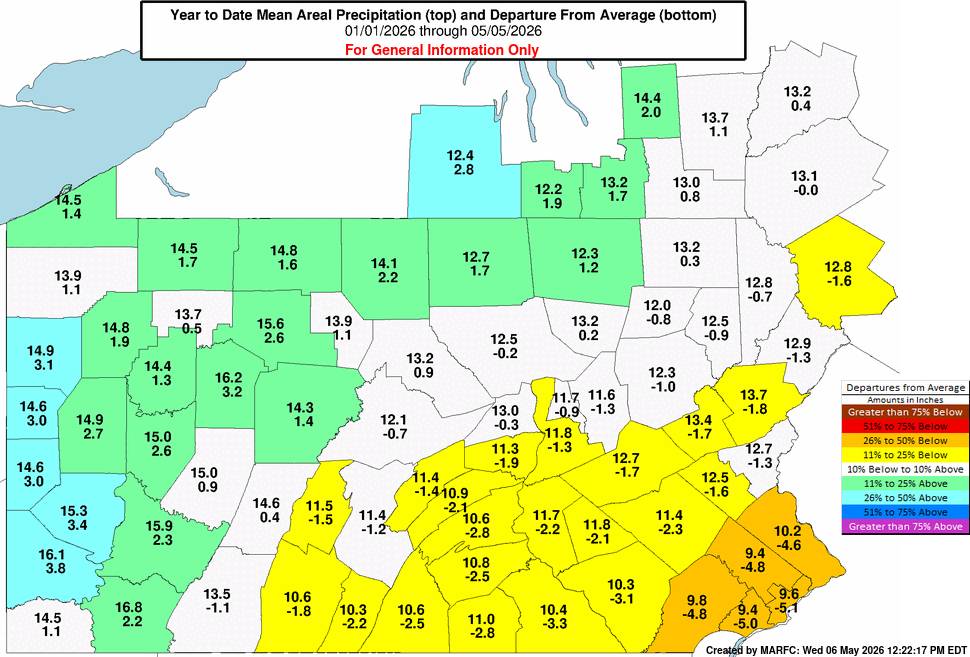
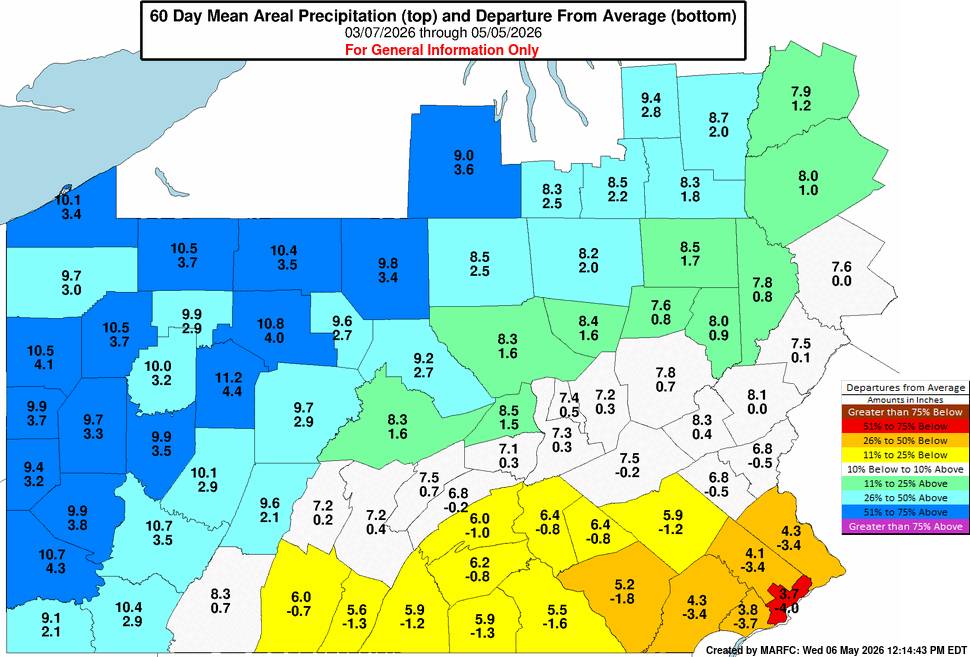
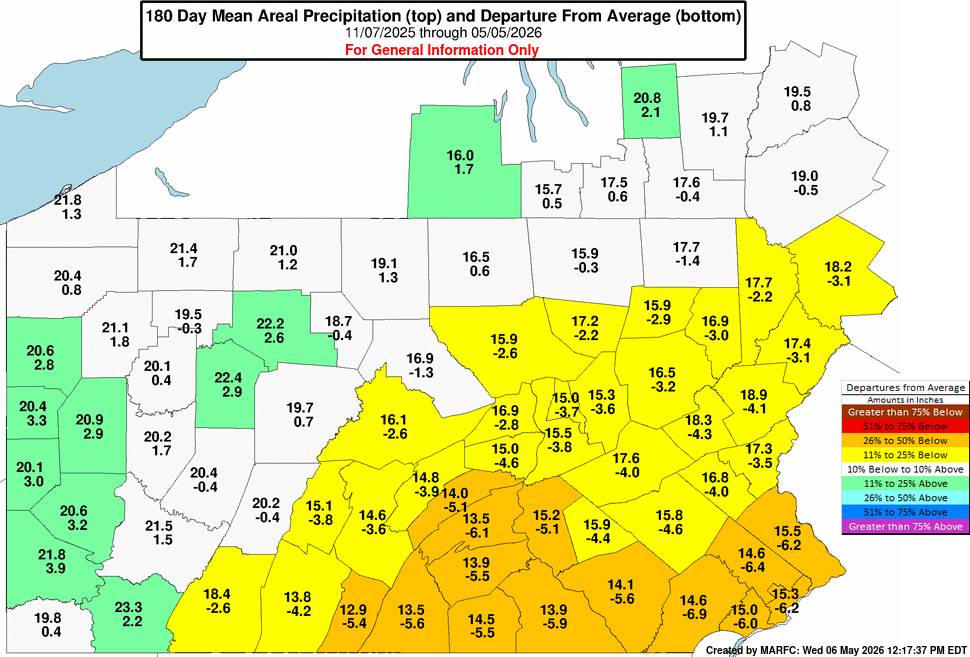
.jpg.899f2dde50b7a66b12858657d303cc56.jpg)
-
2026-2027 Strong/Super El Nino
Stormchaserchuck1 replied to Stormchaserchuck1's topic in Weather Forecasting and Discussion
Not much of a May PMM difference between Nino 4, 3.4 and 1.2 based later-in-the-year El Nino's. If anything it's probably strongest for Nino 4 -
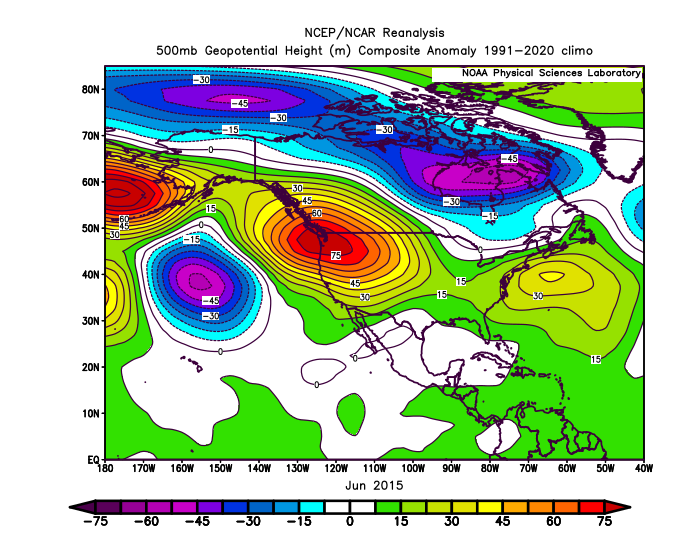
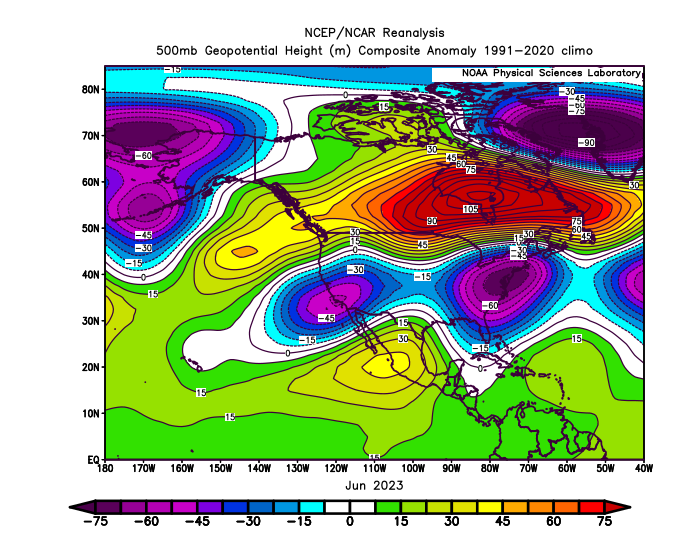
We will have to wait and see since we aren’t getting the extreme ridge over Canada like we had from May into June 2023 leading to the record air pollution in NYC from the Canadian wildfires. Notice how 2015 started off warmer in June than 2023 which set the pace for the whole summer. While a much warmer winter has been a given with super El Niños like 1983, 1998, 2016, and 2024 we did find a way to get a generally warmer summer in 2015 with over 30 days reaching 90°. Even the 2023 summer which was closer to average still had 29 days due to the late warm up into September. Time Series Summary for NEWARK LIBERTY INTL AP, NJ - Jan through Dec 90° days Click column heading to sort ascending, click again to sort descending. 2025 39 0 2024 33 0 2023 29 0 2022 49 0 2021 41 0 2020 31 0 2019 27 0 2018 36 0 2017 22 0 2016 40 0 2015 35 0
-

Central PA Spring 2026 Discussion/Obs Thread
mahantango#1 replied to Voyager's topic in Upstate New York/Pennsylvania
35 with just a touch of frost this morning. -
Winter 25-26 (All Snowfall Maps & Season Total)
The 4 Seasons replied to The 4 Seasons's topic in New England
All the climate sites came in above normal but ISP had a crazy good winter with near 200% of normal snowfall, same with PVD (mostly from one storm) Long Island and the Cape/S. Coast did really well overall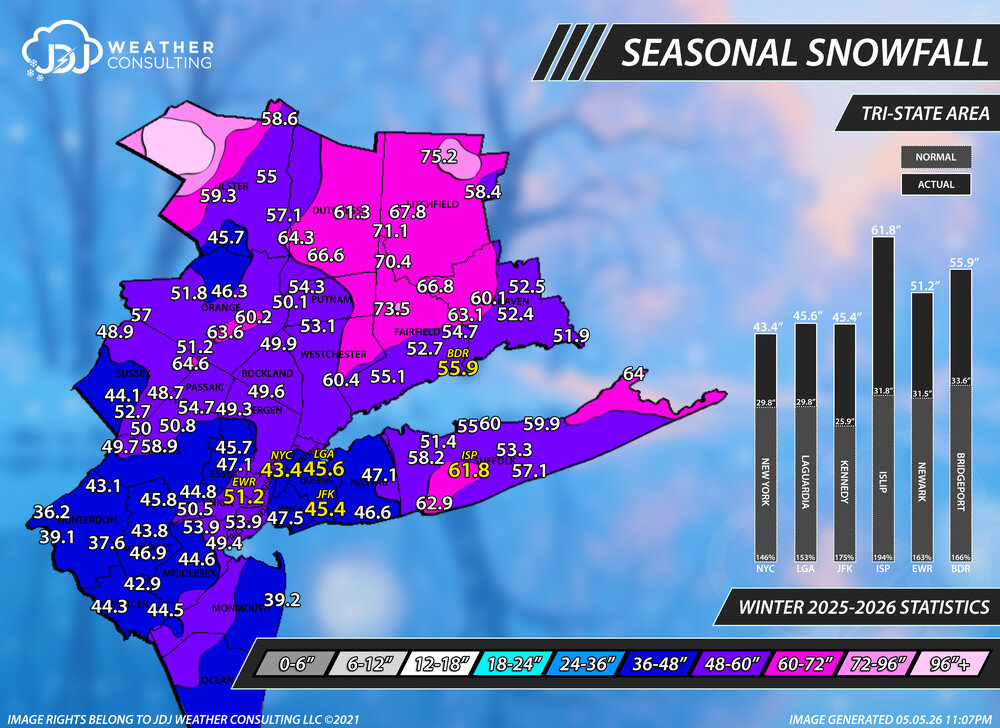
-
We need one or two loaded up El Niño southern jet setups to make it this far north with cold air. We don’t want too much blocking to squash everything south.
-
2026-2027 Strong/Super El Nino
Stormchaserchuck1 replied to Stormchaserchuck1's topic in Weather Forecasting and Discussion
Again, +2 years after a Solar Max correlates with El Nino at 0.2 (57%). Here is the Winter composite +2 years after Solar Max There were/are 3 things going for El Nino this year: 1. We had 5/6 La Nina years (RONI). History says ENSO balances that out in the next 1-3 years, 2:1 El Nino vs La Nina tendency. 2. We had a Strong El Nino 3 years ago (23-24). History says that there is a "2nd wave", as similar event happens vs dissimilar 2:1, 3-5 years after Strong ENSO event. 3. Solar Max +2 years is a pretty strong El Nino composite: - Today
-
Sneaky 33° this morning and tomorrow AM is supposed to be the cooler one. A little patchy frost out there.
-
2026-2027 Strong/Super El Nino
Stormchaserchuck1 replied to Stormchaserchuck1's topic in Weather Forecasting and Discussion
Phase shift.. it will be interesting to see if the N. pacific low responds. So far there are no signs of it on long range ensembles, even though ENSO usually correlates with it pretty strongly in the NPH area in May -
The STJ should be active. Thats step 1. Step 2 would be blocking. Step 3 would be a negative EPO/ AO.
-
Central PA Spring 2026 Discussion/Obs Thread
Jns2183 replied to Voyager's topic in Upstate New York/Pennsylvania
Imagine you wake up one morning and patent the following revolutionary process: you walk to your mailbox, open it, read the letters inside, and then tell your spouse whether the bills are good or bad. Congratulations, you are now the sole licensed operator of checking mail. Every postal worker, every homeowner, every apartment dweller now owes you a royalty check for the cognitive crime of retrieving and interpreting written correspondence. This is essentially what Athenium LLC ( a troll of all trolls) did with US Patent 11,644,597, except instead of mail they used three freely available government weather databases that your tax dollars already paid for, applied math so simple it would embarrass a middle schooler, and then had the audacity to claim they invented "ice storm risk scoring", a thing meteorologists have been doing since before most of Athenium's employees were born. The United States Patent and Trademark Office, in its infinite wisdom, looked at this and said "yes, this is a novel human achievement worthy of 20 years of legal protection," which says everything you need to know about why your insurance premiums keep going up. Approved in 2023 and I'm at a loss at how exactly a patent inspector can reach heights of such incompetence that I found 7 instances of the exact workflow patented in research papers well before they applied for this and it took me 36 minutes exactly. I wish I could force a conflict with the NWS and them but all they want is to try to sue insurance companies and their entire worth to humanity is less than a mosquito in the Amazon. https://patents.google.com/patent/US11644597B2/en?q=(G01W1%2f14+-+Rainfall+or+precipitation+gauges)&q=(G01W1%2f10) Sent from my SM-S731U using Tapatalk
-
Frosty this morning
-
IMO odds favor the colder/snowier 2026 -2027 Winter as other factors that helped create last winters below normal temps will repeat next winter.
-
2026 Mid-Atlantic Severe Storm General Discussion
high risk replied to Kmlwx's topic in Mid Atlantic
What a bummer. We're about to enter what I consider our climatological "legit severe" peak, and looking through the next 2 weeks, I can barely find chances of thunder, much less severe. And yes, I consider our peak from around May 10 - June 20. After June 20, we can get some localized wind and maybe a derecho every 5-10 years (and of course a tropical system), but our best threats for organized, higher-end severe in my mind usually falls during that period.- 312 replies
-
- 1
-

-
- severe
- thunderstorms
- (and 7 more)
-
Running a -5.5 for the first week of the month, only + day was the 6th (+2.4 degrees) and looks like Saturday and Sunday may be the only days with a chance at positive numbers thru the next 7 days. Chilly May start.
-
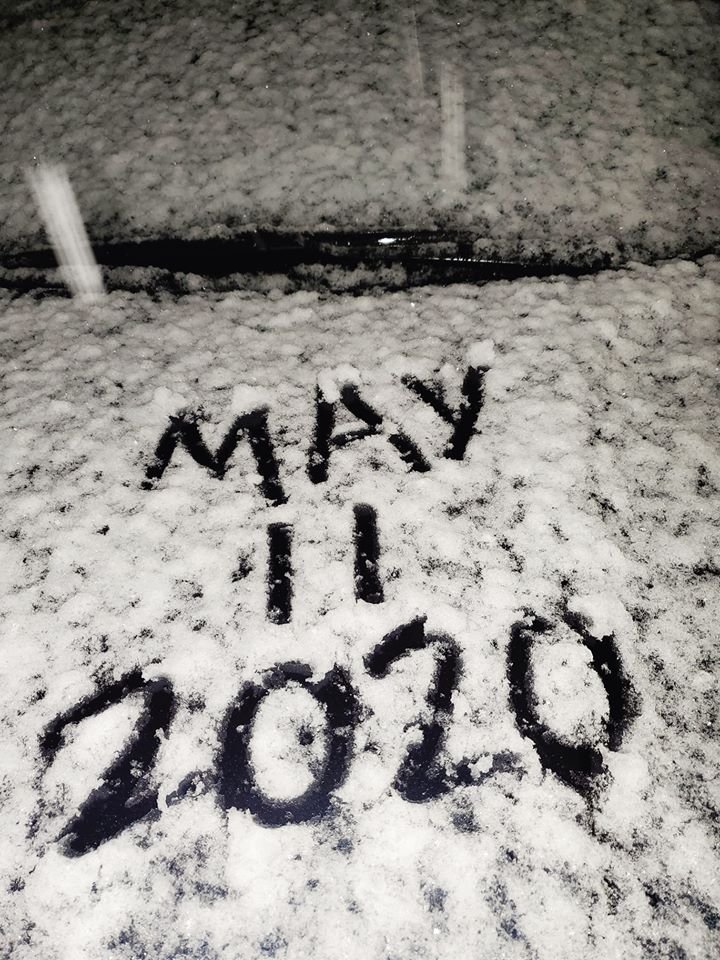
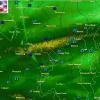
We had snow late evening May 10, 2020. I had 0.7", DTW 0.5".
-
My area got only a couple of hundredths today (all this morning), much less than expected and thus disappointing. But I’m still thankful we got 1.2” on Saturday (5/2) and am also looking forward to weekend prospects for good rains. It’s overall still going in the right direction.
-

Central PA Spring 2026 Discussion/Obs Thread
Ruin replied to Voyager's topic in Upstate New York/Pennsylvania
I live in the orange area and we have had rain the last month like 2-3 days a week. while some of it was showers and was only .20 we had other rain events 1.24 1.01 .86 .66. May 5, 2026, Harrisburg has experienced rainfall total of 11.56 inches, which is a deficit (departure) of -1.39 inches compared to the 13.95 inches average typically seen by this date. we are only down 1.39 This update doesnt even include the thge last round of rain where we picked up about .40 so that means we are about a 1 inch down. no way we should be in the orange color of drought -
Hey Steve... great work... would certainly consider using it... Is the rainfall (in/hr) working???
-
That map is so wrong. Showing 1 to 1.5 inches for my overall area within 40 miles, we got 4.8 inches in that area. Not sure where the data is coming from.