All Activity
- Past hour
-
 At what stage did you have it review the NCEI adjustment criteria? Did you assess the wording of the prompt? As noted in my comment, I do not believe you went to any of the extremes taken by the social media musician in question. I hope that you didn't take my reference to suggest or imply any kind of accusation. At work, I sometimes use AI to complement my analysis of information. AI is never a substitute (if it were, then automation, not augmentation is a better approach). My use of AI for complementary analytical purposes is taken from multiple angles, as I am very hesitant to influence the outcome. I am continually worried about unintended introduction of bias into the work. I am also concerned with AI sycophancy. I also know from speaking to some power users of AI (I'm not one), there's still a lot more to learn. And that doesn't even consider AI's rapid evolution. Indeed, OpenAI's Sam Altman suggested recently that some of the newer models being tested have either approached or reached singularity (we'll see if that's true once those models are released and examined more closely). In using AI to complement my own analysis, I am looking for blind spots/areas I might have missed, seeking expanded perspectives/interpretations, looking for subtle relationships among variables that might require further exploration, etc. In what is an iterative exercise, I've often found that even modest changes in the initial prompt followed by the same sequence of follow-ups can lead to fairly different outcomes. Use of different AI's (Claude, ChatGPT, Gemini) also can result in differences (each seems to have its own character so to speak). Ultimately, I view these differing outcomes as potential scenarios or conclusions (in weather terms, much like one views solutions from different ensemble members).
 -
Current radar
-
Records: Highs: EWR: 101 (1949) NYC: 97 (1999) LGA: 98 (1948) JFK: 98 (1949) Lows: EWR: 58 (1962) NYC: 55 (1920) LGA: 60 (1984) JFK: 57 (1977) Historical: 1609: The Sea Venture was crippled by a hurricane as it headed to Jamestown, VA with provisions for the starving colonists. The 150 men, women and children found safe shelter on the Bahama Islands, which the captain named Somers Islands after the ship's captain. Most of the colonists moved into Virginia the next year, but the island still celebrates Somers Day each July 28. (Ref. Wilson Wx. History) 1819: A small but intense hurricane passed over Bay Saint Louis, MS. The hurricane was considered the worst in fifty years. Few houses were left standing either at Bay Saint Louis or at Pass Christian, and much of the Mississippi coast was desolate following the storm. A U.S. cutter was lost along with its thirty-nine crew members. The storm struck the same area that was hit 150 years later by Hurricane Camille. (David Ludlum) (Ref. WxDoctor) 1819 - A small but intense hurricane passed over Bay Saint Louis, MS. The hurricane was considered the worst in fifty years. Few houses were left standing either at Bay Saint Louis or at Pass Christian, and much of the Mississippi coast was desolate following the storm. A U.S. cutter was lost along with its thirty-nine crew members. The storm struck the same area that was hit 150 years later by Hurricane Camille. (David Ludlum) 1898: A severe thunderstorm produced considerable hail (some stones to 11 ounces) in Chicago, Illinois business district. Some people were hurt, not by hail, but by several hundred runaway horses spooked by the hailstones. 1930 - The temperature at Greensburg, KY, soared to 114 degrees to set a state record. (The Weather Channel) 1934 - The temperature at Grofino, ID, climbed to 118 degrees to establish a record for Idaho. (The Weather Channel) 1935: Sheridan, WY recorded their all-time record high minimum temperature of 77°. The afternoon high of 106° was their second hottest temperature ever. (Ref. Wilson Wx. History) 1952 - A severe storm with hail up to an inch and a half in diameter broke windows, ruined roofs, and stripped trees of leaves near Benson, AZ. The temperature dropped to 37 degrees, as hail was three to four inches deep, with drifts 46 inches high. (The Weather Channel) 1952: The 99° temperature at Washington, DC set date record and month's mean of 80.9 gave 2nd warmest July. (Ref. Washington Weather Records - KDCA) 1974: Avon Park, Fla.--a 6-year old girl was killed by lightning while outside manually turning a TV-antenna pole for better reception. Fallsburg, NY - A mid-afternoon thunderstorm killed one golfer and injured another. Eastern Pennsylvania--One death and three injuries were reported to have resulted from lightning strikes. Hamilton County, Ohio--A boy was killed by lightning while walking from field to farmhouse. (Ref. Lightning-The Underrated Killer.pdf) 1976: A severe thunderstorm produced a tornado causing F3 damage in Madison County in Illinois The twister destroyed 11 homes, two churches, and a school in the western part of New Douglas and was responsible for 3 deaths and 30 injuries. (Ref. Wilson Wx. History) 1986 - Severe thunderstorms moving out of South Dakota across Iowa produce high winds which derailed eighteen piggyback trailer cars of a westbound freight train near Boone, IA. Sixteen of the cars fell 187 feet into the Des Moines River. The thunderstorms also spawned a number of tornadoes, including one which caused twenty-five to fifty million dollars damage at Sloan, near Sioux City, IA. (Storm Data) 1987 - Thunderstorms in Nevada produced wind gusts to 70 mph at Searchlight, reducing visibilities to near zero in blowing dust and sand. Thunderstorms in Montana drenched Lonesome Lake with 3.78 inches of rain. (The National Weather Summary) 1988 - Thunderstorms drenched Wilmington, NC, with 3.33 inches of rain, bringing their monthly total 14.46 inches. Seven cities in Michigan and Minnesota reported record high temperatures for the date. Marquette, MI, hit 99 degrees, and the record high of 94 degrees at Flint MI was their tenth of the month. (The National Weather Summary) 1989 - Afternoon thunderstorms produced large hail and damaging winds in Massachusetts. Early evening thunderstorms over Florida produced wind gusts to 68 mph at Fort Myers, and evening thunderstorms in South Dakota produced nearly two inches of rain in twenty minutes at Pierpoint. (The National Weather Summary) (Storm Data) 1995: A 15-year-old girl was struck and killed in Northampton County as she walked along Smith Beach, VA. Also on this day, in Danville, VA a woman was slightly injured by lightning while standing near a window in her house. (Ref. Lightning - Virginia Weather History) 1995: A heat wave prevailed across the southwestern U.S. Yuma, AZ reached its all-time high temperature reading with 124°. Palm Springs, CA hit 123° on this date and the 29th tying their all-time record high (7/10/1979 & 8/1/1993). It was 121° at Borrego Springs, CA, their highest temperature on record for July and their second highest temperature ever. Other record highs included: Riverside, CA: 107°, Idyllwild, CA: 95° and Big Bear Lake, CA: 90°. (Ref. Wilson Wx. History) 1997: Arlington, VA a man and woman were struck by lightning in the Pentagon's parking lot; the man was listed in serious condition. (Ref. Lightning - Virginia Weather History) 8 to 10 inches of rain fell across the Spring Creek basin near Fort Collins, CO during the evening hours. The water pooled behind a railroad track bed that acted as a dam, building the water level to a height of 20 feet. When the water began rushing over the top of the track bed, it quickly eroded the earthen embankment, and a wall of water 10 feet to 20 feet high rushed through two trailer parks in the city. 120 mobile homes and 19 houses were destroyed. Damage totaled $200 million dollars. The disaster hit just days before the 21st anniversary of the Big Thompson River flood, which killed 145 people about 20 miles southwest of Fort Collins. (Ref. Wilson Wx. History) In what was described by local residents as the worst flooding in 14 years, severe thunderstorms pounded Needles, CA with damaging winds and torrential rain. Rainfall estimates between 2 and 3 inches in less than one hour inundated and damaged part of a highway and made many local roads impassable. The strong wind gusts destroyed some car ports and downed numerous trees and power lines, further blocking traffic. No injuries were reported. 2000: 16 people were injured when Pam Am flight 165, a Boeing 727 traveling from Orlando, FL to Pittsburgh, PA encountered severe clear air turbulence. (Ref. Wilson Wx. History) 2001: Three young girls wading in knee deep water in the inlet between Rockaway and Atlantic Beach in Queens were swept away and drowned as dangerous rip currents funneled through the inlet. (Ref. Wilson Wx. History) 2004: Heavy rain produced flash flooding across western north Texas and south-central Oklahoma. Up to 8 inches of rain fell across Archer and Knox counties, with nearly 5 inches across Wichita and Clay counties. Runoff caused several rivers to spill their banks, including the South Wichita River, which eventually crested nearly 5 feet above flood stage near Benjamin, the 3rd highest crest on record for that site. Ardmore, OK received nearly 5 inches as well, along with flash flooding at the Chickasaw National Recreation Center. (Ref. Wilson Wx. History) 2011: 122-year rainfall record for July falls, more storms coming Two passing storms overnight dumped enough rain to make this July the wettest one in the city's history. They also knocked out power to tens of thousands of area residents and raised fears of more flooding. The wave of storms, which spurred tornado and flood watches across the area, raised this month's rainfal
-
76 / 71 mostly cloudy - steamy. Cut off trough starting to spin 1- 3 inches of rai n and locally >3 inches through Thursday with the brunt of the heaviest rain falling overnight tonight. Clears out Friday - hoping to not still be stuck in the clouds as these are stubborn to clear out. Otherwise a nice Fri-Sat and mainlly Sunday. Near - below normal 7/28 - 8/3. Overall warmer - hot at times 8/4 - beyond as heights rise and peices of the western heat comes east and ridging into the EC backs in.
-
Almost like August/September 1999, which climaxed with Hurricane Floyd. It put paused to a long running drought. If not for that, knowing what came after, we would have had a near 5-year continuous drought.
-
Yes. The 'remains' of something upstream passing thru this morning NW to SE. Something that hasn't happened in a good while. Decent rain and deep rumbles of thunder over the past two hours. About .2-.25" in the gauge currently. Temp 66.5/66.1.
-
Yep, looks like the exact same areas will get pummeled again or at least the highest chance.
-
Yeah LI will be predominantly some moderate showers. Hit or miss type of stuff. Just like the last event.
-
(002).thumb.png.6e3d9d46bca5fe41aab7a74871dd8af8.png) Hi Don, I made no references at all to NCEI adjustments - the program identified the NCEI adjusted data. I had it review the NCEI adjustment criteria and assess based on those thresholds how the actual vs raw data surrounding changes for either TOB or site moves matched the critiera established by NCEI based on the adjustment papers.
Hi Don, I made no references at all to NCEI adjustments - the program identified the NCEI adjusted data. I had it review the NCEI adjustment criteria and assess based on those thresholds how the actual vs raw data surrounding changes for either TOB or site moves matched the critiera established by NCEI based on the adjustment papers. -
Typical convective nature of these summer events. Some areas that have gotten hit could make a run at 15-18 inches of rain this month
-
30 wind nudged NEward on 1300z OTLK from SPC... includes i95 corridor and DC metro and Baltimore metro
- 1,505 replies
-
- 1
-

-
- severe
- thunderstorms
- (and 7 more)
-
Been wetter than average for July in my backyard but otherwise anything of real interest has missed. Severe weather July 4th missed east and the heavy flooding rain north and west. Zzzzzz and looks to continue that way. Hopefully since we’re still in a long term drought enough survives east of the city to make it to an inch here total but this seems to be another either you’re flooded out or dry. At least the lawns are green and no swarms of pests that come after flooding rains.
-
Will the wet pattern continue? Do we see a return to heat or remain seasonal?
-
2026-2027 Super El Nino
LakePaste25 replied to Stormchaserchuck1's topic in Weather Forecasting and Discussion
If it’s anything like 97-98 there will be a lot of coastal storms that are mostly rain. -
Mike Flannigan @mikeflannigan.bsky.social Follow Graphs showing cumulative area burned and carbon emissions in Ontario. Note in terms of area burned 2021 is the top spot but 2026 is top spot in terms of carbon emissions. Both are correct. The reason for this is that the 2026 fires are more severe - consumed more biomass (greater depth of burn). ALT ALT 7:12 PM · Jul 19, 2026 Everybody can reply
-
 Does anyone know of any sources that extends the cyclone phase diagram/tech outside of just tropical applications? I am well aware of this found Bob Hart's found here, https://moe.met.fsu.edu/cyclonephase/ I recall seeing this method applied to other cyclone types in the past, but I'm not finding those sites. I'm just been sort of frustrated by the models insistent on sub 1000 mb low spin up over NJ, amidst 570+ thickness in all radial directions. That latter circumstance is odd. It is not the typical baroclinic model ( to some degree ) low, which is physically necessary for extratropical cyclones. You know? warm sector, cold sector, cool sector. So I'm just wondering if we're seeing some kind of a quickly evolving hybrid warm core leaning type low pressure here... It may account for the more robust solutions, if some of the thermodynamic/UVM forcing were sharing space. Regarding rainfall... we seem to be peaking PWAT against climo - which is a pretty tall order. What comes along with that is bigger rain relative indicators - synergy of sorts. Basically, it is an increased chances that locations will observe bigger results from surprising smaller reasons to do so. That's what happens in heavier moistened events; suspending a fall column through them, what reaches the ground is closer to source. etc.. So this system is slow-ish moving. A training band even in a weaker total low that (say) proves the NAM/Euro are over sensitive at "boundary of existence" - which I don't see how this thing can be a 995 mb low unless the phase might expose it has shared thermodynamic processes... - could end up being hefty anyway. EDIT: okay I did find this... same site actually. heh. It does seem there's a bit of warmer lean to this thing's profile. interesting https://moe.met.fsu.edu/cyclonephase/ecmwf/fcst/archive/26072800/231.html
 -
I don't have objections to his use of AI to assist with the analysis. But my read is that he essentially guided the AI to reach a desired conclusion concerning NCEI's "cooling". To illustrate how AI can be steered into erroneous conclusions, a climate contrarian and musician on X often engages in extreme misuse of AI (prompt injection and bullying based on the limited set of prompts he has posted e.g., he restricts the AI's to a strictly "first principles" analysis excluding substantial information then follows up asking that other things be excluded) to push multiple AI's into denying anthropogenic climate change. This case does not go to such extreme ends. My point is that one has to be careful when crafting prompts if one aims to reach strong, objective analytical outcomes. One can even ask AI to assess and revise the prompt before utilizing it. In my view, a better approach would have involved sharing the raw data for the stations, making no references to NCEI's adjustments in the prompt(s), sharing station move/TOBS information, other relevant information. etc. and then asking whether one could rely on the raw data, alone, over time to construct a representative or reliable long-term climate record. One could also ask the AI to provide an explanation/analysis and generate a reproducible methods section (assuming sufficient information is available). Afterward, if the output suggested that the raw data, alone, created a flawed climate record, one could upload the various papers describing NCEI's adjustments, and ask the AI to assess those adjustments, their impact on addressing the flaws in the climate record, etc.
-
Can actually say we don’t really need that much today. First time in a long while for that statement. Picked a good time to be in Cancun this week. Fingers crossed for no flooding and damage to all.
- Today
-
i would like big totals plz
-
The 0z CSU guidance has a large area of 30% now as well. So that has upticked. Though the usefulness of the AI guidance is probably less on the day of.
- 1,505 replies
-
- 1
-
-
- severe
- thunderstorms
- (and 7 more)
-
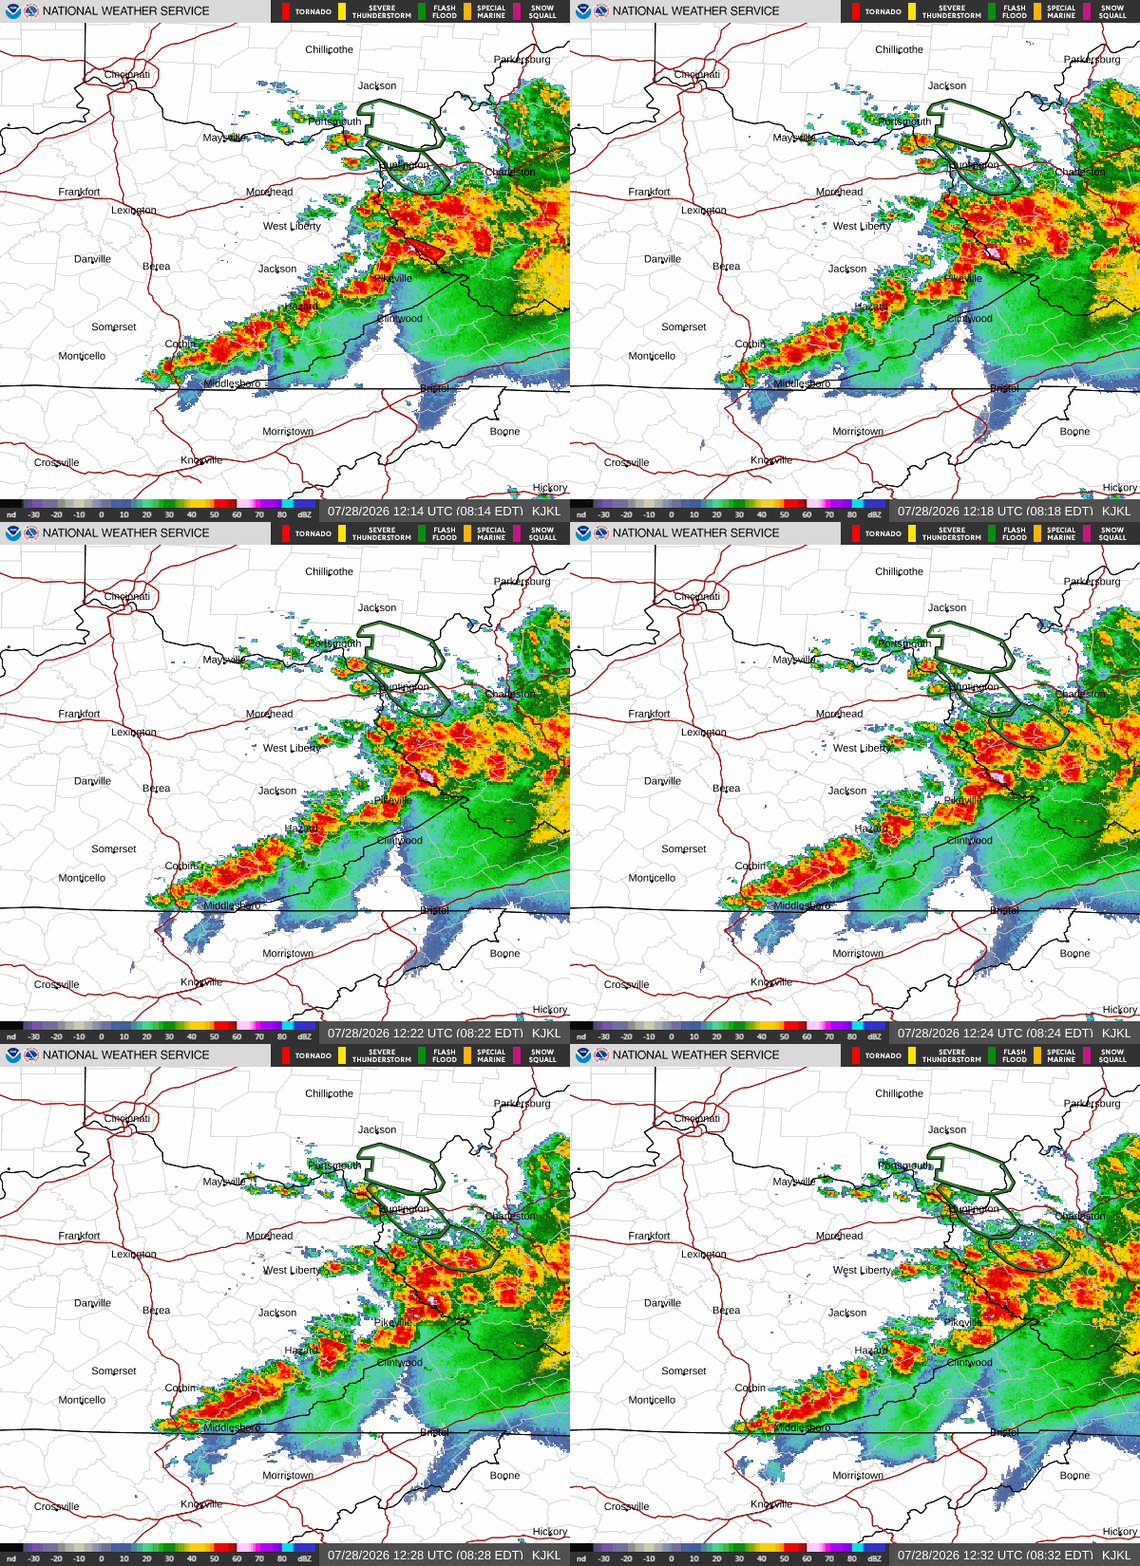
This could get interesting later on. Sent from my SM-G998U using Tapatalk
-
Hoping for a miss here as well, close to 10" here for July at this point.
-
NWS Raleigh mentions the possibility of it being a reduced threat to the west. I plan on chasing today if necessary from Raleigh northeastward.
-
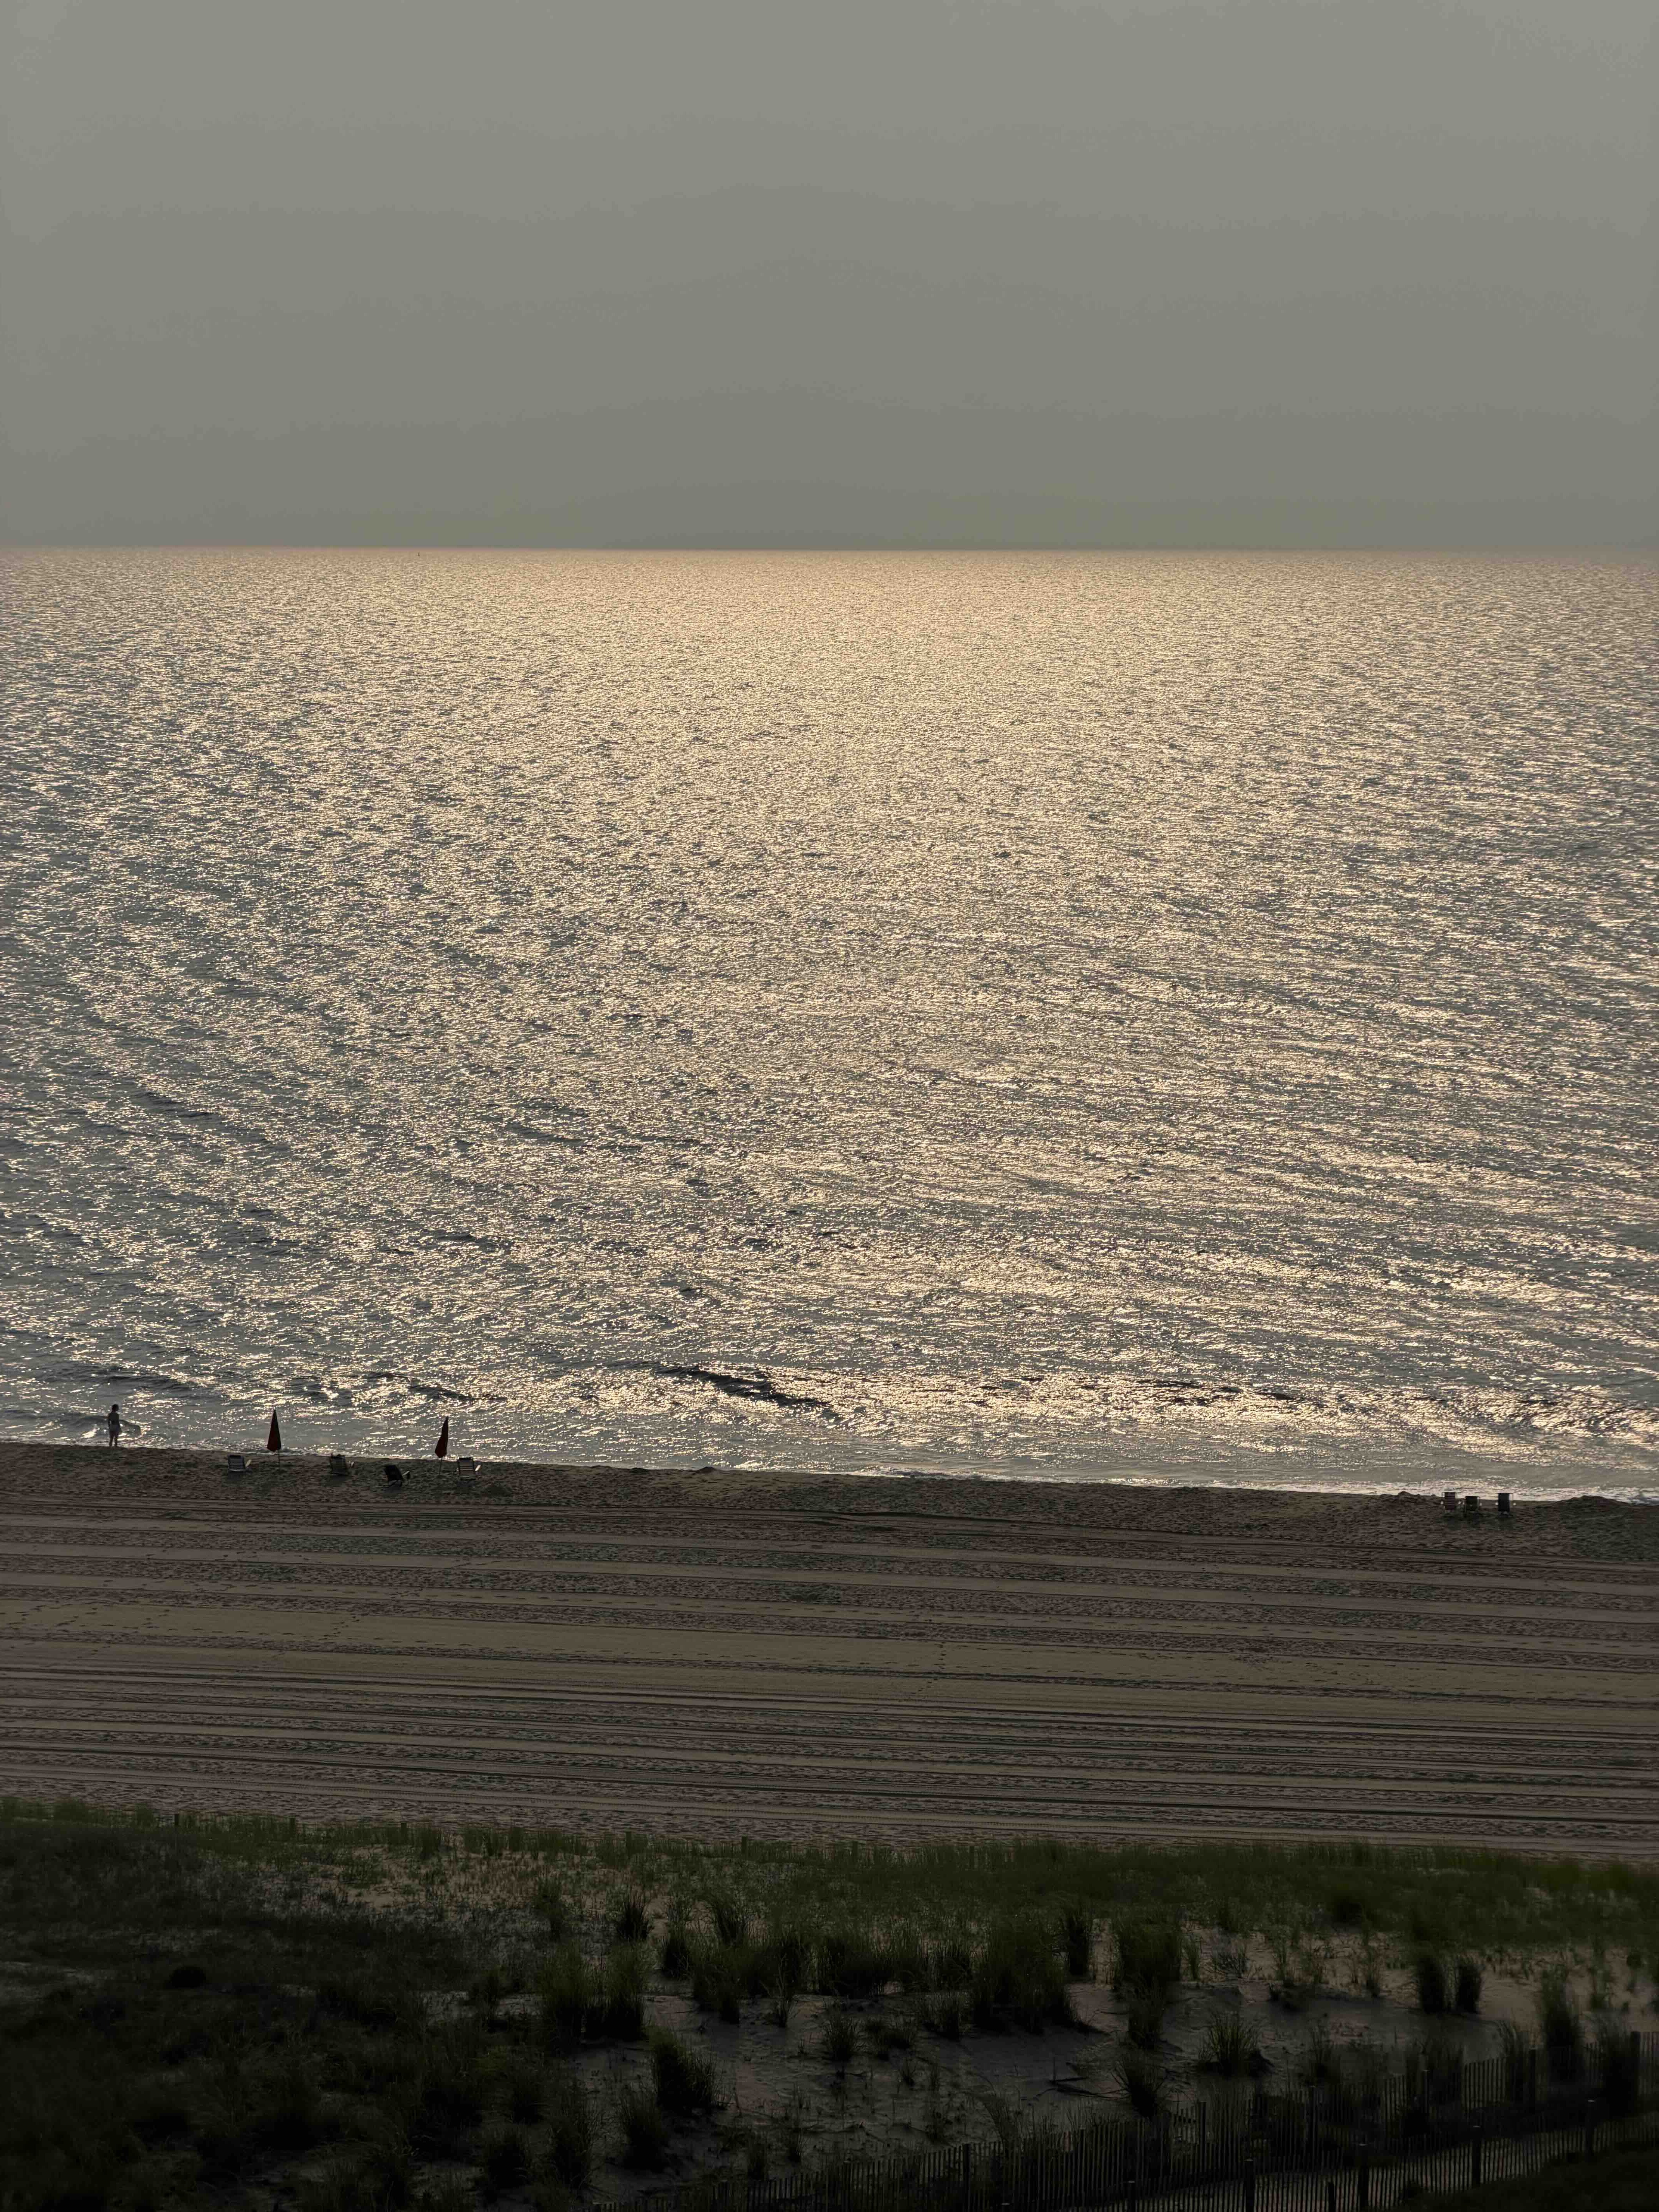
Nice morning in OC
-
Lots of cloud cover with it, though. I know @high risk indicated we may not need ABUNDANT sunshine - but I can't help feeling like we've seen this movie a million times.
- 1,505 replies
-
- 1
-

-
- severe
- thunderstorms
- (and 7 more)