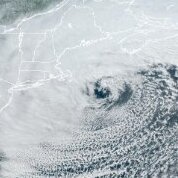
weatherwiz Posted October 30, 2025 Share Posted October 30, 2025 Odd question but I've been doing a lot of reading around o this but I can't seem to garner the appropriate solution. In a nutshell, I am writing a paper about a severe weather event and in this event there was a multi-region outbreak (from two separate systems). I've crafted several drafts of the paper because I'm trying to find the best method of doing the layout. This paper is an analysis (case study) so it will have 300mb charts, 500mb, 700, 850, etc. Anyways, I feel the best course of measure is to break the paper into two main sections, with one focusing on each region. Anyways with that, I would be referencing alot of the same maps twice. For example, Let's say that is labeled Figure 5 in my paper Where I am stuck is this: 1. When talking about this for the first region its labeled as Figure 5 2. When I reference this chart again in the second section, is in best to label it as another figure number, or is it fine to reference back to figure 5. I am going nuts on this. Note: All images will be at the end of the paper. Link to comment Share on other sites More sharing options...
dendrite Posted October 30, 2025 Share Posted October 30, 2025 If it’s the same image then yeah, I’d just refer back to the same one. 1 Link to comment Share on other sites More sharing options...
weatherwiz Posted October 30, 2025 Share Posted October 30, 2025 5 minutes ago, dendrite said: If it’s the same image then yeah, I’d just refer back to the same one. Perfect, thank you! That's what I was thinking. Not sure why I've been beating myself up about this but I've let it stress me out so much that sometimes I'd come close to getting a panic attack and would get light headed Link to comment Share on other sites More sharing options...
dendrite Posted October 30, 2025 Share Posted October 30, 2025 7 minutes ago, weatherwiz said: Perfect, thank you! That's what I was thinking. Not sure why I've been beating myself up about this but I've let it stress me out so much that sometimes I'd come close to getting a panic attack and would get light headed Case studies can tend to have a lot of images to refer to anyway. It doesn’t make sense to me to add the same image twice as different figures. I assume your choice for this study is the point of having two outbreaks at the same time. So it only makes sense to tie each in with the same maps. Otherwise it would feel like 2 different case studies in 1 paper. Link to comment Share on other sites More sharing options...
weatherwiz Posted October 30, 2025 Share Posted October 30, 2025 8 minutes ago, dendrite said: Case studies can tend to have a lot of images to refer to anyway. It doesn’t make sense to me to add the same image twice as different figures. I assume your choice for this study is the point of having two outbreaks at the same time. So it only makes sense to tie each in with the same maps. Otherwise it would feel like 2 different case studies in 1 paper. Yeah, one outbreak occurred from northeast CO into SW NE and a second from IA southwest into OH (but each were spawned from a separate system). Each person was assigned a different event so I don't know if everyone got a multi-region event or hell, if I even need to focus on both areas but I'm going to anyways. I had initially did my layouts talking about each level and then both regions...but I felt it was leading to a cumbersome mess. So I elected to try going about it doing the analysis separate for each area and it seems to be going much more fluidly. Link to comment Share on other sites More sharing options...
tunafish Posted November 1, 2025 Share Posted November 1, 2025 On 10/29/2025 at 4:24 PM, AstronomyEnjoyer said: It's been a while since my last barn update. Still have some trim work to finish up, and the doors have to be made (planning on a naturally stained wood in a chevron pattern), but the painters should be arriving sometime next week. Electrical will be the last problem to tackle, but I think that'll have to wait for spring. Looks awesome, man. Love that the windows on the cupola open. 1 Link to comment Share on other sites More sharing options...
AstronomyEnjoyer Posted November 1, 2025 Share Posted November 1, 2025 8 hours ago, tunafish said: Looks awesome, man. Love that the windows on the cupola open. Thanks! Yeah, I originally intended to have them fixed in place, but then I realized I could avoid adding gable vents by just having the the cupola windows open instead. I'm on the lookout for an antique bell to hang in there. My plan is to rig something up to get it to ring on the hour. 1 Link to comment Share on other sites More sharing options...
weatherwiz Posted November 1, 2025 Share Posted November 1, 2025 After a very long year and a half and just seeing if a full recovery would happen, the recommendation was finally made to go the route of a doggy wheel chair. Ordered last month and got it yesterday! 3 2 Link to comment Share on other sites More sharing options...
DavisStraight Posted November 1, 2025 Share Posted November 1, 2025 2 hours ago, weatherwiz said: After a very long year and a half and just seeing if a full recovery would happen, the recommendation was finally made to go the route of a doggy wheel chair. Ordered last month and got it yesterday! Dogs adapt, looks good Paulie. 1 Link to comment Share on other sites More sharing options...
weatherwiz Posted November 1, 2025 Share Posted November 1, 2025 28 minutes ago, DavisStraight said: Dogs adapt, looks good Paulie. Yes, he adapted quickly. We took the drive to Shelburne Falls yesterday to pick it up and brought him along so they could make any adjustments needed. As soon as he was hooked up to it...he was going wild getting around. When we took him outside today, as soon as he saw it he almost like went right up to it and then turned himself around as if he knew what was going on. This is going to be great for him. Hopefully too this will help maybe build up some strengthen in his back legs, though not really sure that will do much at this point. We did a 3rd MRI a couple months back since he kind of regressed over the summer. It revealed the portion of his spine where the stroke occurred is slowly being replaced by fluid (which is preventing the neurons from his brain traveling to his lower extremities). So we took him off prednisone (which he had been on since the winter when we think he had a minor stroke) as it was not working as well anymore. 4 Link to comment Share on other sites More sharing options...
Baroclinic Zone Posted November 4, 2025 Share Posted November 4, 2025 Plane crash at Louisville international airport. Live feed is nuts. 2 Link to comment Share on other sites More sharing options...
Baroclinic Zone Posted November 4, 2025 Share Posted November 4, 2025 Oh man. Looks like it was a UPS flight. https://www.wdrb.com/news/plane-crash-reported-near-louisvilles-airport-as-huge-plume-of-smoke-rises/article_9fe53459-c8a1-441a-b576-7954f1bfedcd.html https://www.wlky.com/article/plane-crash-explosion-louisville-airport/69255042 Link to comment Share on other sites More sharing options...
tamarack Posted November 5, 2025 Share Posted November 5, 2025 Pictures indicate that one engine tore out its innards and fell off the wing before the actual crash. Link to comment Share on other sites More sharing options...
amarshall Posted November 6, 2025 Share Posted November 6, 2025 Oaks here targeting a full leaf drop around mid January. 1 1 1 Link to comment Share on other sites More sharing options...
SJonesWX Posted November 6, 2025 Share Posted November 6, 2025 42 minutes ago, amarshall said: Oaks here targeting a full leaf drop around mid January . that's unreal, no hints of green up here at all. Enjoy the Christmas day leaf clean up. Link to comment Share on other sites More sharing options...
amarshall Posted November 6, 2025 Share Posted November 6, 2025 that's unreal, no hints of green up here at all. Enjoy the Christmas day leaf clean up.Many times it’s been done with snow in the morning and wet leaves in the afternoon. Early winters of yore . Link to comment Share on other sites More sharing options...
rclab Posted November 6, 2025 Share Posted November 6, 2025 49 minutes ago, amarshall said: Oaks here targeting a full leaf drop around mid January Here in the upper M A coastal plain, I wondering if they’ll ever drop at all. As always …. (photo taken 10/29) . Link to comment Share on other sites More sharing options...
CoastalWx Posted November 6, 2025 Share Posted November 6, 2025 1 hour ago, amarshall said: Oaks here targeting a full leaf drop around mid January . You've had frosts too right? Link to comment Share on other sites More sharing options...
WxWatcher007 Posted November 6, 2025 Share Posted November 6, 2025 1 hour ago, amarshall said: Oaks here targeting a full leaf drop around mid January . That is truly horrifying. 1 Link to comment Share on other sites More sharing options...
amarshall Posted November 6, 2025 Share Posted November 6, 2025 31 minutes ago, CoastalWx said: You've had frosts too right? yep many Link to comment Share on other sites More sharing options...
CoastalWx Posted November 6, 2025 Share Posted November 6, 2025 38 minutes ago, amarshall said: yep many South shore oaks laugh at sub 32 temps. Link to comment Share on other sites More sharing options...
Angus Posted November 6, 2025 Share Posted November 6, 2025 My parents live in Norwell, I live in Concord (MA) - was visiting there last week. Crazy difference. 1 Link to comment Share on other sites More sharing options...
TauntonBlizzard2013 Posted November 7, 2025 Share Posted November 7, 2025 Just a shameless plug, may need it, if anyones hiring or knows somewhere that is, I’d take the lead. BS Criminal Justice. Trying to prepare myself, reading the tea leaves Link to comment Share on other sites More sharing options...
CoastalWx Posted November 7, 2025 Share Posted November 7, 2025 12 hours ago, Angus said: My parents live in Norwell, I live in Concord (MA) - was visiting there last week. Crazy difference. Depends on the species. My folks live in the NW side of Marshfield and were bare last week. Link to comment Share on other sites More sharing options...
Damage In Tolland Posted November 7, 2025 Share Posted November 7, 2025 19 hours ago, rclab said: 19 hours ago, amarshall said: Oaks here targeting a full leaf drop around mid January . Good Lord is that triggering . Still mainly green leaves . I’d list my house as quickly as possible . 4 Link to comment Share on other sites More sharing options...
amarshall Posted November 7, 2025 Share Posted November 7, 2025 15 hours ago, Angus said: My parents live in Norwell, I live in Concord (MA) - was visiting there last week. Crazy difference. Certain neighborhoods in Norwell are all pines. Others all maples that drop in September. Link to comment Share on other sites More sharing options...
CoastalWx Posted November 7, 2025 Share Posted November 7, 2025 29 minutes ago, Damage In Tolland said: Good Lord is that triggering . Still mainly green leaves . I’d list my house as quickly as possible . Lot of the green is lines if you look closely. That’s destructionbury. 1 Link to comment Share on other sites More sharing options...
Damage In Tolland Posted November 7, 2025 Share Posted November 7, 2025 11 minutes ago, CoastalWx said: Lot of the green is lines if you look closely. That’s destructionbury. Lines? Still a few strangers but just about done. All lawn equipment will be done probably by the 20th https://imgur.com/a/YHpDZ2z Link to comment Share on other sites More sharing options...
CoastalWx Posted November 7, 2025 Share Posted November 7, 2025 1 hour ago, Damage In Tolland said: Lines? Still a few strangers but just about done. All lawn equipment will be done probably by the 20th https://imgur.com/a/YHpDZ2z Oops pines lol. Link to comment Share on other sites More sharing options...
backedgeapproaching Posted November 7, 2025 Share Posted November 7, 2025 3 hours ago, Damage In Tolland said: Lines? Still a few strangers but just about done. All lawn equipment will be done probably by the 20th https://imgur.com/a/YHpDZ2z I have more left on my Oaks here than you do. I was in Saratoga a few days ago and Oaks were 80% full still(all brown, no green). Im guessing your hilltop microclimate matters in some way. I have been in below 32 many many times. Link to comment Share on other sites More sharing options...

Recommended Posts
Create an account or sign in to comment
You need to be a member in order to leave a comment
Create an account
Sign up for a new account in our community. It's easy!
Register a new accountSign in
Already have an account? Sign in here.
Sign In Now