All Activity
- Past hour
-
Augdewst 2026: Summer's Last Stand
Ginx snewx replied to Prismshine Productions's topic in New England
Beautiful sea breeze but cloudy. Pool feels fantastic -

Augdewst 2026: Summer's Last Stand
dendrite replied to Prismshine Productions's topic in New England
Some weenie in NY ridin’ along in his automobile trolling mPing with 5” hail obs, blowing dust, and overflowing rivers. Hate to see it.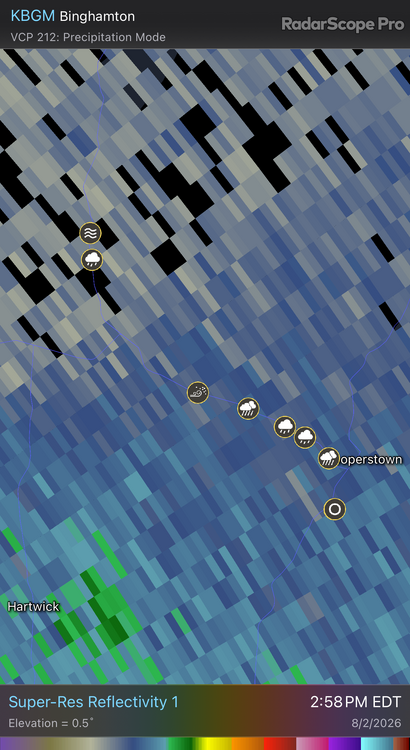
-

Central PA Summer 2026 Discussion/Obs Thread
canderson replied to Voyager's topic in Upstate New York/Pennsylvania
Thunder! -
Every week is a Flood Watch, its the new wind thingy. Flood Watch National Weather Service Mount Holly NJ 220 PM EDT Sun Aug 2 2026 DEZ001-NJZ001-007>010-012>019-PAZ060>062-070-071-101>106-030900- /O.NEW.KPHI.FA.A.0007.260803T0000Z-260804T0300Z/ /00000.0.ER.000000T0000Z.000000T0000Z.000000T0000Z.OO/ New Castle-Sussex-Warren-Morris-Hunterdon-Somerset-Middlesex- Western Monmouth-Eastern Monmouth-Mercer-Salem-Gloucester-Camden- Northwestern Burlington-Berks-Lehigh-Northampton-Delaware- Philadelphia-Western Chester-Eastern Chester-Western Montgomery- Eastern Montgomery-Upper Bucks-Lower Bucks- Including the cities of Camden, Honey Brook, Freehold, Wilmington, New Brunswick, Collegeville, Morrisville, Easton, Chalfont, Perkasie, Washington, Philadelphia, Pennsville, Lansdale, Trenton, Media, Kennett Square, Pottstown, Norristown, Flemington, Cherry Hill, West Chester, Glassboro, Allentown, Morristown, Sandy Hook, Doylestown, Newton, Moorestown, Bethlehem, Oxford, Somerville, Reading, and Mount Holly 220 PM EDT Sun Aug 2 2026 ...FLOOD WATCH IN EFFECT FROM 8 PM EDT THIS EVENING THROUGH MONDAY EVENING... * WHAT...Flooding caused by excessive rainfall is possible. * WHERE...Portions of northern Delaware, including the following area, New Castle, New Jersey, including the following areas, Camden, Eastern Monmouth, Gloucester, Hunterdon, Mercer, Middlesex, Morris, Northwestern Burlington, Salem, Somerset, Sussex, Warren and Western Monmouth, and Pennsylvania, including the following areas, Berks, Delaware, Eastern Chester, Eastern Montgomery, Lehigh, Lower Bucks, Northampton, Philadelphia, Upper Bucks, Western Chester and Western Montgomery. * WHEN...From 8 PM EDT this evening through Monday evening. * IMPACTS...Excessive runoff may result in flooding of rivers, creeks, streams, and other low-lying and flood-prone locations. Creeks and streams may rise out of their banks. Flooding may occur in poor drainage and urban areas. * ADDITIONAL DETAILS... - Multiple rounds of showers and thunderstorms are expected across the area tonight through Monday. Rainfall rates of 1 to 3 inches per hour possible. Rainfall amounts of 1 to 2 inches are possible with localized amounts to 3 to 5 inches which could cause flash flooding. - http://www.weather.gov/safety/flood PRECAUTIONARY/PREPAREDNESS ACTIONS... You should monitor later forecasts and be alert for possible Flood Warnings. Those living in areas prone to flooding should be prepared to take action should flooding develop. && $$ Guzzo
-

Augdewst 2026: Summer's Last Stand
Damage In Tolland replied to Prismshine Productions's topic in New England
I am saying don’t see widespread big rain amounts / flooding etc . This isn’t that type of setup -
DC streets quickly turn to rivers with this type of rain. Happened on Tuesday as well.
-
Yeah I was driving through it on 16th street. That was a mess. Tons of standing and flowing water on the road.
-
And you’ll sit in endless traffic on a Sunday. Stay home
-
torrential rains there for a bit in upper NW - seems like more stuff developing from the south.
-
Augdewst 2026: Summer's Last Stand
dendrite replied to Prismshine Productions's topic in New England
1.5” is a seasonal total here -
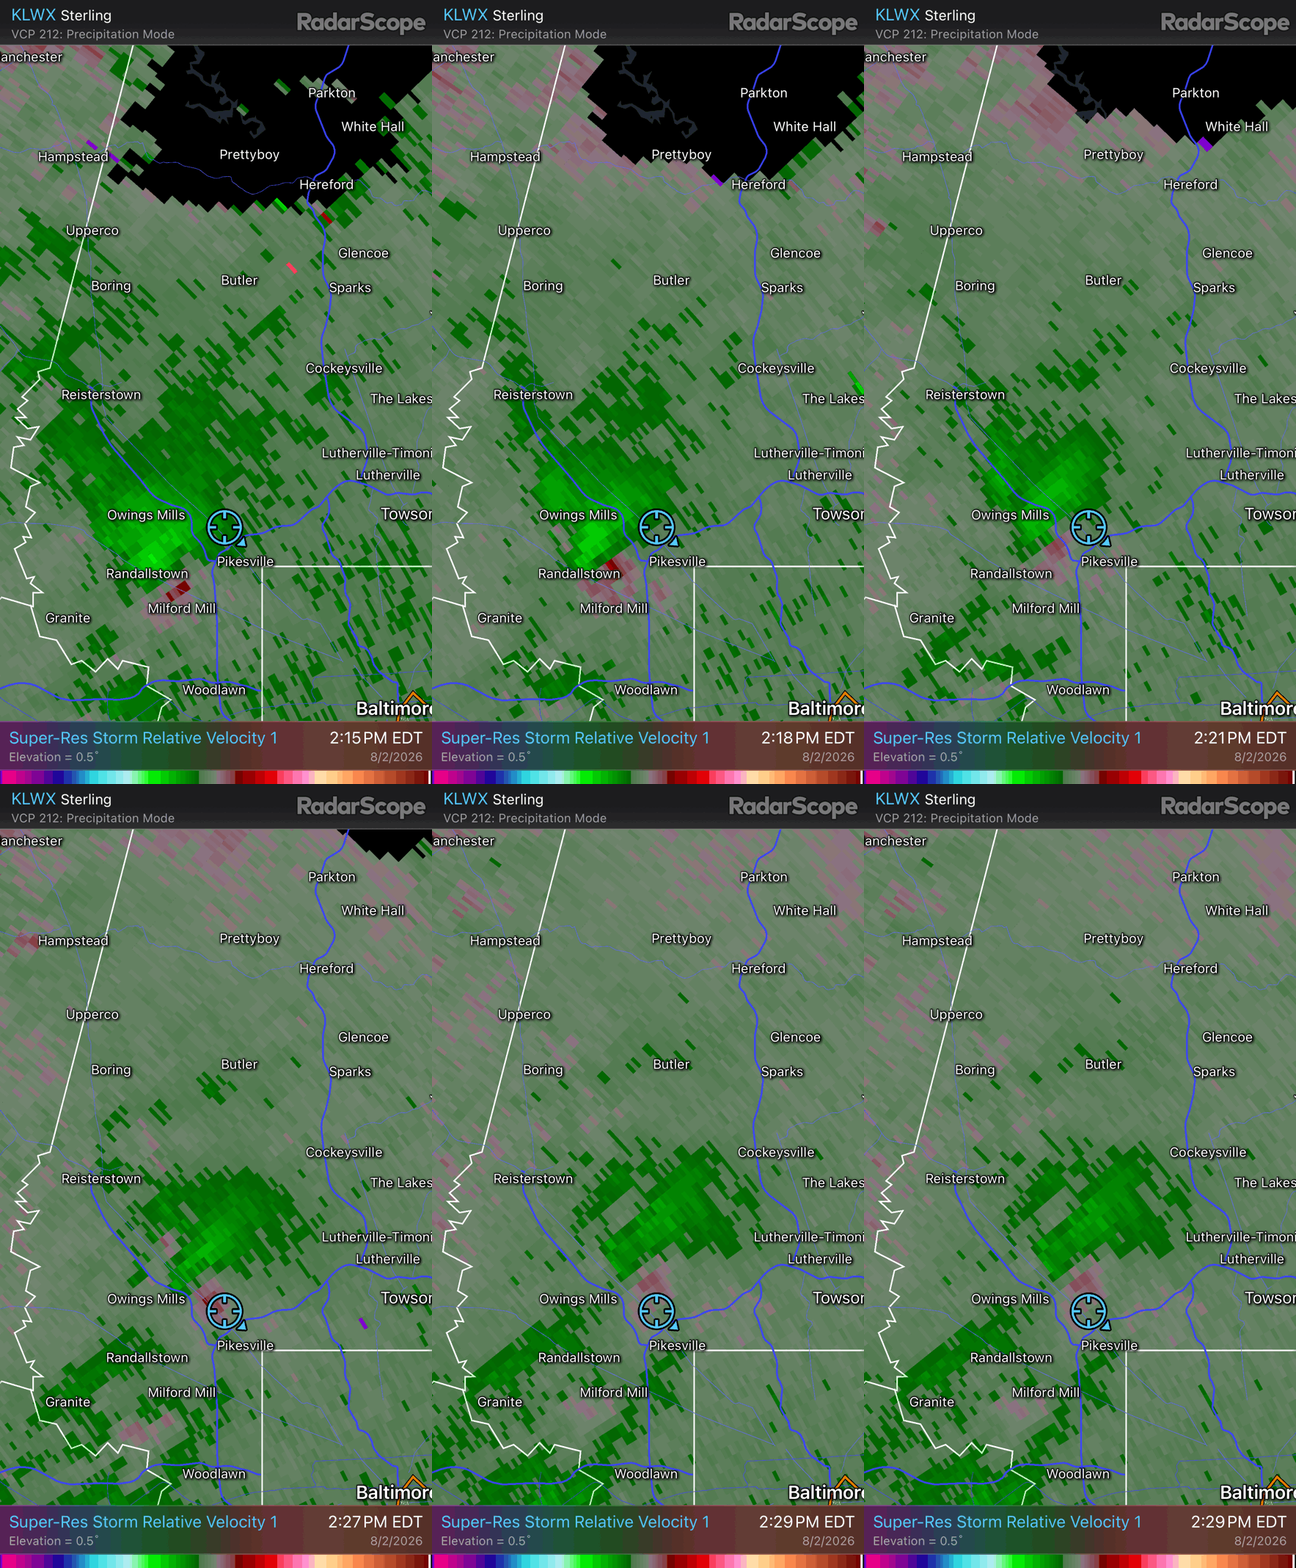
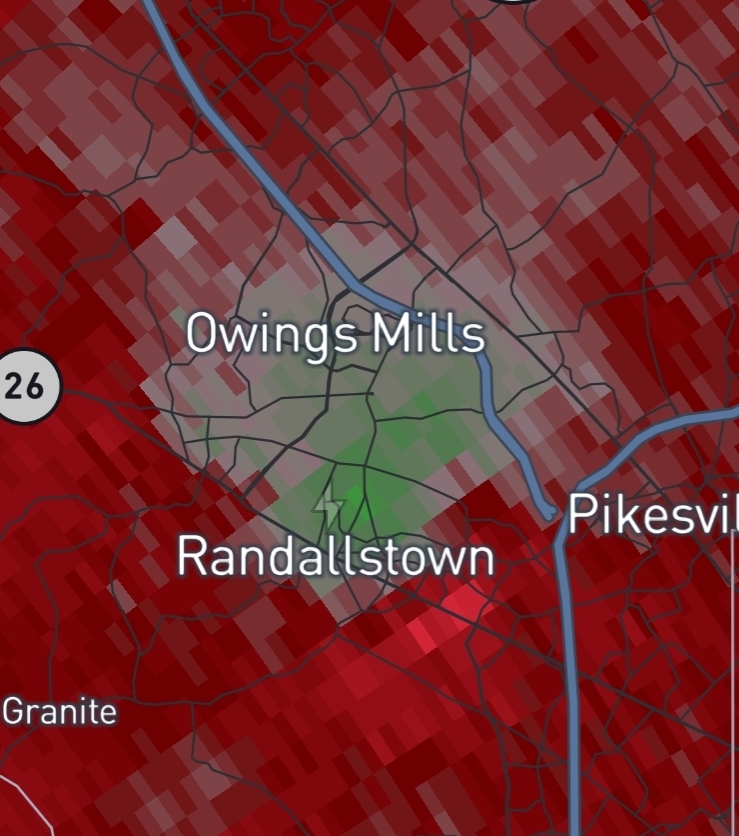
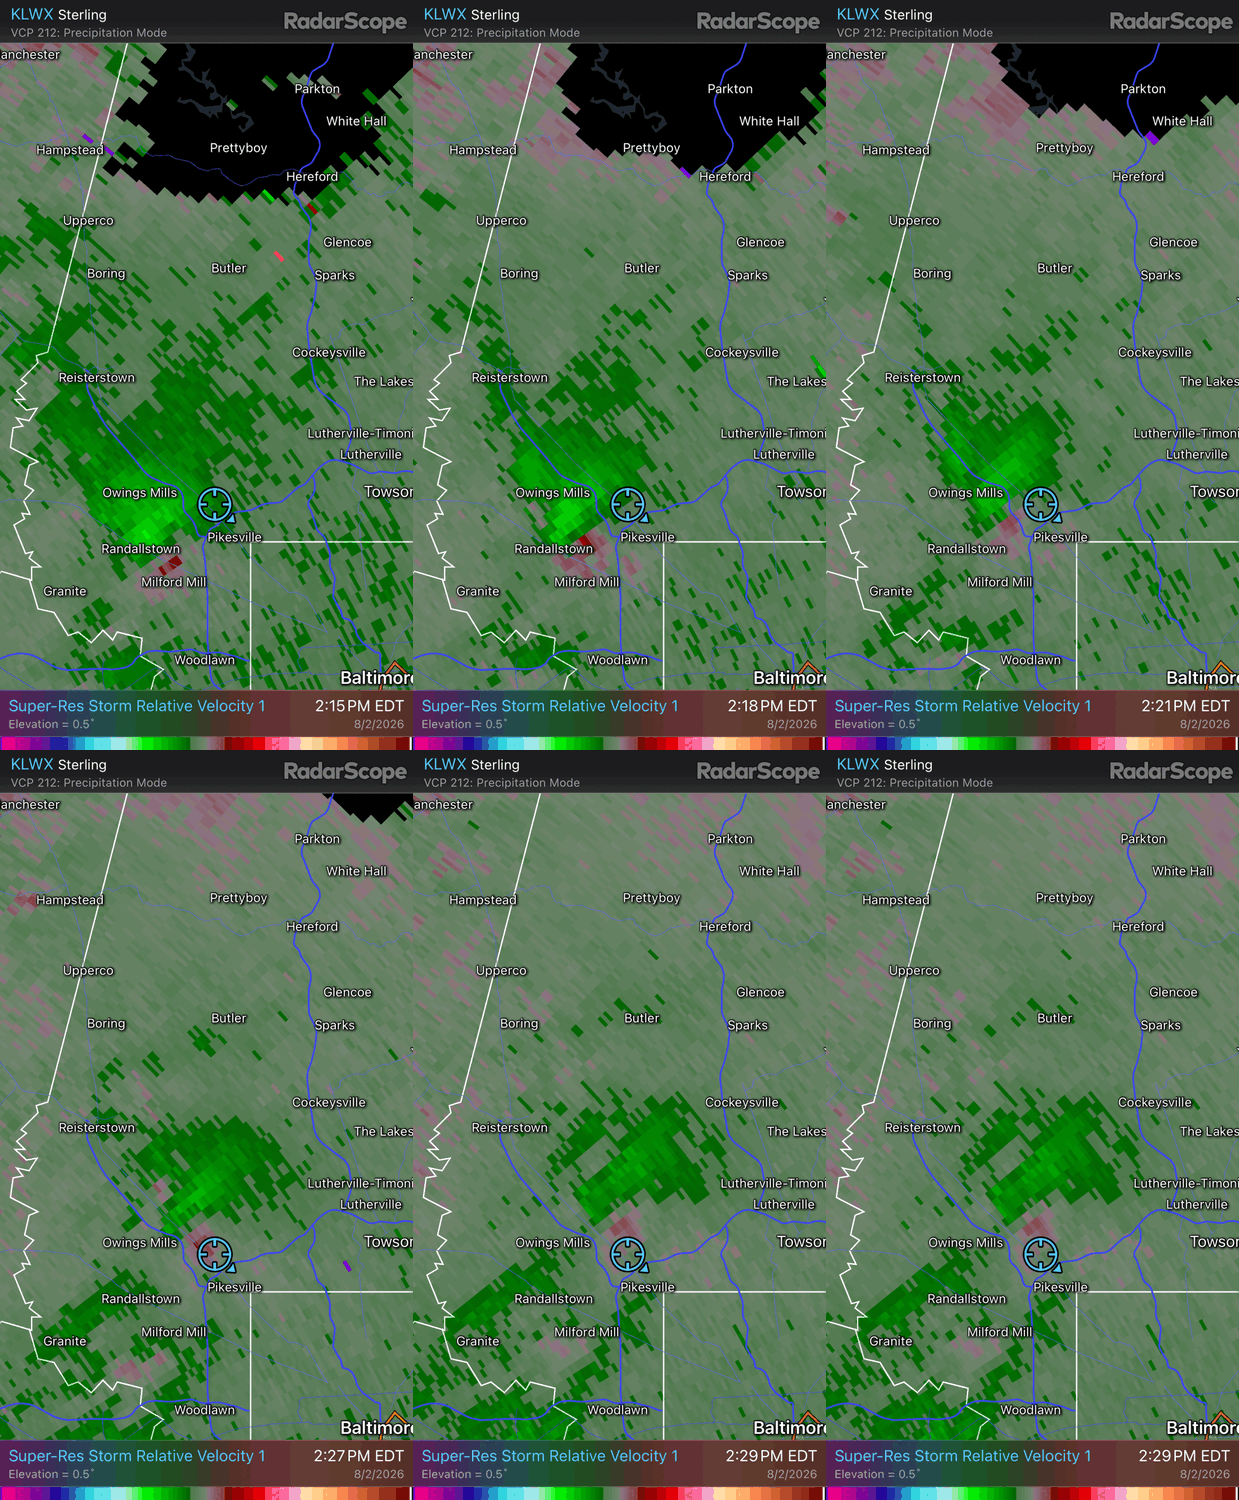
It got a little windy and some heavy rain but I wasn't really able to see anything in the way of rotation here in Pikesville / Garrison
- 1,704 replies
-
- 1
-

-
- severe
- thunderstorms
- (and 7 more)
-
Line of storms in MD/DE will be area to watch heading ENE
-
89 here a another degree and some places in Jersey will have a little mini heatwave Fri-Sat-Sun. i was 89 Friday - 90 Sat
-
Time for some street kayaking.
-
Flood Watch (NOT in NYC yet) FFA from KPHI
-
Congrats. You got the brunt of the heaviest slug (very high-tech weather terms there). We got the fringe here ivo Vienna - .21" so far.
-
 sildenafil 50 mg price and Viagra generic over the counter Generic Viagra online https://maps.google.com.gt/url?sa=t&url=https://medmennews.com buy Viagra online and http://www.sportchap.ru/user/sfqgqahbod/ Viagra generic over the counter [url=https://www.google.mv/url?q=https://medmennews.com]Sildenafil 100mg price[/url] cheap viagra and [url=https://www.liveviolet.net/user/mwfrhbgiuu/videos]Cheap generic Viagra online[/url] Cheap generic Viagra online
 -
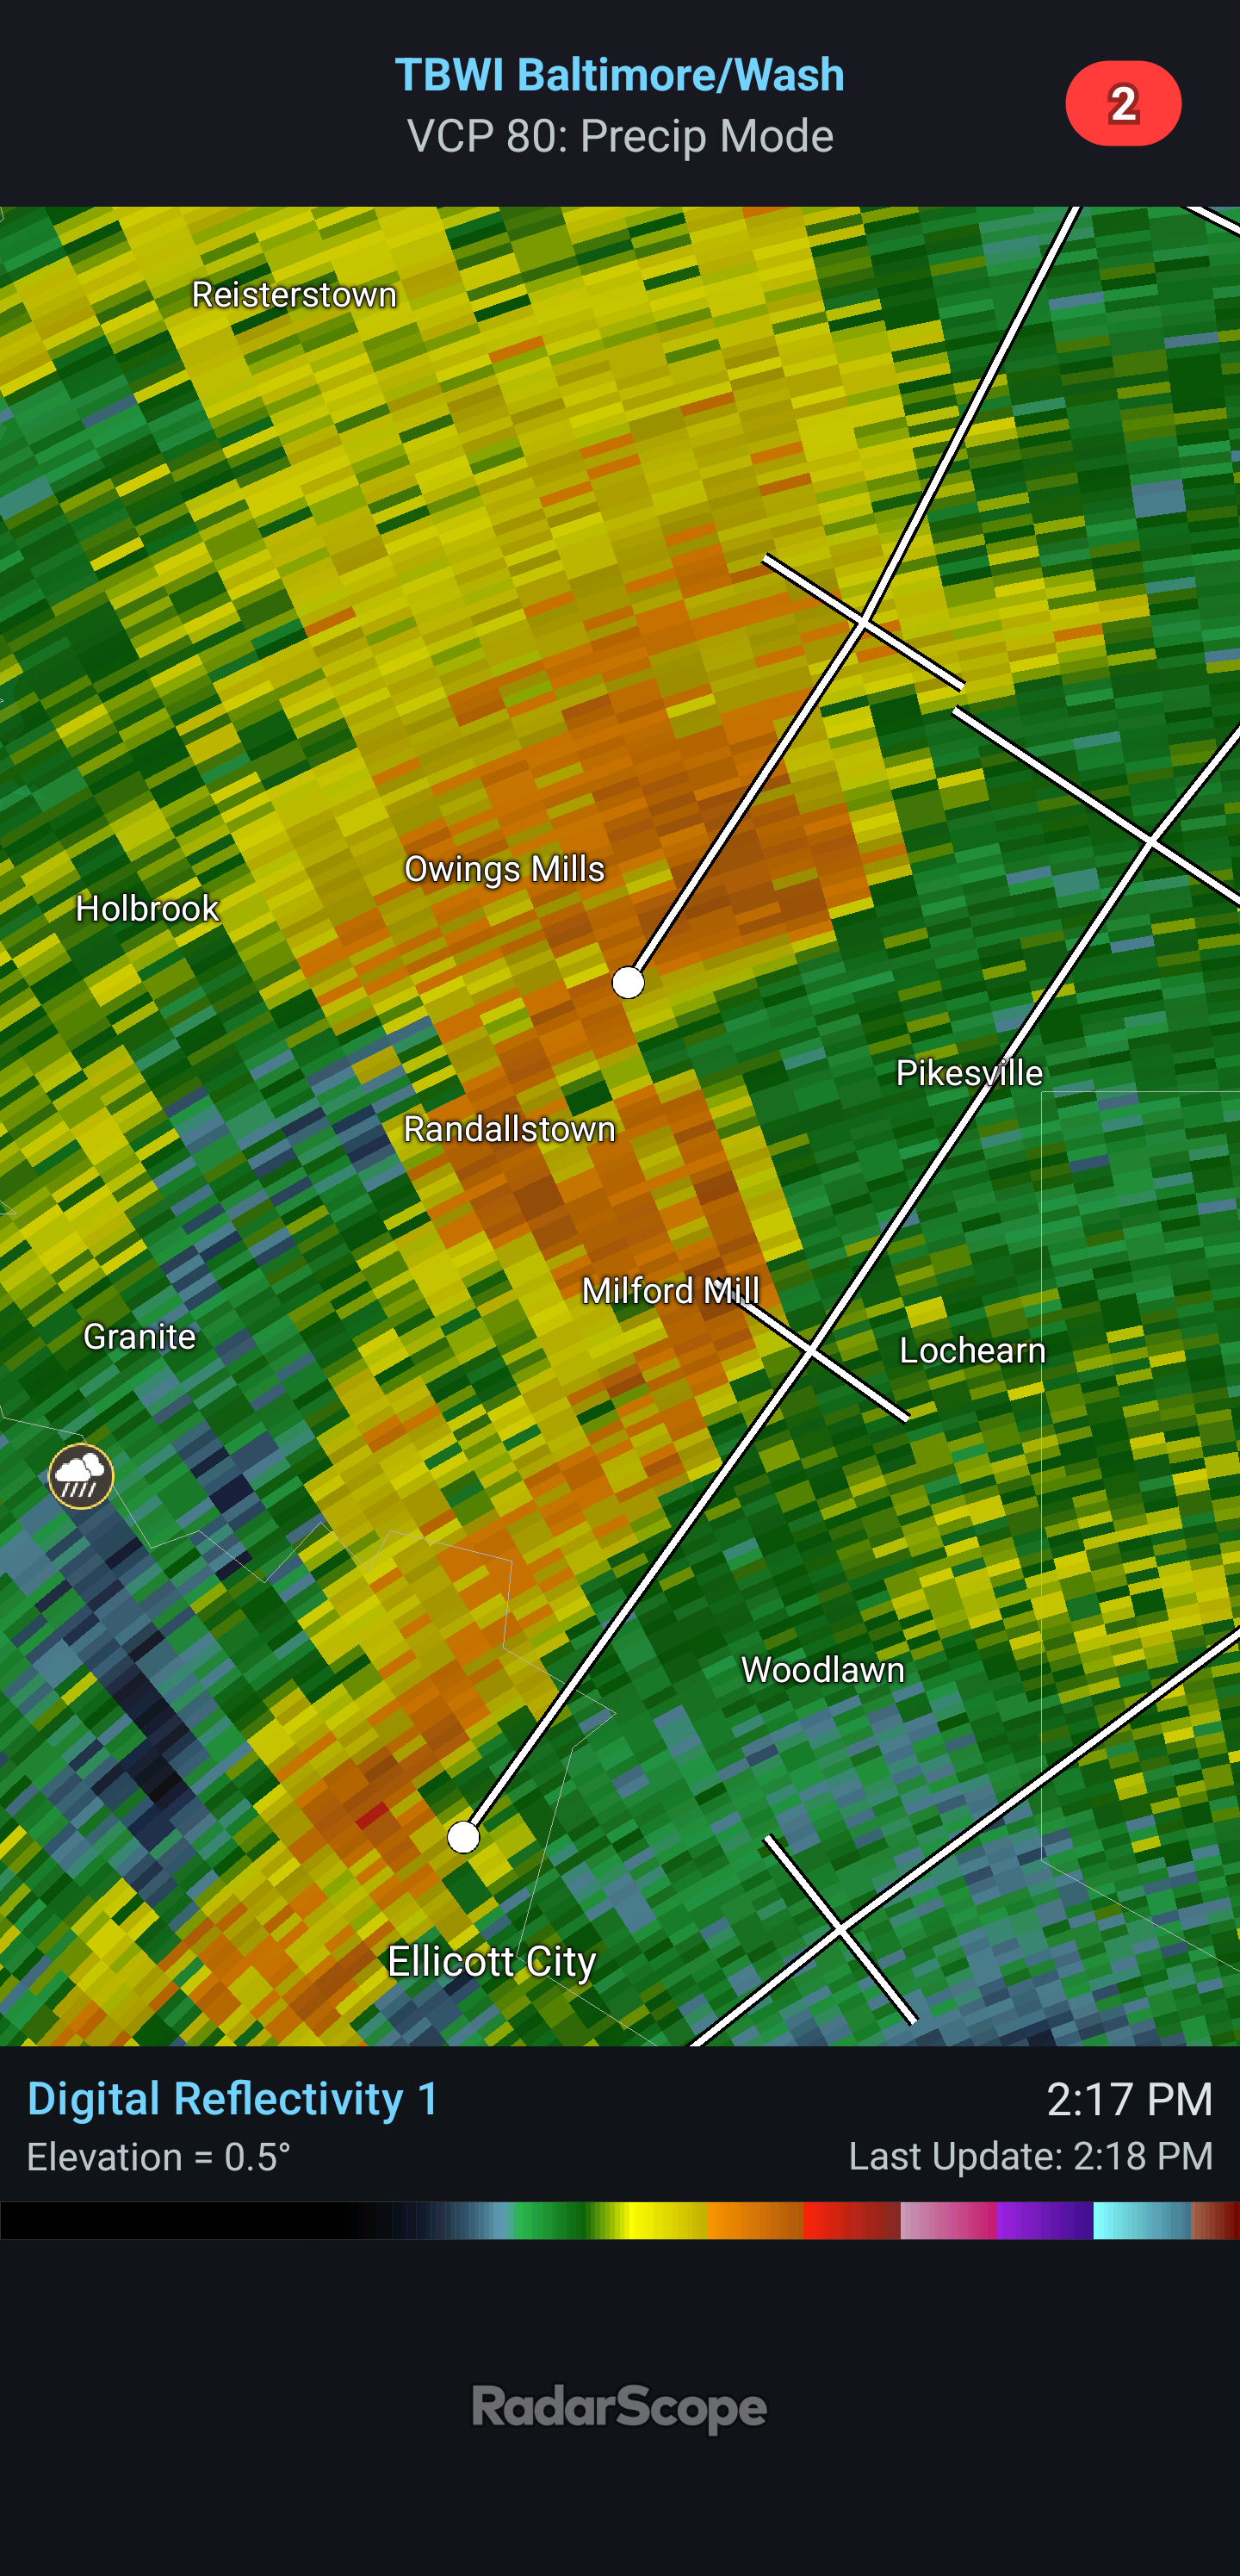
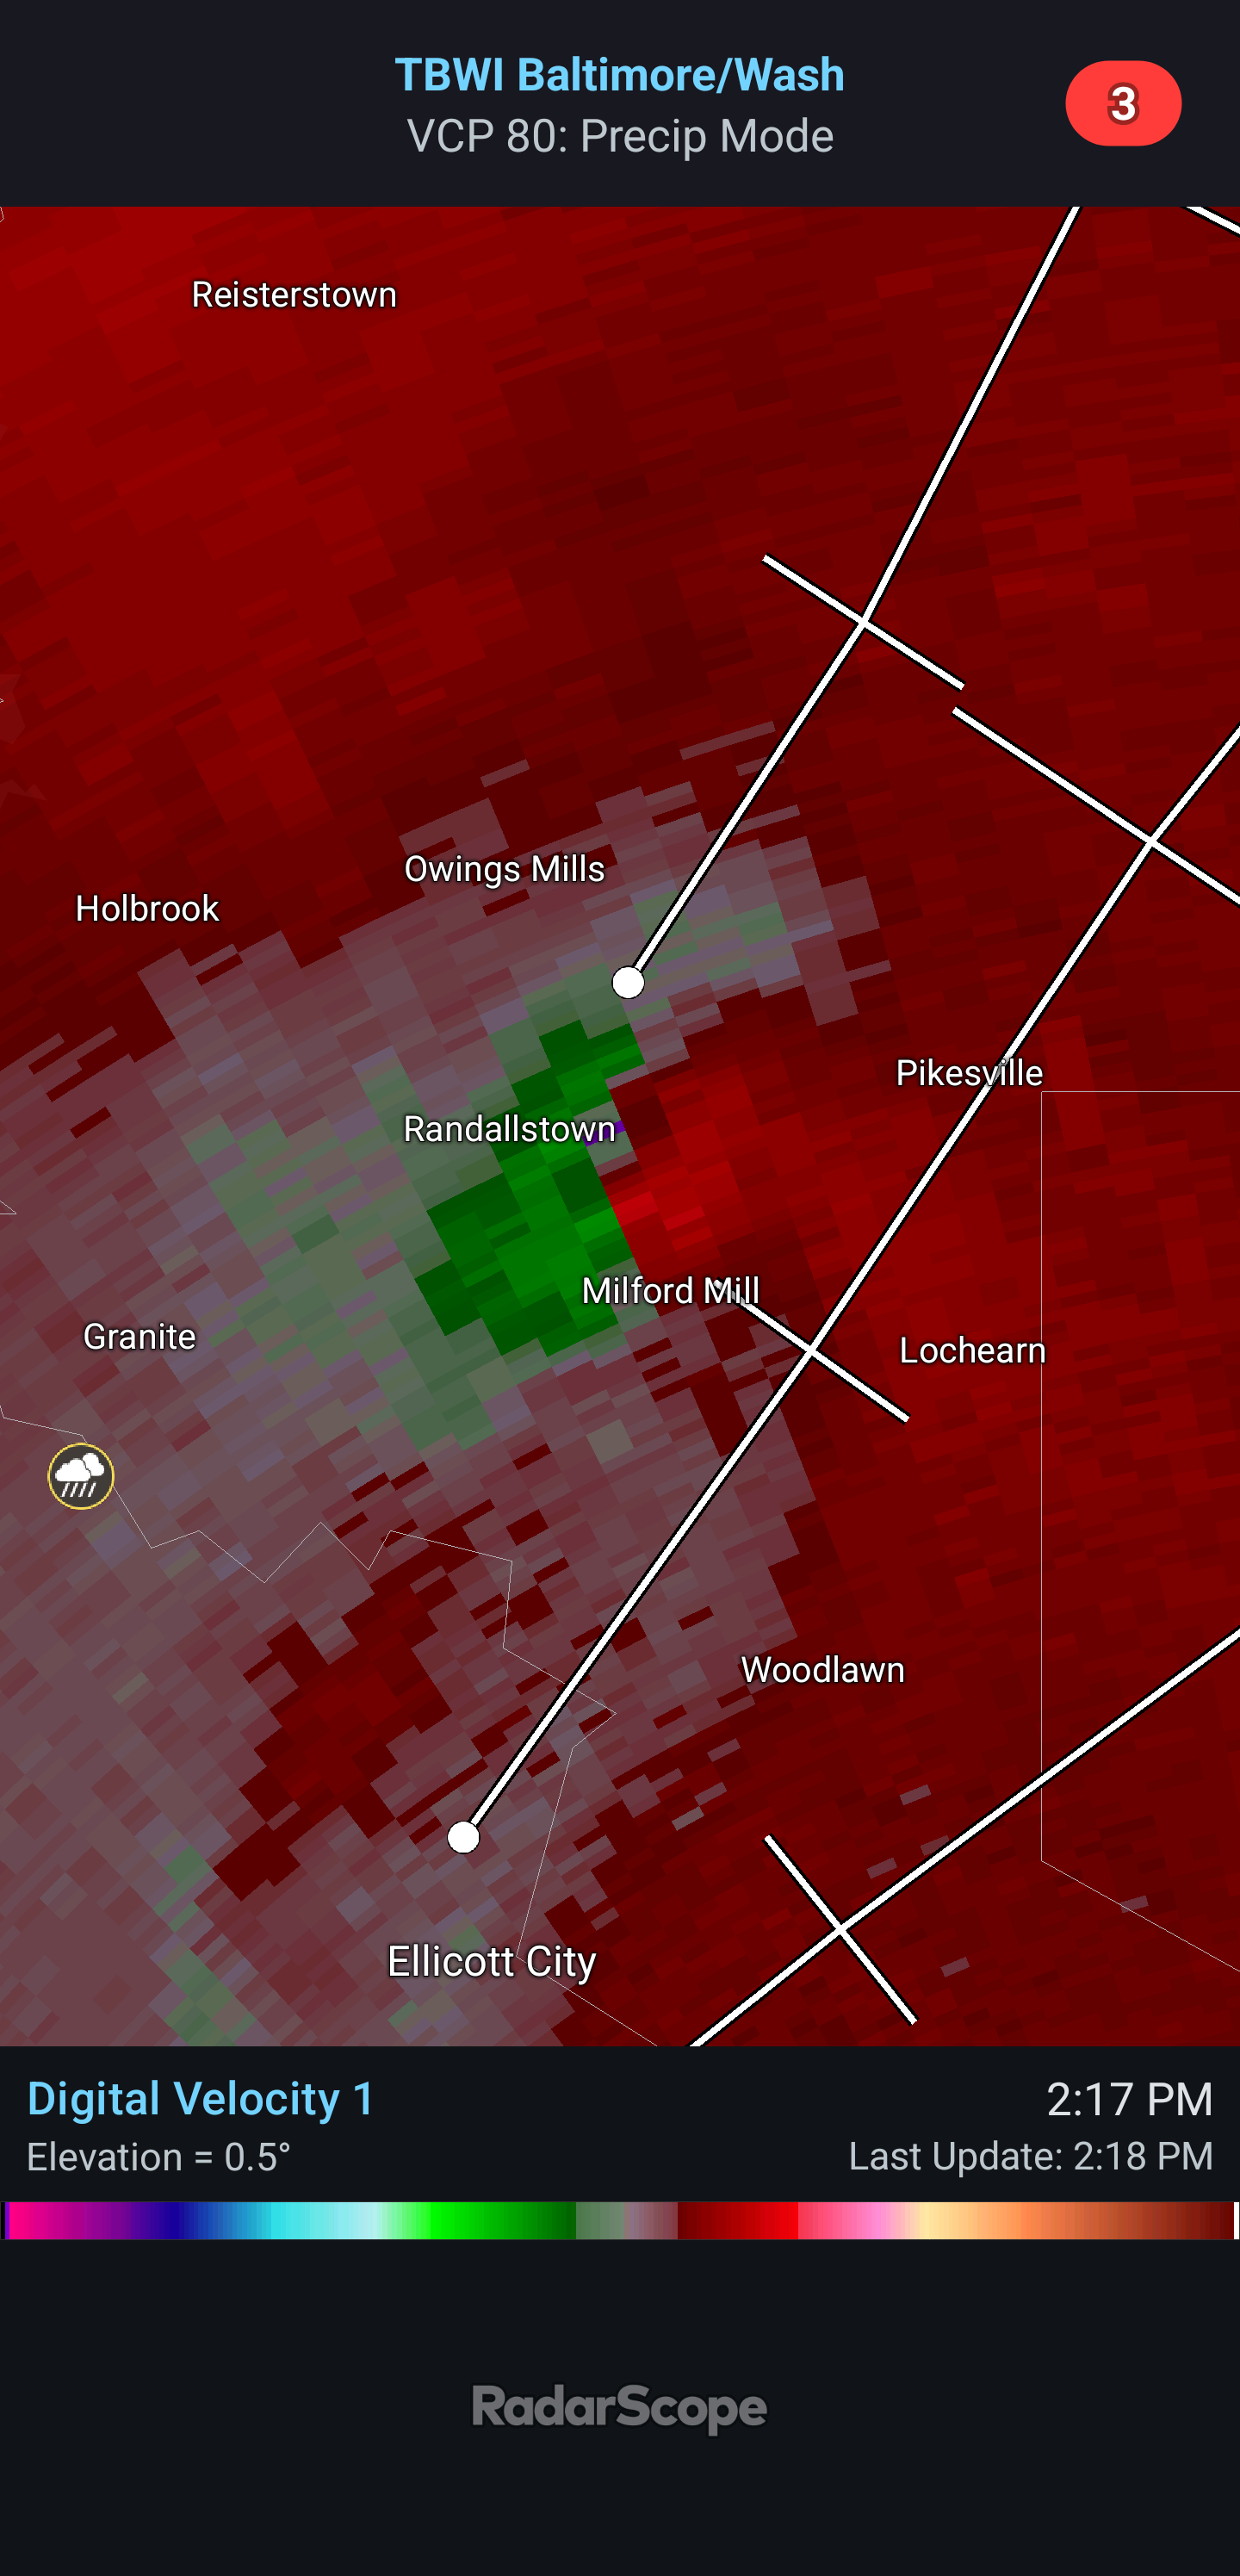
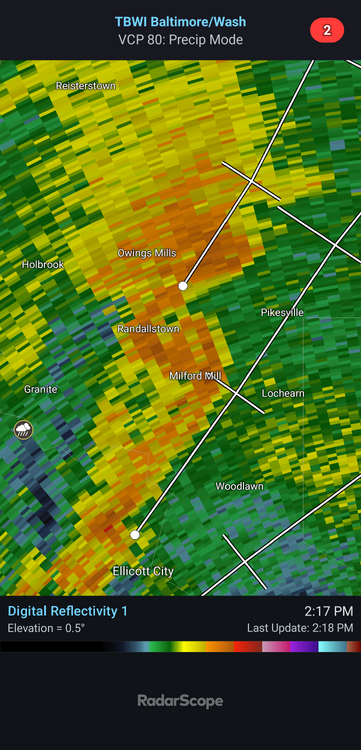
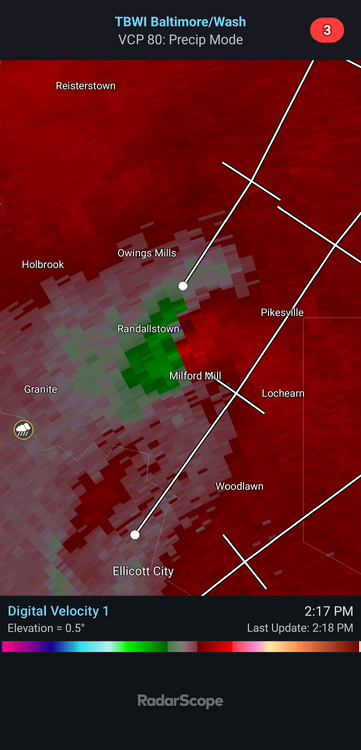
Via terminal radar possible tornado just north of Milford Mill
-
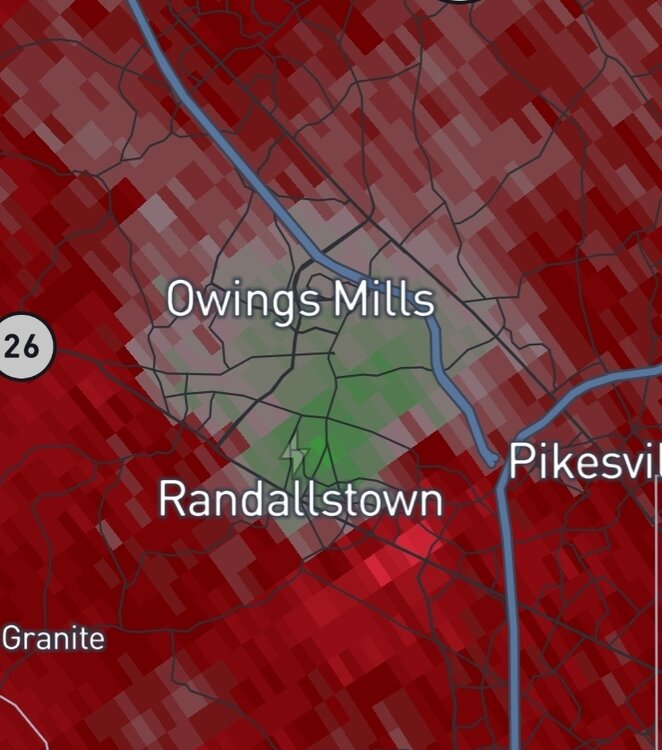
Definite rotation couplet just south of Owings Mills moving NNE. Would be surprised if it was not warned soon.
- 1,704 replies
-
- 2
-

-
- severe
- thunderstorms
- (and 7 more)
-

2026-2027 Super El Nino
bluewave replied to Stormchaserchuck1's topic in Weather Forecasting and Discussion
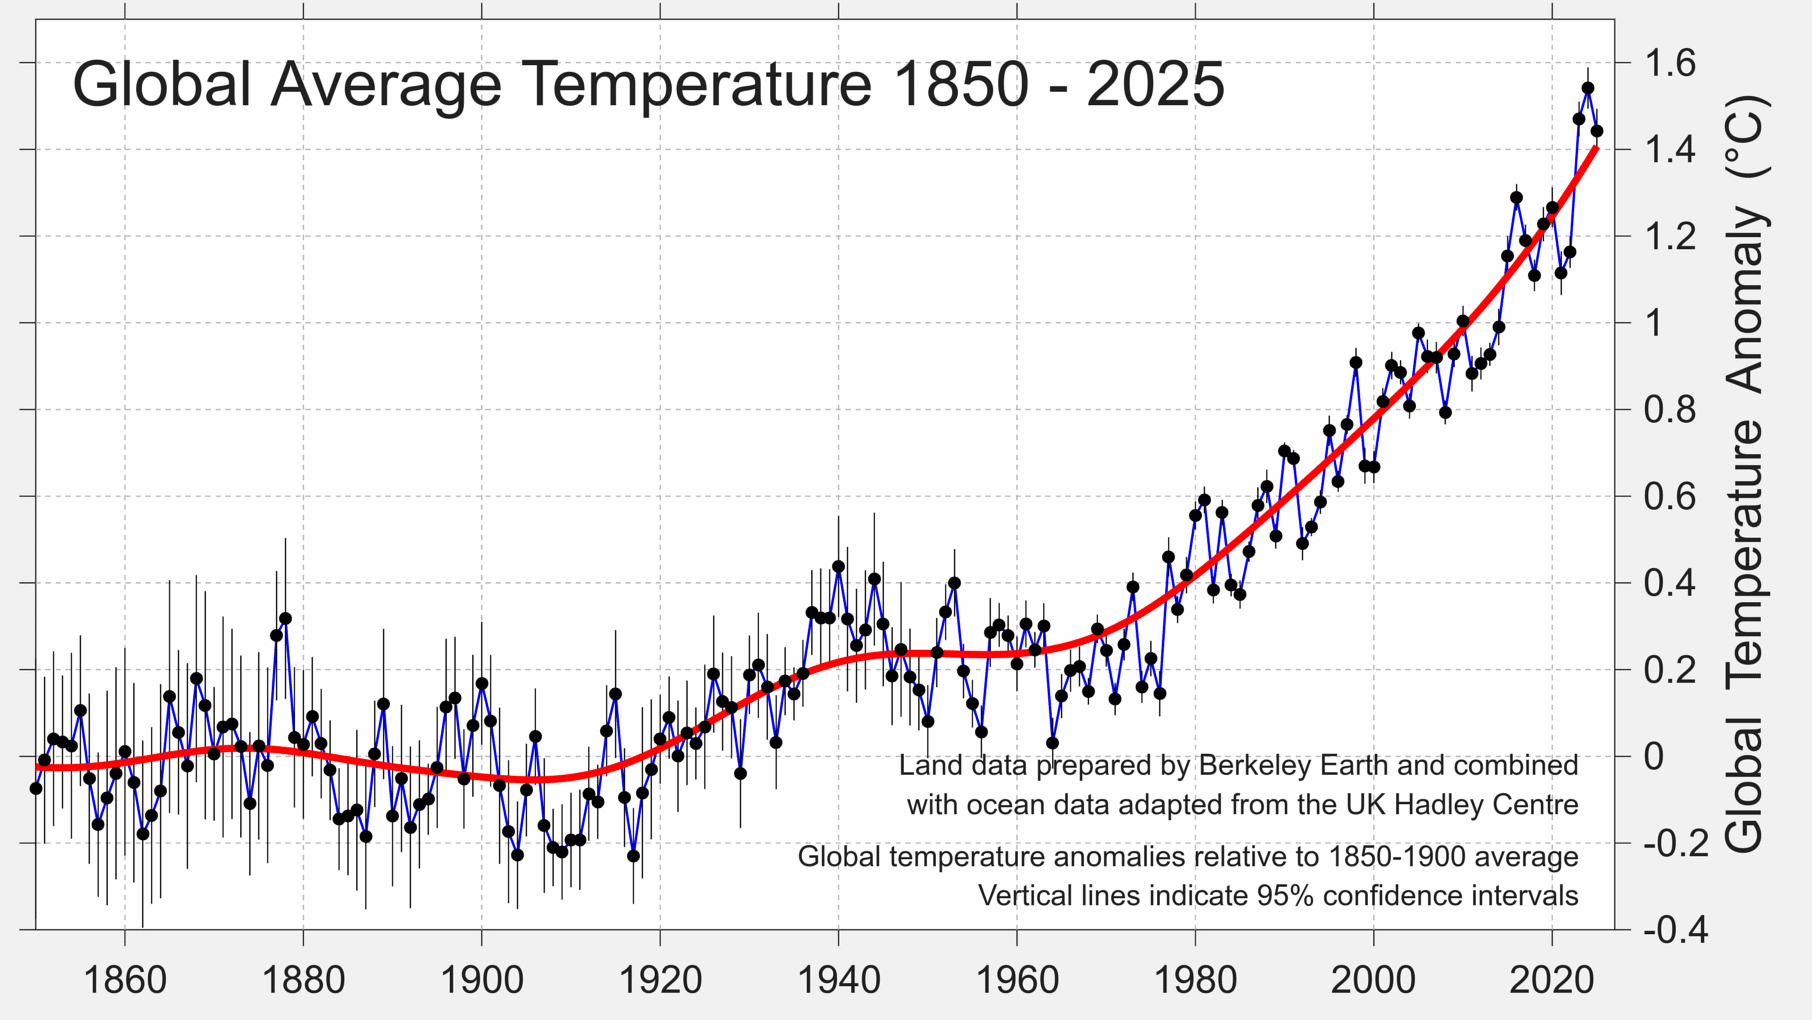
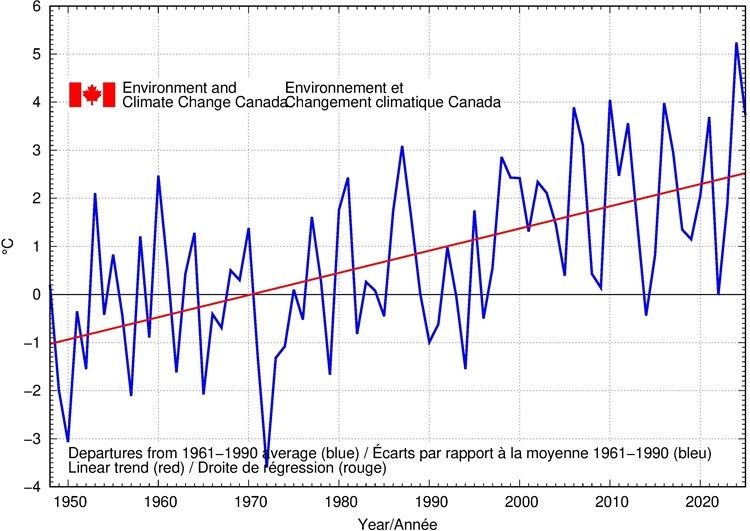
NASA GISS uses 1951-1980 for its departures with Canada going with 1961-1990. Berkeley Earth uses the 1850-1900 period along with Copernicus and the Met Office. 1951-1980 was the last relatively stable temperature regime before emissions and temperatures really took off. So using warmer 1991-2020 climate normals masks the warming relative to the past. https://science.nasa.gov/earth/earth-observatory/world-of-change/global-temperatures/ The NASA GISS team chose the period of 1951-1980 as its baseline largely because the U.S. National Weather Service uses a three-decade period to define “normal” or average temperature. The GISS temperature analysis effort also began around 1980, so the most recent 30-year period was 1951-1980. Their objective is to provide an estimate of temperature change that could be compared with predictions of global climate change in response to atmospheric carbon dioxide, aerosols, and changes in solar activity. https://www.canada.ca/en/environment-climate-change/services/climate-change/science-research-data/climate-trends-variability/trends-variations.html Much of Canadian economic and social activity is climate dependent. Understanding how Canada’s climate is changing, in the context of global climate change, is important for developing adaptive responses. The Climate Trends and Variations Bulletin (CTVB) helps communicate to Canadians how Canada's climate has changed over the recent past and longer, over the period for which Environment Canada has climate observations. The CTVB describes climate variability through maps of current and past departures from the mean (the 30-year average 1961-1990) temperature and precipitation conditions, both seasonally and annually. This approach provides visualization of the extent to which temperature and precipitation vary above and below longer term average conditions. Maps are presented for each season and year. The data are then analyzed to see if there are detectable trends of longer terms against this backdrop of climate variability for Canada as a whole, and for 11 climate regions. This information is presented as graphs with trend lines to assess climate change over the period of record, starting in 1948 when nation-wide records became available. Winter National Temperature Departures and Long-term Trend, 1948–2025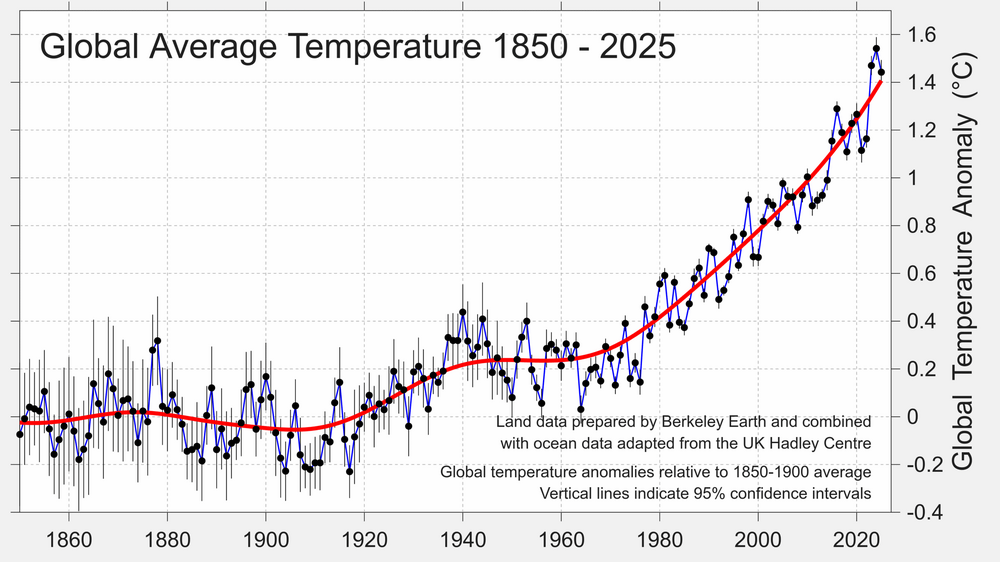
-
Pouring with T&L.
-

2026-2027 Super El Nino
ensonerd1233e343 replied to Stormchaserchuck1's topic in Weather Forecasting and Discussion
Um yea no seasonal models are bad the last 2 winters should be exhibit a, im as much of a weenie as the next guy but im not holding my breath next winter for sustained cold and snow ( here in the mid atl) although there is certainly an increased chance of a big storm w a mega juiced stj, but cold? highly unlikely maybe feb will be cold and thats it - Today
-
buy Viagra online: Viagra online price - Viagra online price
-
Good ole fashioned gullywarsher here in silver spring
-
Some of the heaviest rain I’ve seen here driving down Georgia Ave from Olney.