All Activity
- Past hour
-
Up to 0.87" here for the day
-

Augdewst 2026: Summer's Last Stand
SouthCoastMA replied to Prismshine Productions's topic in New England
Sandwich getting steined fast and hard today I'm in Fall River and its pouring -

Augdewst 2026: Summer's Last Stand
CoastalWx replied to Prismshine Productions's topic in New England
Everyone around you half inch or more. -
Chris, Just arrived at our shop, Davis shows 4.28" (so far today)
-
You had more rain than southern nassau
-
Augdewst 2026: Summer's Last Stand
CoastalWx replied to Prismshine Productions's topic in New England
I’m Gronking -

2026-2027 Super El Nino
OSUmetstud replied to Stormchaserchuck1's topic in Weather Forecasting and Discussion
The main difference is that NOAAs RONI reduction is larger. The raw weekly anomaly is 2.3. They subtracted 0.8. -

Augdewst 2026: Summer's Last Stand
Brian5671 replied to Prismshine Productions's topic in New England
moderate to heavy rain here-feels very tropical -

Augdewst 2026: Summer's Last Stand
Snowedin replied to Prismshine Productions's topic in New England
Dumpage! My dingie is ready for action -
Heavy line of storms just formed right over my area and heading north east. It might have dropped another 1”.
-
I'm not sure why people question the drought. The drought monitor maps have shown that much of the area has been in a moderate ro severe drought the last couple years. I know because I've had to water the vegetable garden so much the last 2 seasons with the very dry ground. Thankfully things turned around in July and it continues now at the start of August. El Nino to the rescue it appears.
-
Outside clouds and some thunderstorm / debris clours Thu - Tue 8/6 - 8/12 looks like return of some sustained 90s in the warmer areas even the city.
-
Wow. I had to water the garden constantly before July due to the super dry pattern -- we were in a severe drought for awhile. Thankfully it turned around in July. Now a good start in August -- glad to get 1.32" so far today.
-
Hopefully all this rain means a great fall foliage season. The last few have been rotten because of severe niña induced summer droughts.
-

Augdewst 2026: Summer's Last Stand
Cyclone-68 replied to Prismshine Productions's topic in New England
It’s almost time for the Cape to have their annual EF1 -
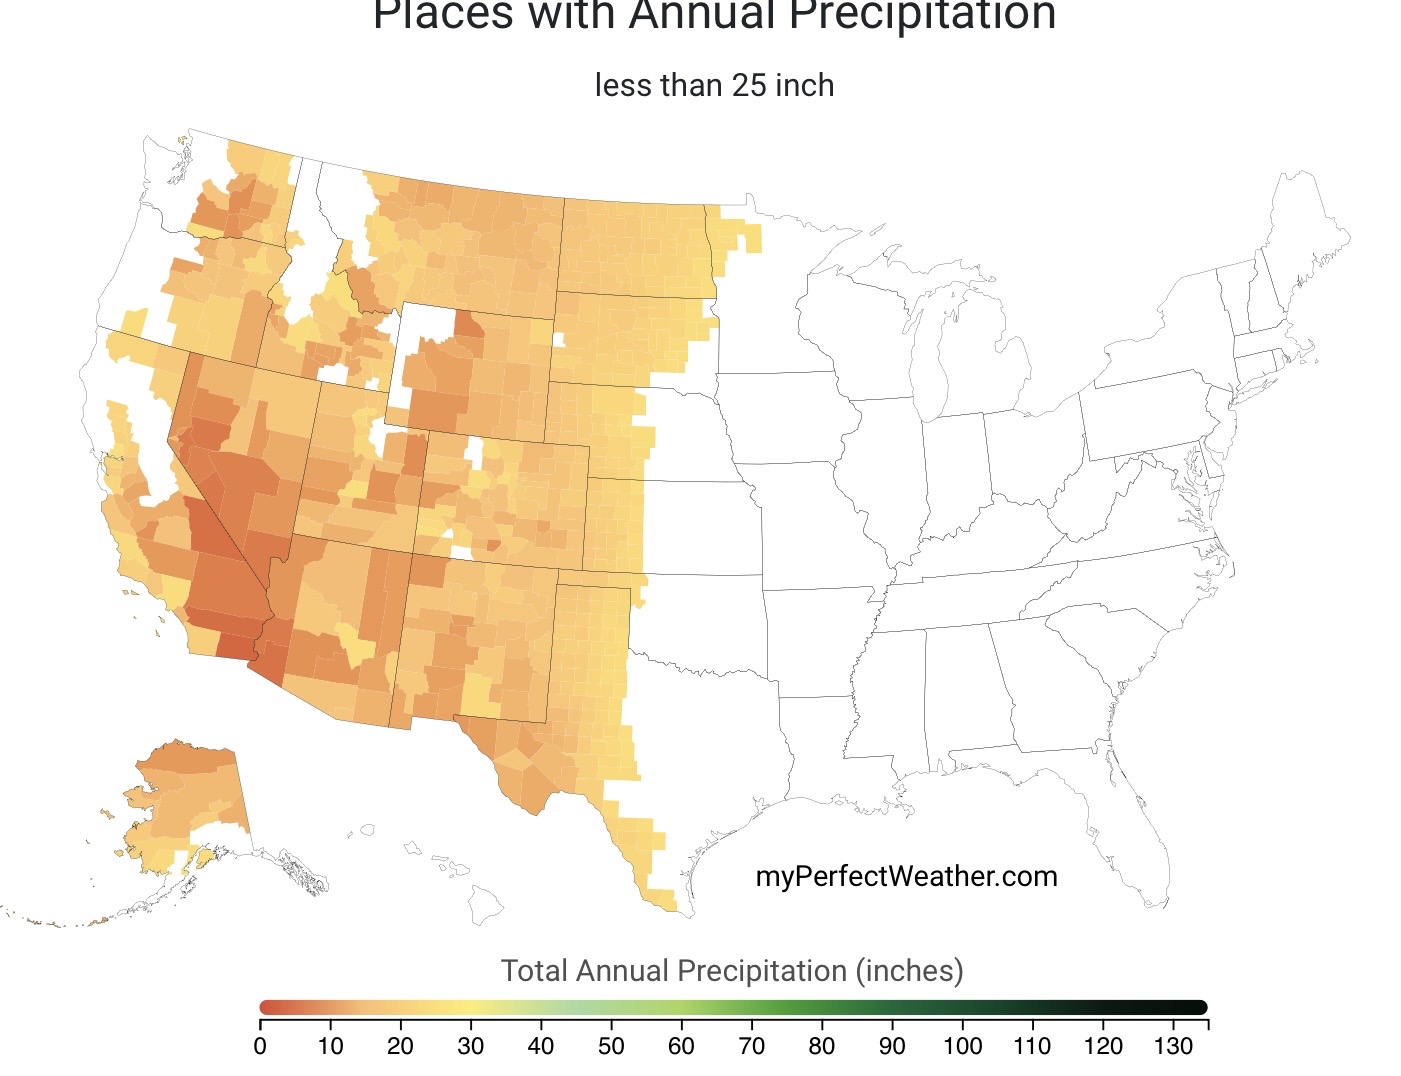
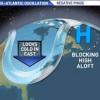
It sounds like you would enjoy the climate out West which averages under 25” a year of precipitation. Just had some friends get back from San Diego and they really loved it out there. We got close to that here back in the 1960s for a time.
-
like a lakes cutter and warm sw flow - clearing out now
-
1.32" here so far. Glad to get a good soaking after my area missed out last week.
-
This is troubling but a sample size of 2 is hard to draw strong conclusions
-

2026-2027 Super El Nino
GaWx replied to Stormchaserchuck1's topic in Weather Forecasting and Discussion
Hot off the press posted by a pro-met! “It does seem strange/off, comparing the CRW and OISST products on cyclonicwx doesn't show that discrepancy.” He then copied this from a NOAA website: “In the afternoon on Aug. 3rd, the ERSSTv5 will switch to ERSSTv6 because NCEI is discontinuing ERSSTv5. RONI values will change slightly. The weekly OISSTv2.1 data will remain unaffected.” -
1.10 rainfall here last 24 hours. Looking at reports with some areas SW of DC near 5 inches.
-
Augdewst 2026: Summer's Last Stand
TauntonBlizzard2013 replied to Prismshine Productions's topic in New England
Under a quarter inch here so far. Don’t spike the football yet -
Skies brightening here. Based on latest visible will be seeing breaks here over the next 60-90 minutes.
-
skies are brightning in eastern NJ as the precip is beginning to move east - expect to see some breaks in the cloud cover soon
-
Augdewst 2026: Summer's Last Stand
CoastalWx replied to Prismshine Productions's topic in New England
We knew. He did not know.