All Activity
- Past hour
-
TORCH!!!
-
That might be a tough ask. Ski areas up north though I could wee getting 2-4...maybe 5".
-
Yeah not looking good. Ensembles not much better
-
I could see a inch or two here if things break right.. NAM and HRRR look good
-

Central PA Spring 2026 Discussion/Obs Thread
Jns2183 replied to Voyager's topic in Upstate New York/Pennsylvania
Here's the addition to drop into the message board post, after the site link and before the feedback section: --- **Lowest Radar Beam by County — South-Central PA Reference** For those who want to know what's actually looking at their county, here are the lowest 0.5° beam heights for the counties covered by this study, sorted alphabetically. Listed as best radar and beam height, with the runner-up in parentheses: **Adams** — KLWX: 4,680 ft MSL (KCCX: 9,241 ft) **Berks** — KDIX: 7,642 ft MSL (KCCX: 10,418 ft) **Cumberland** — KCCX: 7,235 ft MSL (KLWX: 7,377 ft) **Dauphin** — KCCX: 8,029 ft MSL (KLWX: 10,267 ft) **Franklin** — KLWX: 4,902 ft MSL (KCCX: 7,605 ft) **Lancaster** — KDIX: 9,420 ft MSL (KDOX: 8,523 ft) **Lebanon** — KCCX: 10,155 ft MSL (KDIX: 10,763 ft) **Perry** — KCCX: 5,498 ft MSL (KLWX: 8,789 ft) **Schuylkill** — KDIX: 10,008 ft MSL (KCCX: 10,418 ft) **York** — KLWX: 5,874 ft MSL (KDOX: 9,530 ft) A few things worth noting on these numbers. First, these are county-wide averages computed from five representative coordinate points distributed across each county they represent the typical beam height across the bulk of the county's land area, not any specific location within it. This matters especially in south-central PA where the terrain is anything but uniform and several counties are genuinely split between radar coverage zones. Adams, Cumberland, and Lancaster in particular have portions of their land area where a different radar may actually be lower than the county average suggests in some cases up to three different radar sites each hold the lowest beam advantage over some piece of a single county depending on which direction you're standing in it. Second, and this trips people up: these heights are above mean sea level, not above your head. To get the actual distance between you and the beam you need to subtract your own elevation. If you're at 500 feet in the Cumberland Valley and the KCCX 0.5° beam shows 7,235 ft MSL over Cumberland County, the beam is roughly 6,735 feet above you — not 7,235. In the ridge-and-valley terrain to the north and west where elevations run 1,200 to 1,600 feet, that same beam is considerably closer to the surface than the MSL number implies. It's the AGL figure that tells you whether the beam is actually seeing your weather. Sent from my SM-S731U using Tapatalk -
Central PA Spring 2026 Discussion/Obs Thread
Jns2183 replied to Voyager's topic in Upstate New York/Pennsylvania
Central PA In-Depth Series — NEXRAD Beam Coverage & Precipitation Analysis** For those who haven't been following along, I've been working on a series of data-driven deep dives into the weather observation landscape of central Pennsylvania, the kind of local, granular analysis that doesn't get done because it doesn't scale nationally. Each project starts with a question that's been nagging at me as a 35-year observer of this stretch of the Susquehanna Valley and Ridge-and-Valley terrain. The two earlier projects in the series are still up and active. The first is the **MDT vs. CXY Bias Deep Dive** a two-era instrumentation study confirming the ~11% precipitation bias between Harrisburg International and Capital City Airport is real and physical, not an instrumentation artifact, spanning cooperative observer records back to 1948 through 2025 ASOS data: https://jns182wx.github.io/kmdt-cxy-analysis/ The second is the **South-Central PA 25 Years of Winter Weather Deep Dive** a comprehensive climatological look at winter precipitation across our region covering storm catalogs, snow ratio verification, RSI maps, and terrain-aware elevation bias decomposition across the ridge-and-valley province: https://jns182wx.github.io/winter-weather/ --- **The New Project — NEXRAD Beam Geometry & Precipitation Coverage** The question that drove this one: when it rains in south-central Pennsylvania, how much of that rainfall does NEXRAD radar actually see? The geometry alone is striking, the 0.5° beam from KCCX clears 8,000 to 9,000 feet above ground level by the time it reaches the Harrisburg corridor, sitting well above the cloud base during the shallow stratiform rain, drizzle, and cold air damming events that define our winter and early spring precipitation climatology. To answer this properly I pulled three months of hourly ASOS data from ten south-central PA stations, paired each precipitation hour with rawinsonde thermodynamics from IEM, and computed precise beam heights using the standard 4/3 Earth-radius WSR-88D formula for all four radars covering us, KCCX, KLWX, KDIX, and KBGM, selecting the best radar per station by actual geometry rather than assumed proximity. Along the way I found a critical data quality issue that affects anyone using IEM's ASOS archive: the p01i field is a running cumulative total since the last routine observation, not a per-period amount. Naive summation of sub-hourly SPECI observations inflates event totals by 1.5 to 2.5 times. Every precipitation number in this project uses the corrected method. The findings are instructive but also honest about the limits of what surface observations alone can tell us. For the Harrisburg corridor stations the beam is provably below the cloud base, sampling clear air, during a meaningful fraction of rainy hours. For the majority of precipitation hours the beam is at or above the cloud base, but without cloud-top data we can't say whether it's sampling the precipitating layer or overshooting it entirely. What the rawinsonde thermodynamics add is character, the February 20th CAD event shows the freezing level within 300 feet of the beam height, textbook conditions for bright band contamination. January 25th shows the opposite: deep warm frontal overrunning with 105-knot bulk shear and the beam solidly inside a saturated column, exactly when radar performs well. The five storm deep dives each pull hourly RAP BUFKIT soundings for all ten stations, compute hodographs, storm tilt, raindrop trajectory, dry air intrusion, and wet-bulb zero, and render a west-to-east atmospheric cross-section showing where the beam intersects the thermodynamic structure of the storm. Full site with all interactive tools and downloadable data here: https://jns182wx.github.io/radar_site/ --- **Feedback, Corrections, and What's Next** If you spot an error in the beam geometry, a station assignment that looks wrong, a precipitation total that doesn't match your records, or a methodology choice you'd push back on, please say so. Same goes for the earlier projects. Local knowledge improves local science and if you've been observing in this part of PA for any length of time your instincts about what the data should look like are worth hearing. If you have ideas for sections to add to any of these , additional storm events, verification against CoCoRaHS or COOP records, cross-sections to other radar sites, those conversations are welcome too. The next project is going to need community input to be worthwhile so I want to put it out there now. I just got my **Ecowitt GW90 "Fatboy"** up and running and in that spirit of personal weather stations, the next deep dive is going to look at the PWS landscape across south-central PA: station distribution, hardware and software variety, network density, and most importantly bias estimation and quality weighting against official observations. The core idea is to take any location, wherever you live or work, drop a 5, 10, 15, and 20km radius around your coordinates, and map every PWS, ASOS, CoCoRaHS, COOP, and DCP station in each ring with historical bias estimates where the record supports them. Think miniaturized personal MADIS for your specific spot. Long term the goal is to integrate that localized ground truth with NBM (which is taking over NWS short-range forecasting) and MRMS (radar-derived QPE) to arrive at a reliable blended daily ground truth that's actually calibrated to where you are rather than the nearest official station. This requires a significant amount of manual data collection to do right, so I want to direct the effort toward people for whom it will be genuinely useful. **If you want to be part of this, respond here or DM me with your town name or coordinates.** At minimum you'll get a full report on your local station landscape with whatever bias estimates the historical record supports, within the next month. And if you have ideas for other locally-rooted projects , anything about the weather in your corner of central PA that nobody seems to have a good quantitative answer for, I'd genuinely love to hear them. Sent from my SM-S731U using Tapatalk -
I never realized CC was so XXX.
-
https://x.com/therealdtox/status/2041138070888567159?s=61
-

2026-2027 El Nino
snowman19 replied to Stormchaserchuck1's topic in Weather Forecasting and Discussion
-
WPC has 7-day total precipitation at < 0.10".
-
This is one of the most dry 16 day forecasts I've ever seen, especially for April.
.thumb.png.54674e57a37d6b06b3a99cb83895b661.png)
-
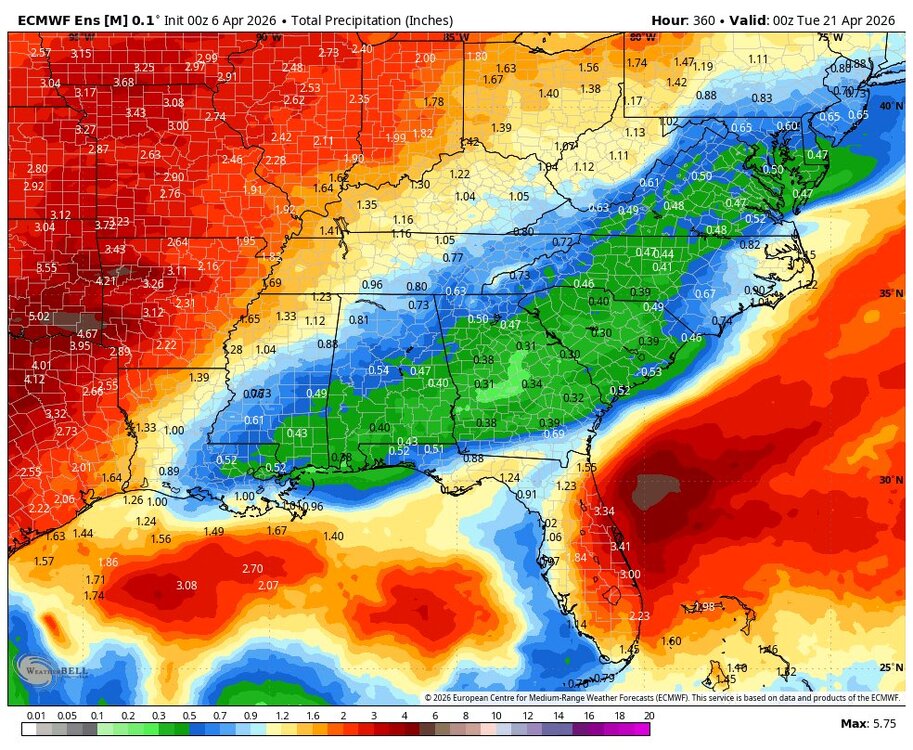
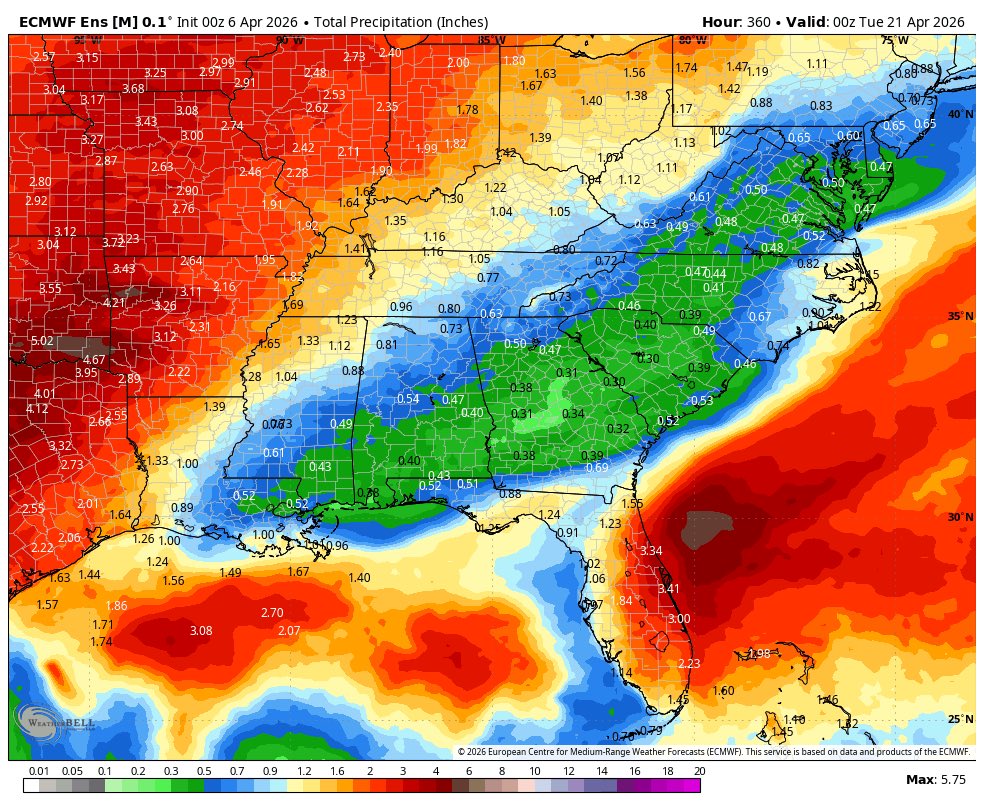
Winter 2026-2027 Seasonal Outlook
wncsnow replied to WinstonSalemArlington's topic in Southeastern States
Super El Nino coming -
OH yeah, that's an excellent point. I keep having to also remind myself that we are not running around naked at 3:29 a.m. when it's supposedly a warm cloth Asian massage out there. Seriously... there's probably a pretty significant sensible/exposure bias involved - there has to be... we're human "animals". Completely enslaved to what we see, hear, smell, touch or taste in our defining the nature of our surrounding. It's also as least partial in why CC is so easy to collectively deny ... it just doesn't readily appeal. Not readily enough.
-

Central PA Spring 2026 Discussion/Obs Thread
canderson replied to Voyager's topic in Upstate New York/Pennsylvania
Ugh been there before. 41 was my highest gust. CTP really failed that forecast. -
I noticed that too... Might be the last snow in air we see outside alpine regions until the mandatory, season ruining Halloween 3.7"
-
Just looked. Islip got 16”. My parents told me it was a major blizzard for that time. Looks like they were right
-
You have Islip? I think it was a big storm out here
-

2026-2027 El Nino
A-L-E-K replied to Stormchaserchuck1's topic in Weather Forecasting and Discussion
time 2 torch -
Beautiful day. Major October vibes with brighter sun.
-
I saw that; think that is not very customer service friendly. The criteria for a frost/freeze watch/ warning should not be some historic average but rather any time in the spring and fall season that a cold night hits that could catch a normal person who is not a weather nerd like us by surprise. I'm sure some people have planted tender vegetation/ flowers already so a headline heads-up makes a lot of sense.
-
Yeah golfing is coming before gardening for sure. Be nice if my days off aligned with some nice weather instead of 43 and windy tho.
-
Thanks. Do you have a link to the source for the map Chris posted?
- Today
-
There won't be any frost/freeze products though from LWX
-

Occasional Thoughts on Climate Change
Typhoon Tip replied to donsutherland1's topic in Climate Change
These bold' are all of it. Two aspects zooming past one another in humanity's race toward the cliff. The first one is a complete and utter misconception about climate change, one that I feel pretty strongly is the fault of the origianl science PR vision. When it became clear in the atmospheric geogphysical mathematics decades ago, their campaign felt like an attack on civility traditions... function heritages ... generational ingrained ways and means. When in reality, global warming, per se, isn't the problem. Whaaaaaa ! It's not, not per se. The problem is, adaptation capacity. That's always been it, and as far as I can hear or read, very few seem to really know this. The world could warm 100 points - if all species can adapt, in time, the conversation is rendered moot. Whenever we hear these less than adequately educated self-appointed spoke persons of denial attempt to invoke the argument, "the earth has been warmer before", or "climate change is part of the Earth's history" ... we cringe. Once one understands that derivatives and partial derivatives in the integration of the whole system ( i.e., change with respect other factors ( DX/ DY) ) is what creates the nature of all and nature itself, they then know that the former talking points are just labels and scalars. Meaningless in the definition of what the problem really is. Those that continue to rely on the scalars and won't bother to get with the program, to paraphrase Brian Cox, 'you should be largely ignored ... even chastised'. Because your opinion is uncoupled from objective causality. The 2nd one is 'virtue signaling' ... At least the deniers are honest about it their feelings - gotta give 'em that. Take the entire en masse acceptance demographic... of them, a scant % are actually doing anything to really curb their ways and means. I've been raging about the 5 senses evolutionary limitation on perceived threats for years. We are a species really only just on the cusp of escaping our primitive state - for the sake of discussion... call primal state any animal that is not modifying their own genetics, sending meat wagons to the moon, and on the verge of Quantum Computing ... We are smart enough to innovate these, which means ... we are also intrinsically capable of predicting how what we do will both effect and affect. Yet, we are still slaved to only believing what these intellectual gifts are telling us until we actually see, hear, smell, touch, or taste the threat. I really think at a very fundamental, most discrete level ...that's it. You tell a person to step off the train track, 'a train is coming,' they pier up and down the rail in either direction - they must not believe it unless it is seen or heard. If they had, you never would have had to tell them in the first place. So, humanity is standing around on the track, arguing about the color shoes they are wearing to the engagement when it comes to this global warm stuff. Which is kind of funny, because what the hell else are the tracks for. Climate change doesn't really have a real-time observation-advocate that immediately appeals to the senses - this is a problem when attempting to convey any sense of urgency. -
We're onto next season.


.png.2dd34f578b62fda286e7240d8eda413b.png)