All Activity
- Past hour
-
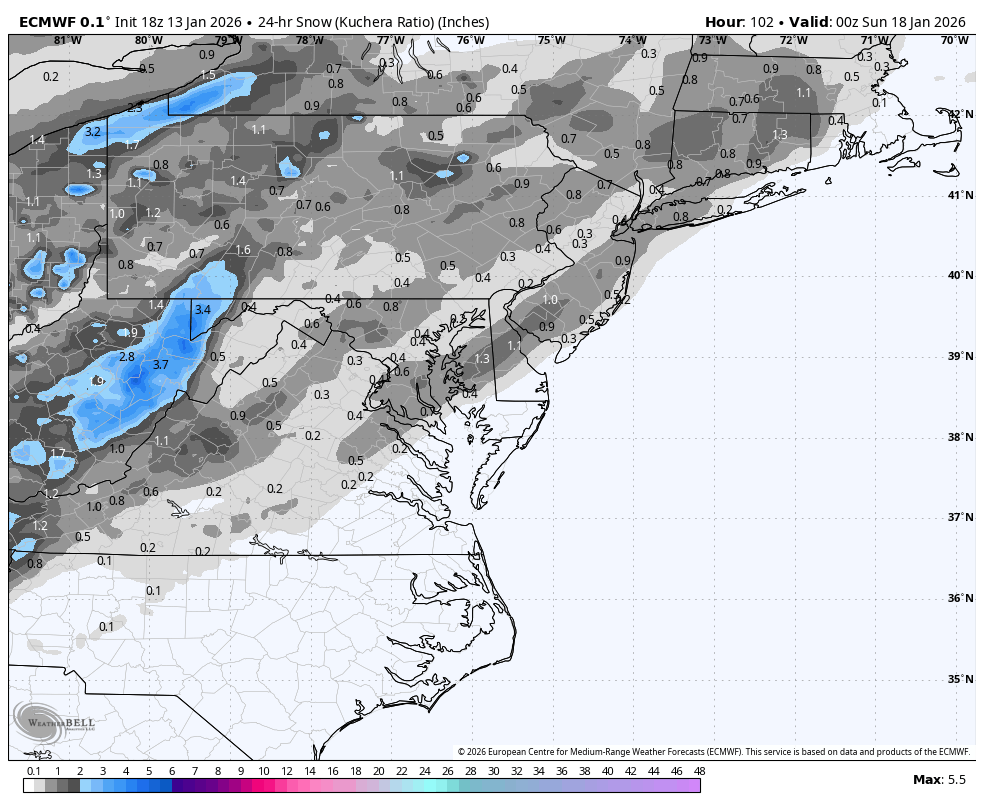
There is that weenie model that we would all love to see. Maybe the low a tad further east to avoid any mixing issues along the twin forks, south shore of LI. Likelihood of this 276 hour model being correct? Very low. Show it to me again when it is within 5 days, and it will get me interested in it. bring those big snow totals further east and you will get a lot of snow weenies very excited. Even if this is for 360 hours out. :)
-
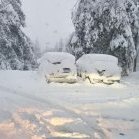
Wouldn’t be too far to chase because it’s nada here
-
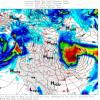
I’m here after viewing the 18z gfs. Arctic cold leading into a southern stream feature sounds kinda fun.
-

January 2026 regional war/obs/disco thread
Bryan63 replied to Baroclinic Zone's topic in New England
I am travel for work the week of the 27th so you can pretty much lock that storm in now. -
One of the camps of models is going to be wrong. Way wrong at that. Will the MJO win or the models win?
-
The way things are going, it's really hard to say. For all intents and Purposes P6 should be warm going by the Chart's. It's obviously not . As we know, the MJO has been of low Amp or in the COD alot. Also, the Kelvin and Rosbys have been creating chaos as you've been pointing out. My take is, like you, there'll be a strong but probably short lived warm-up. If the depiction from the EC you posted is correct it may last longer. I just don't buy that deep of a Trough out West. Just my 2 cents worth.
-
On those last two maps I'll take the under on the snowfall and the over on the temps. I'll also take a bet that the 00Z run offers a vastly different solution.....360 op progs = useless and serve no purpose.
-
Of course it'll verify from Michigain all the way to Maine, cause we all know it doesn't snow here anymore.
-
Yeah towards or into next weekend
-
LOL @ all the butt hurt in this thread on a so called “science board”.
-

January 2026 regional war/obs/disco thread
cleetussnow replied to Baroclinic Zone's topic in New England
Whining fires up in earnest after 0z runs tonight….until April -

January 2026 regional war/obs/disco thread
The 4 Seasons replied to Baroclinic Zone's topic in New England
i like that. it was a Sopranos reference, i guess no one picked up on that -
Welcome to the New Juneau Ak!
-

Winter 2025-26 Short Range Discussion
IWXwx replied to SchaumburgStormer's topic in Lakes/Ohio Valley
Baby steps toward seeing some action IMBY. @Jackstrawmight be in play. -
The GFS is the biggest joke and has actually gotten worse.
-
This forum would have to shut down if that map actually verified. It would be unbearable in here lol. 2ft+ to next to nothing further south
-
You’re talking about not this coming weekend but the next? Which The Weather Channel supports what you’re saying. Temps in the mid 40s with rain and snow.
-

January 2026 regional war/obs/disco thread
WinterWolf replied to Baroclinic Zone's topic in New England
What’s comical is the 12z GFS had zilch, then 18z throws out an All Timer for a huge area. That would shut up the whining pussys quickly. -
And that GFS run has it getting a bit chilly in the wake of the snow. NYC just misses below 0F. Last time was 2016 (-1F) and before that it was 1994. Just so rare these days.
-
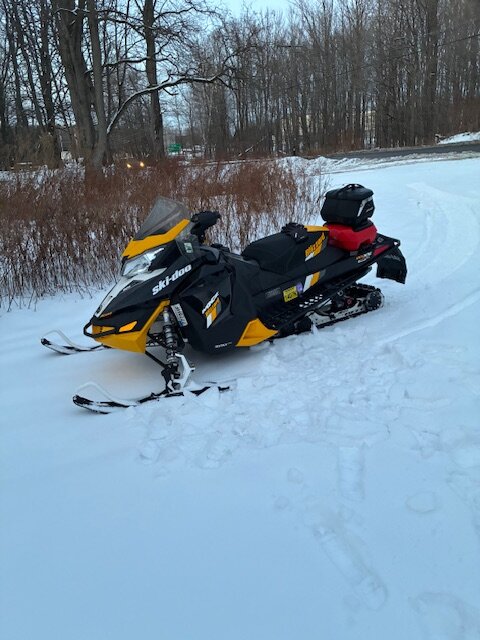
I might trailer a bit north as well Saturday. I got a new to me sled. 2017 900 ACE Blizzard. 3200 miles on it and I paid $4800.
-
January 2026 regional war/obs/disco thread
cleetussnow replied to Baroclinic Zone's topic in New England
The tower at WKRP will be buried! Les Nessman will be too busy with traffic to do the daily hog report. -
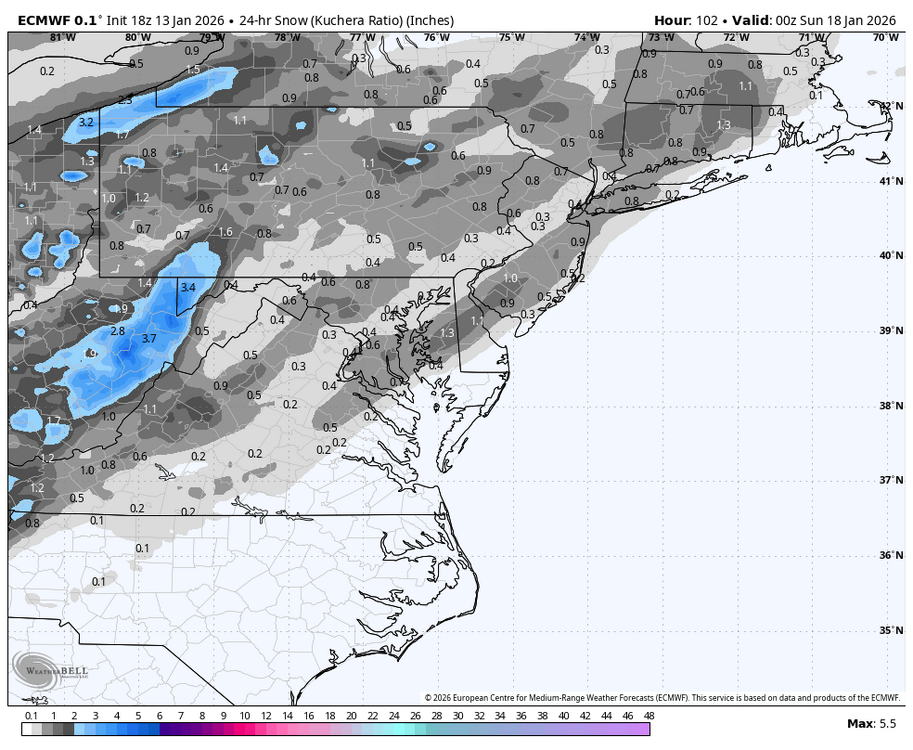
WB 18Z EURO for Saturday....
-

January 2026 regional war/obs/disco thread
butterfish55 replied to Baroclinic Zone's topic in New England
Someone start a thread!! -
Some good points in the CPC MJO update from yesterday. I'll include the bullet points below from the PDF. They seem open to the idea of potential phase 8 sometime week 3. Which will be interesting to see what happens with that. Guidance is still looking good with it btw... These updates always give a good read, not only on the MJO, but also the state of ENSO. On a weekly basis. https://www.cpc.ncep.noaa.gov/products/precip/CWlink/MJO/mjoupdate.pdf • The year 2025 closed out with a weak and incoherent MJO. However, after a slow start to January the RMM index has recently emerged from the unit circle in phase 6 (Western Pacific) • La Nina related ocean/atmosphere anomalies persist, but La Nina is showing signs of weakening with the enhanced trade winds across the equatorial Pacific recently disrupted. • Dynamical models are in good agreement in predicting a continued increase in the RMM index over week-1, then eastward propagation towards the Western Hemisphere by week-3. • Tropical cyclone development is most likely to occur near northern Australia during the next two to three weeks. • Following a well-defined MJO during late November, the time longitude plot indicates other modes of tropical variability, such as a fast moving Kelvin wave, have become more dominant over the past few weeks. However, there are indications in the VP maps that a wave-1 pattern may be reemerging. • Enhanced convection, related to the ongoing La Nina, persists over the Maritime Continent. • Consistent with the ongoing La Nina, enhanced upper-level westerlies persist across the equatorial Pacific. • Anomalous easterlies reemerged over equatorial Africa in late December, and have shifted eastward over the Indian Ocean over the last week or so. • Enhanced trade winds over the equatorial central Pacific, associated with La Nina, were interrupted around the New Year by anomalous westerlies, possibly associated with a Rossby wave, but they have since returned east of the Date Line. • Westerly anomalies have persisted across the Indian Ocean and expanded eastward since late December. • La Nina induced suppressed convection became quite strong near the Date Line during late December and into the beginning of January before weakening and shifting westward. • A plume of enhanced convection extended to the west coast of the United States throughout December. Enhanced convection increased over Hawaii around the New Year and has persisted to near-present. • Negative SST anomalies persist across all NINO regions, with cooler temperatures observed over the eastern Pacific. • The NINO 4 region has warmed notably over the last few months, with anomalies approaching zero. • Warmer waters expanding eastward beyond the Date Line suggests oceanic downwelling Kelvin wave activity. • Following an incoherent MJO from late November into early January, the RMM-based index has begun to increase in amplitude, recently emerging from the unit circle in phase 6 (Western Pacific). • Dynamical models are in good agreement with a continued strengthening of the RMM signal in phase 6 during week-1, then propagation eastward into phase 7 or 8 by week-3. • As seen above, the GEFS has better than usual clustering of members, and very good agreement is also noted in the ECMWF. This ensemble clustering continues in extended-range solutions from the GEFS and ECMWF, increasing forecast confidence. • The GEFS OLR tool depicts a large increase in the strength of the suppressed/enhanced convection dipole over the Indian Ocean/Western Pacific. • Late in the forecast period a slight eastward shift is noted. • The constructed analog tool is faster with the eastward progression of enhanced convection into the Western Hemisphere.
-
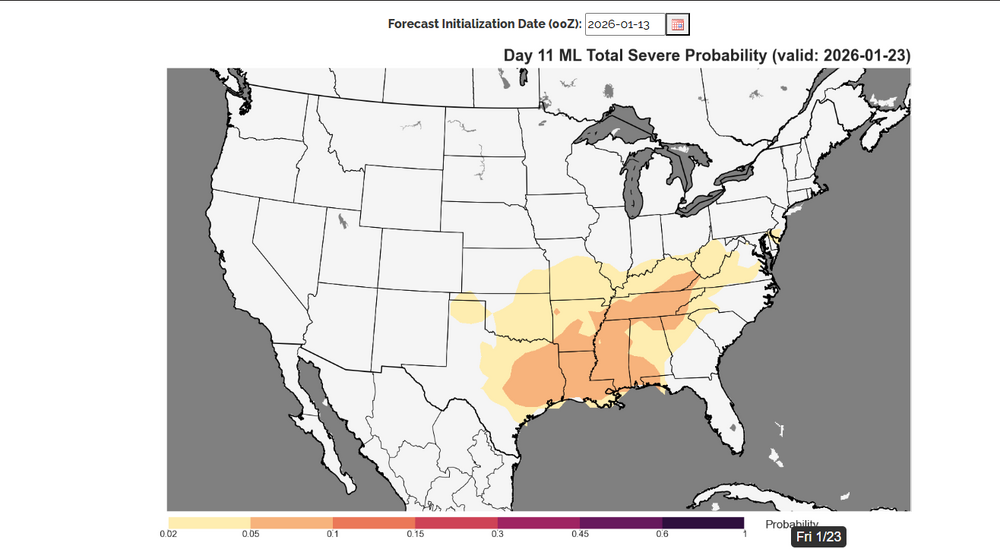
HR276 on the 18z GFS op is hilarious. Snow from northern tip of Georgia all the way up to Maine.