All Activity
- Past hour
-
Two to three weeks, maybe more, may average cooler than normal now. Models are pretty consistent. Appears that some western North America ridging is somewhat anchored by a trough in far eastern Siberia and the western Aleutians. Related to the East Asia pattern, Siberia and Mongolia snow is running at/above normal per Rutgers snow map. Unfortunately, my observed / historical pressure anomaly charts for the last 7 and 30 days is not updating with the gov shut-down. NOAA Physical Sciences Lab is not immediate forecasts like most NWS sites that update. Without recent history pressure I can't put the snow cover into context. Hence, I post in the fall thread rather than winter. SST discussion in the winter thread is good though. In night sky news I saw Comet Lemmon Wednesday pretty clearly through binoculars. Could not make it to darker sky Tuesday when it was closest to Earth, but another observer said Wednesday was just as good. First try Sun/Mon was inconclusive. Anyway tonight Thursday may be the last chance before greater cloud coverage and / or moon.
-

Mid to long range discussion- 2025
WinstonSalemArlington replied to wncsnow's topic in Southeastern States
Get those furnaces serviced -
that was moving at a decent clip-this storm is forecast to meander near the island for 2-3 days
-
Per link below the 2023 warming has been attributed to El Nino. The article does say that the warming came on more suddenly and lasted longer than a typical nino. But that is probably due the increasingly positive radiation balance due to cloud feedback and air pollution control. I haven't seen the Hunga Tonga volcano linked to significant warming in a scientific paper. https://www.science.org/doi/10.1126/science.adt7207
-
1988 hurricane gilbert center went right down the middle of jamaica from the east all the way to the west and did not lose any strength..
-
 nrgjeff changed their profile photo
 -
Mid-late April?
-
Because that’s what insane people do.
-
Good afternoon everyone, Self - caution. Use your own interp. Some time before any thread on a possible (in my mind probable) 1-3" rain event with a brief period of power outage fully leafed tree power outages on the coast and even isolated slight R# eddy transfer 40-45 MPH gusts inland beneath the potential 850 MB se 60 kt jet on the 30th. That rainfall if it occurs (it can still end up less than 1" for us with the bigger heavy rain in New England), will bring most if not all OKX climate sites close to normal monthly totals. So... another cycle or two of ensembles before committing. ECAI hopefully is on the right track as its been steadiest. Of interest is the 06z ECAI distant Melissa 850mb inflow feed but outlier long shot at this point. FOLLOW NHC. I plan to start the November thread sometime this weekend after a look see on how fast this Canadian block breaks down week two or beyond. A period of wet snow or snow shower-rain showers seems to be in the offing (suggestion via modeled by some ensembles) for I84 high terrain sometime the first 7 to 10 days of November due to the repeated digging of Canadian short waves. Waiting til the weekend to start November.
-

Spooky Season (October Disco Thread)
weathafella replied to Prismshine Productions's topic in New England
lol….looking at this cluster does NOT give me an “it’s coming!” feeling. -
Records: Highs: EWR: 87 (1947) NYC: 85 (1947) LGA: 86 (1947) JFK: 77 (1978) Lows: EWR: 30 (1997) NYC: 32 (1969) LGA: 32 (1969) JFK: 33 (1969) Historical: 1761 - A hurricane struck southeastern New England. It was the most violent in thirty years. Thousands of trees blocked roads in Massachsuetts and Rhode Island. (David Ludlum) 1843 - "Indian Summer" was routed by cold and snow that brought sleighing from the Poconos to Vermont. A foot of snow blanketed Haverhill NH and Newberry VT, and 18 to 24 inches were reported in some of the higher elevations. Snow stayed on the ground until the next spring. (22nd-23rd) (Sandra and TI Richard Sanders - 1987) (The Weather Channel) 1878: One of the most severe hurricanes to affect eastern Virginia in the latter half of the 19th century struck on October 23, 1878. This storm moved rapidly northward from the Bahamas on October 22nd and hit the North Carolina coast late that same day moving at a forward speed of 40 to 50 mph. The storm continued northward passing through east central Virginia, Maryland and eastern Pennsylvania. The barometric pressure fell to 28.78". The five minute sustained wind reached 84 mph at Cape Henry. During the heaviest part of the gale, the wind at Kitty Hawk, North Carolina registered 100 mph. The instrument itself has finally blown away and therefore no further record was made. 1920: Famed research meteorologist Theodore Fujita, was born on this date in Kitakyushu City, Japan. Fujita, known as "Mr. Tornado" after developing the international standard for measuring tornado severity, also discovered microbursts. 1947: Fish fell from the sky in Marksville, LA. Thousands of fish fell from the sky in an area 1,000 feet long by 80 feet wide possibly due to a waterspout. 1969: Boston, Massachusetts had a high temperature of 38 °F the coldest high temperature for October. (Ref. NOAA Boston Weather Events) 1987 - Thirteen cities in the southeastern U.S. reported record low temperatures for the date. It marked the sixth record low of the month for Greer SC and Columbia SC, and the ninth of the month for Montgomery AL. Showers and thunderstorms deluged Corpus Christi TX with five inches of rain. Winnemucca NV reported their first measurable rain in ninety-two days, while Yakima WA reported a record 96 days in a row without measurable rainfall. (Storm Data) (The National Weather Summary) 1988 - Denver, CO, reported their first freeze of the autumn, and Chicago, IL, reported their first snow. In Texas, afternoon highs of 93 degrees at Austin and San Antonio were records for the date. (The National Weather Summary) 1989 - A storm moving out of the Gulf of Alaska brought rain and high winds to the Central Pacific Coast Region. High winds in Nevada gusted to 67 mph at Reno, and thunderstorms around Redding CA produced wind gusts to 66 mph. Locally heavy rains in the San Francisco area caused numerous mudslides, adding insult to injury for earthquake victims. (The National Weather Summary) (Storm Data) 1997: Freeze 30°F killed tomatoes in Annandale, VA the earliest since 1992. (Ref. Annandale Weather Records) 2003: Arizona: Phoenix sets a record high and also breaks the record for the latest date for a triple-digit temperature as the temperature soars to 100 °F. (Ref. WxDoctor) 2005: Hurricane Wilma produced high winds pushing a high storm surge that breached a wide stretch of Havana, Cuba's seawall flooding area neighborhoods, spreading up to four blocks inland. (Ref. Wilson Weather History) 2007: Northern Louisiana: Cold air descends over northern Louisiana setting daily low maximum temperature records. El Dorado only reaches a high of only 52°F and Monroe, 54°F. (Ref. WxDoctor) 2015: On this day, Hurricane Patricia became the most powerful tropical cyclone ever measured in the Western Hemisphere as its maximum sustained winds reached an unprecedented 200 mph (320 kph) and its central pressure fell to 879 millibars (25.96 inches of mercury). Hurricane Patricia became the strongest Pacific hurricane on record shortly after midnight CDT early on Oct. 23. Air Force Hurricane Hunters had flown through the eye of Patricia and reported a sea-level pressure of 894 millibars as measured by a dropsonde inside the eye itself. Wind measurements suggested that the pressure measurement was not in the exact center of the eye and was probably not the absolute lowest pressure, prompting NHC to estimate the minimum central pressure at 892 millibars in its special 12:30 a.m. CDT advisory. Tropical cyclone strength comparisons are typically based on minimum central pressure. At 892 millibars, Patricia shattered the Eastern Pacific basin's previous record of 902 millibars set by Hurricane Linda in 1997. While a number of typhoons in the western North Pacific have been stronger, Patricia is now by far the strongest hurricane on record in any basin where the term "hurricane" applies to tropical cyclones – namely, the central and eastern North Pacific basins and the North Atlantic basin, which includes the North Atlantic Ocean itself plus the Gulf of Mexico and Caribbean Sea.
-

Spooky Season (October Disco Thread)
dryslot replied to Prismshine Productions's topic in New England
Yes and no................ -
I also wonder about that as the highest mountain on Jamaica is over 7,000 feet up! So, hopefully it won’t although it is likely that the enormous rainfall potential is the biggest threat, regardless. 12Z Icon: weaker with strongest being 992 mb near Haiti per WxBell.
-
Based on the last 11 years or so (back to when the SAI was first tracked in Jerry’s autumn Siberian snowcover threads), the SAI connection to a winter -AO hasn’t worked well at all. I remember that first Oct (maybe Oct of 2014) having a large SAI and getting many of us excited only to end up with a strong +AO winter. So, I don’t think that the SAI matters one way or the other these days. It used to correlate well, but not since it became famous. Maybe it was shy and couldn’t take the popularity.
- Today
-
59 / 38 partly cloudy. Looking dry till Sunday then deal with cutoff/ trough and coastal 10/28 - 11/3 period as discussed.
-
For those who track the Siberian snowcover advance in October; “SAI index” (I don’t because I think it doesn’t have a good track record at all), but here is the new update from Judah Cohen….lots of bad, false info going around X right now, mostly thanks to Mark Margavage, who just the other day said it’s advancing at an all time record level
-
Perfectly normal “behavior” for every IOD cycle, positive or negative. They peak in Northern Hemisphere fall (usually October) then start to rise/fall and neutralize in winter. This is the strongest negative event in over 17 years
-
As expected, severe drought has spread into central NC as far west as Wake county. Meanwhile a pocket of severe drought conditions have developed SE of Charlotte as well. Widespread rain looks possible next week and will be more than welcomed given the rapidly escalating drought conditions across the state. Some areas have seen under 2” of rain total since the second half of August
-
32 this morning after a forecast low of 38.
-
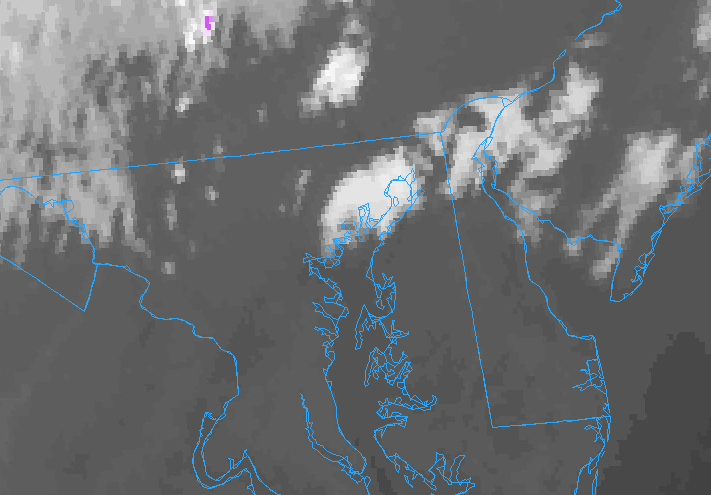
Oh, Nice catch! There was a band of clouds there pretty much all night, blocked the longwave radiation cooling. Likely also prevented a sturdier inversion from developing and calming the winds at the surface.
-
Can't be a rug pull if ya don't believe it from the beginning. Literally any model solution that shows a hit we have to throw it out. We know what the limitations of both the nina and the -PDO regime are, right? So like...why give a "good" model run showing something different the time of day? Better to just ignore it!
-

Spooky Season (October Disco Thread)
H2Otown_WX replied to Prismshine Productions's topic in New England
We just don't know how much wind, no one does -
I do not know how it could keep major status let alone hurricane status coming that close to Jamaica.
-
Can she be gone if she was never here?
-
Buckle up friend....gonna be a long winter of rug pulls
-
Poor Jamaica