All Activity
- Past hour
-
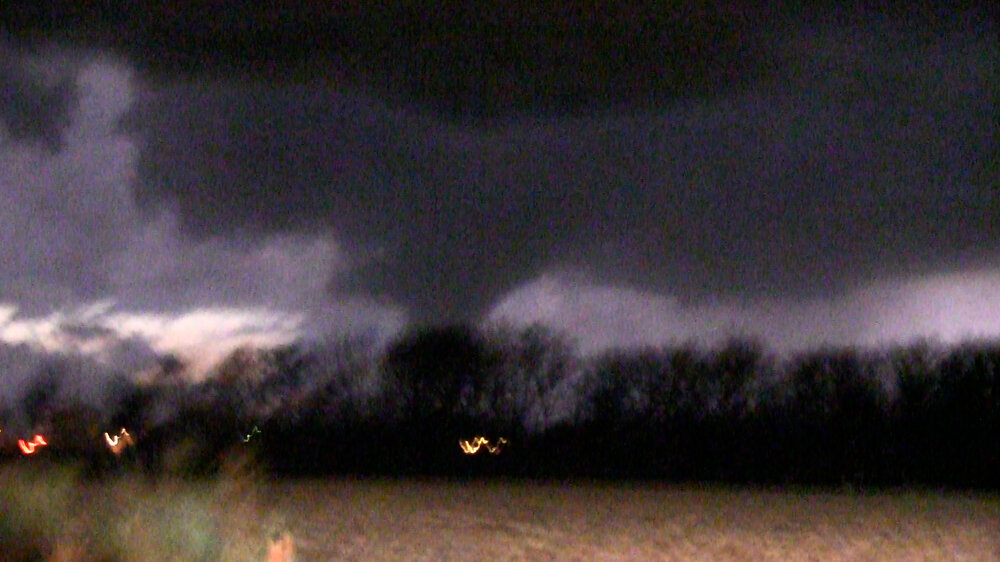
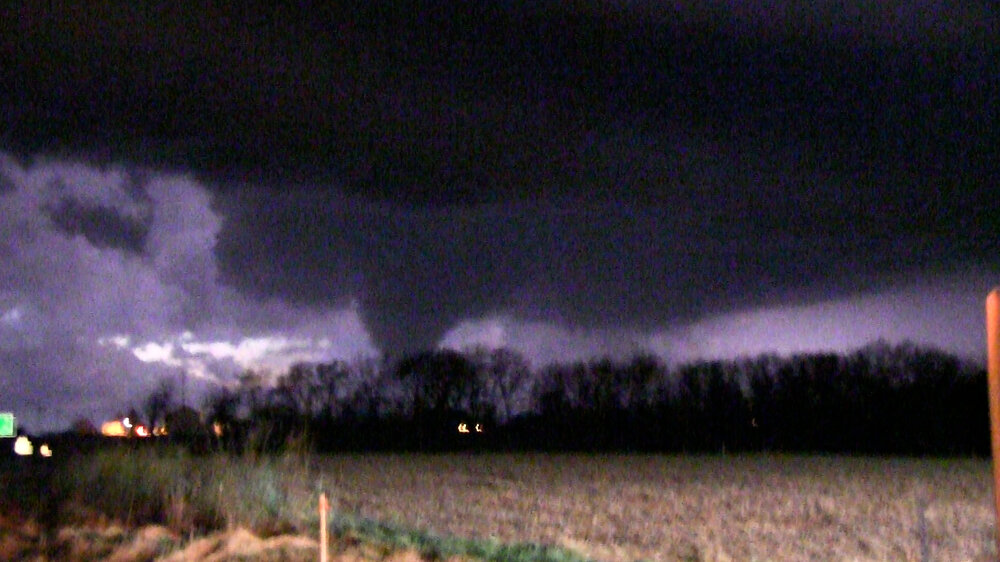
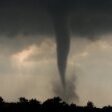
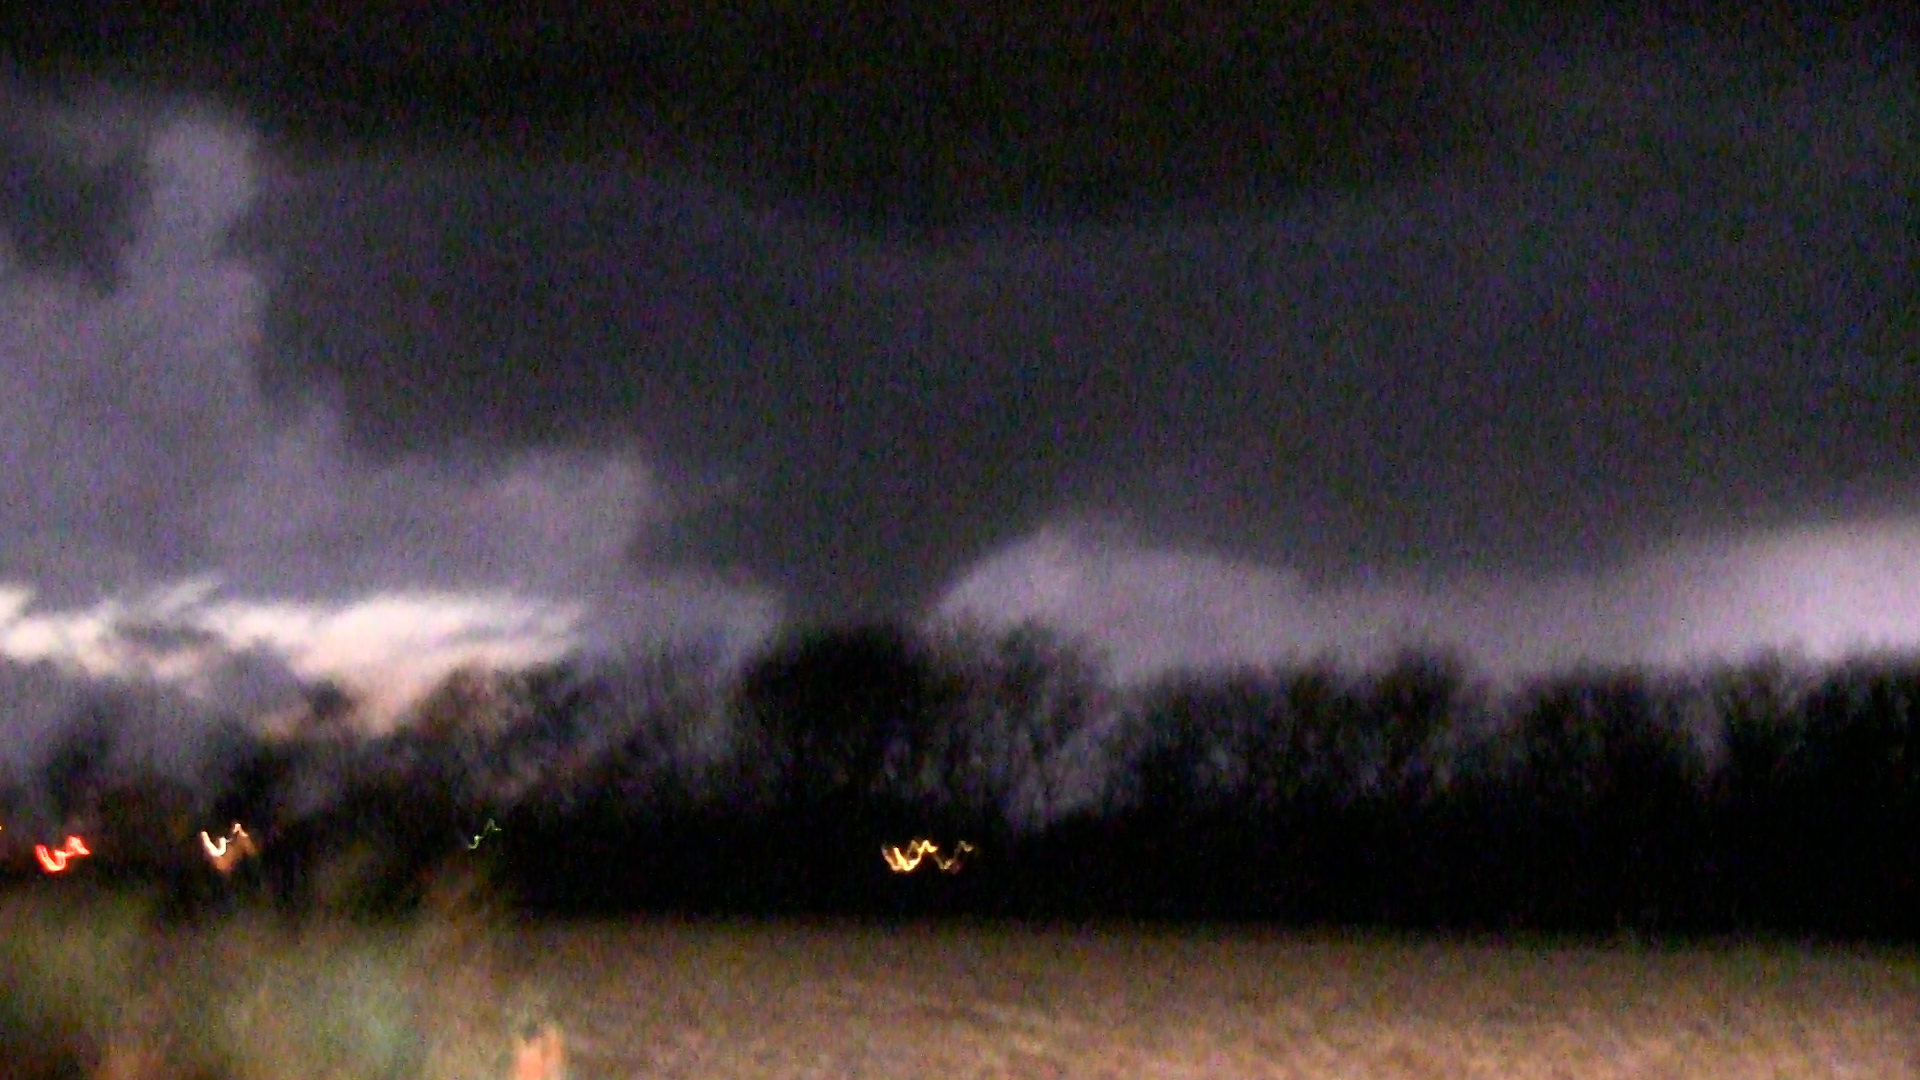
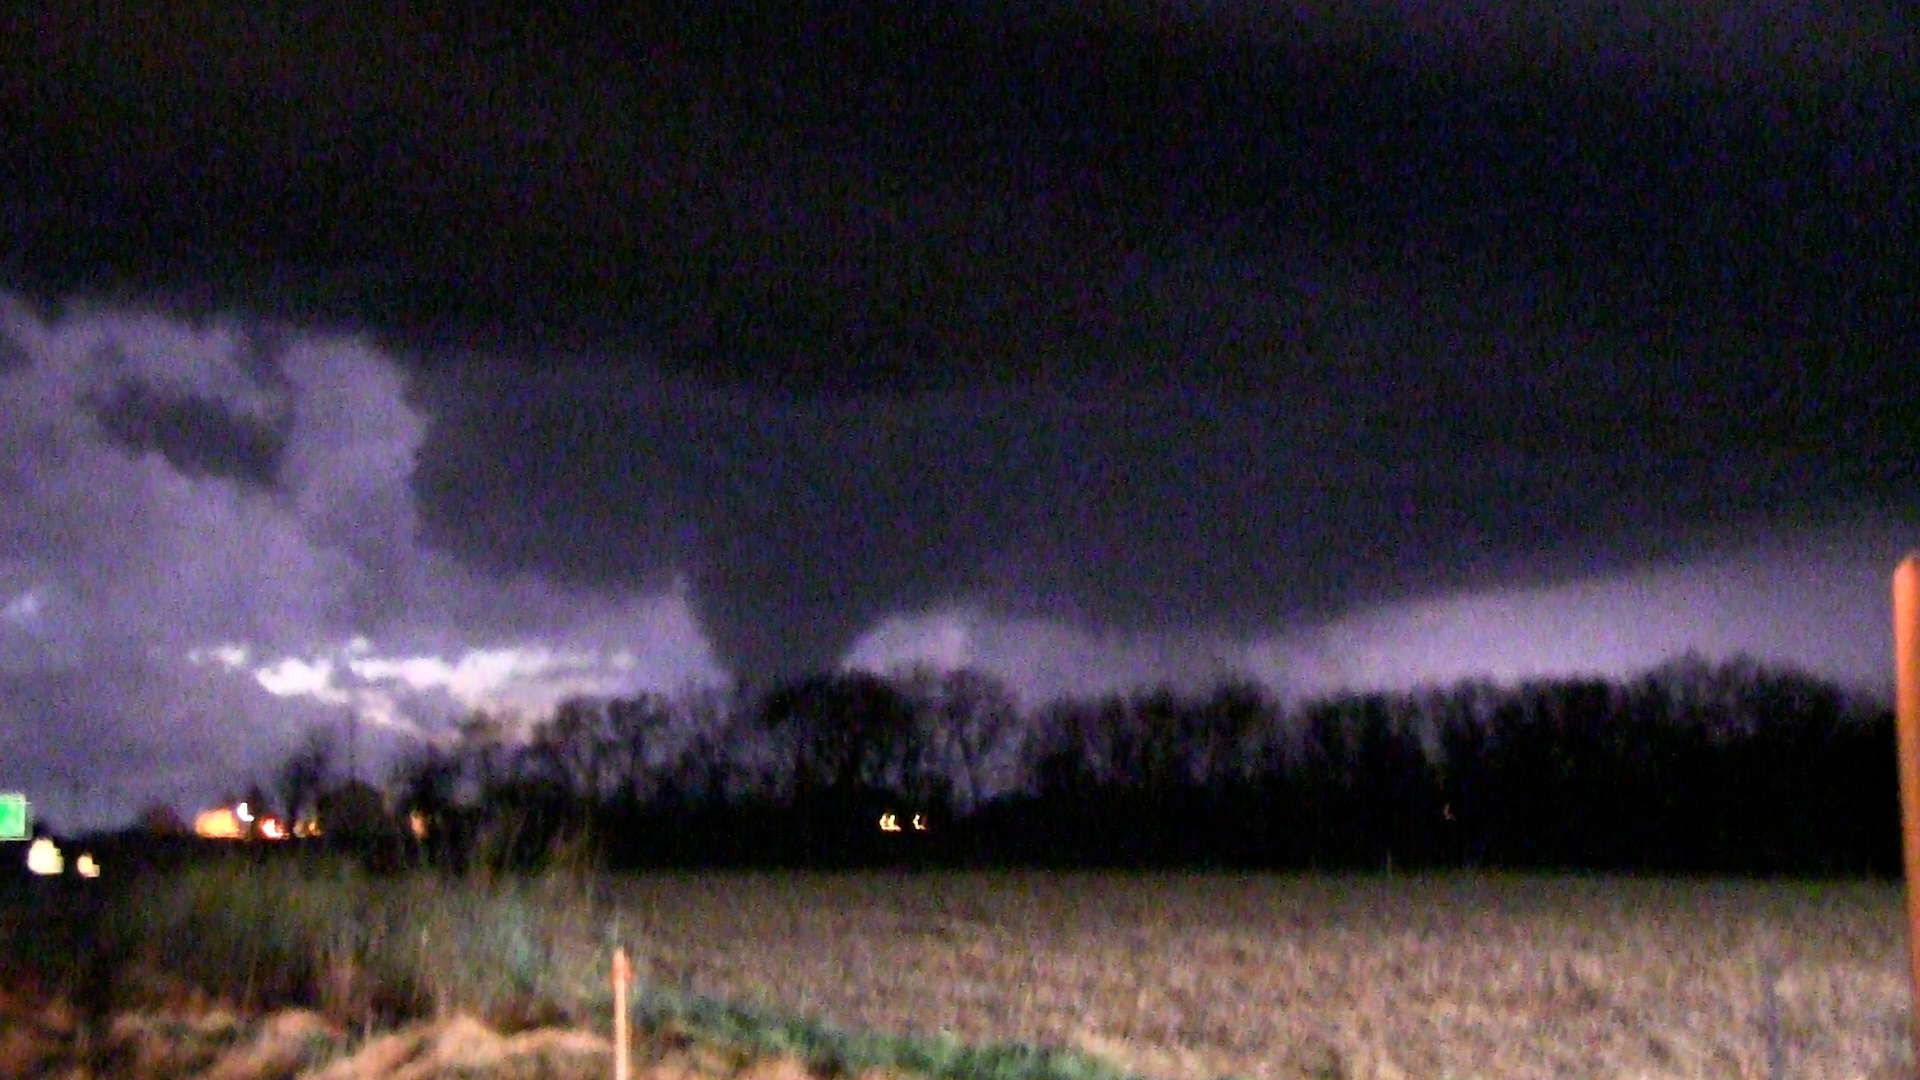
Great shot showing the dramatic carved-out updraft structure. Possibly would have gotten this one except my chase partner couldn't leave work in Madison until 4. We got a brief look at the Trivoli tornado from the west edge of Hanna City, which I believe was produced from the same storm or one that evolved out of it after a merger. We were not really expecting a tornado by that point in the chase as it had gotten dark and the storm had looked like junk on radar just minutes before, so we were rather spooked by the rapid turnaround and hightailed it out of there before we could get a better shot.
-

Roger Smith, who ran our seasonal forecast contests, passed away
Normandy Ho replied to GaWx's topic in Tropical Headquarters
Rest in power brother -
As far as I can tell, the 90F high temperature measured in Hancock today by the Mesonet was the highest temperature measured in Maryland for the date (03/22). The previous record was 88F (tied at multiple sites and dates). It's definitely not the March all-time though ; That record is 97F on 03/30/1998 in Downtown Baltimore.
-
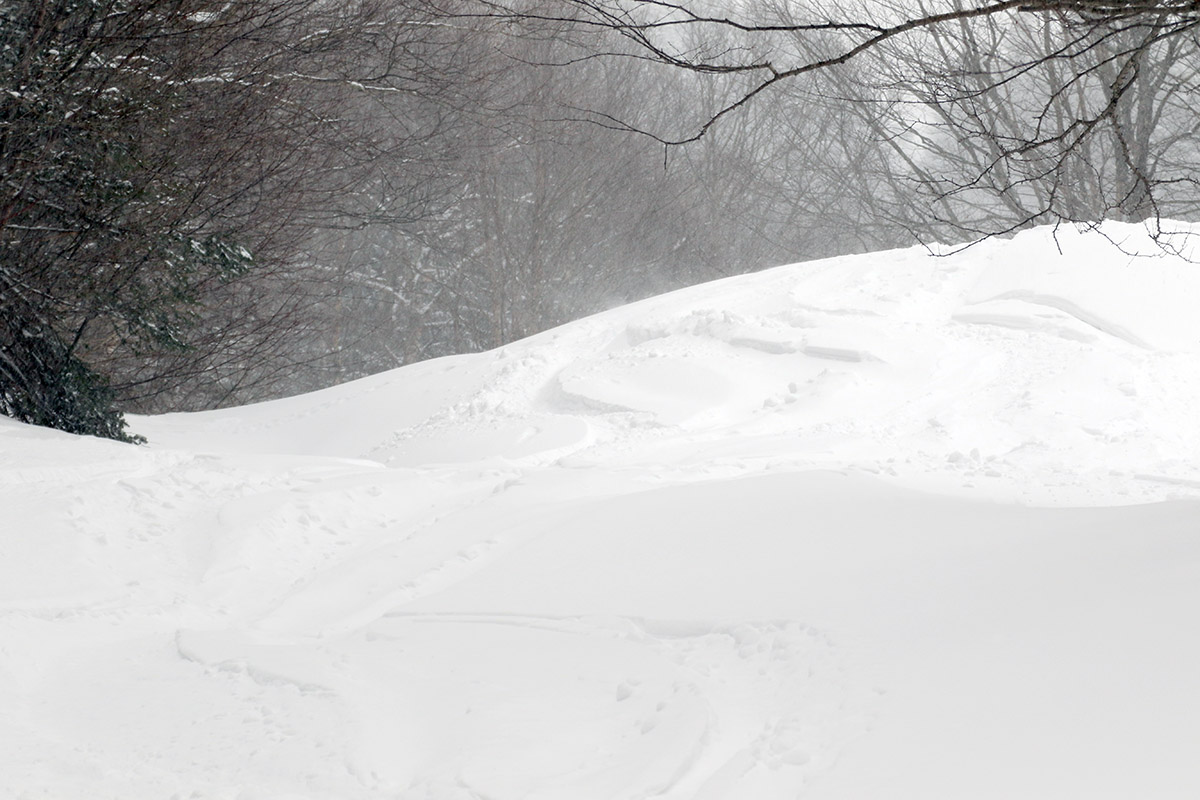
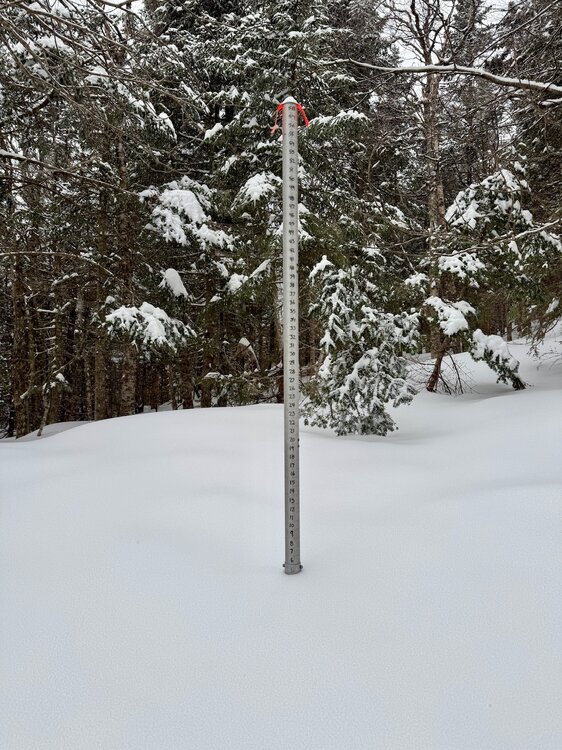
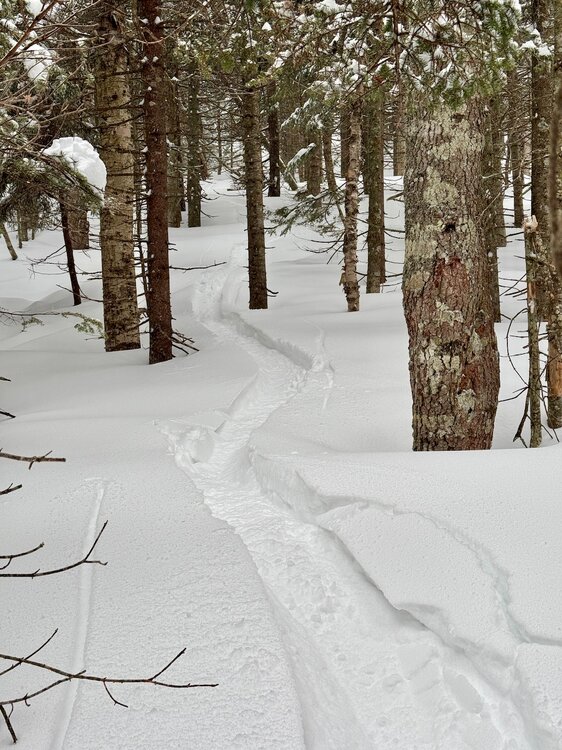
Wow, that is an impressive pack! Vermont mountains are way ahead of New Hampshire and Maine this year. I went through Crawford Notch this weekend and was not impressed by the amount of snow.
-
The pack was brutalized from the warm-up two weeks ago. Did some hiking and most of the lower elevation woods are 3”-6” with lots of bare ground, I didn’t ski this weekend, but went by Wildcat and Attitash and it didn’t look great. The 4”-6”today was definitely a much-needed refresher.
-
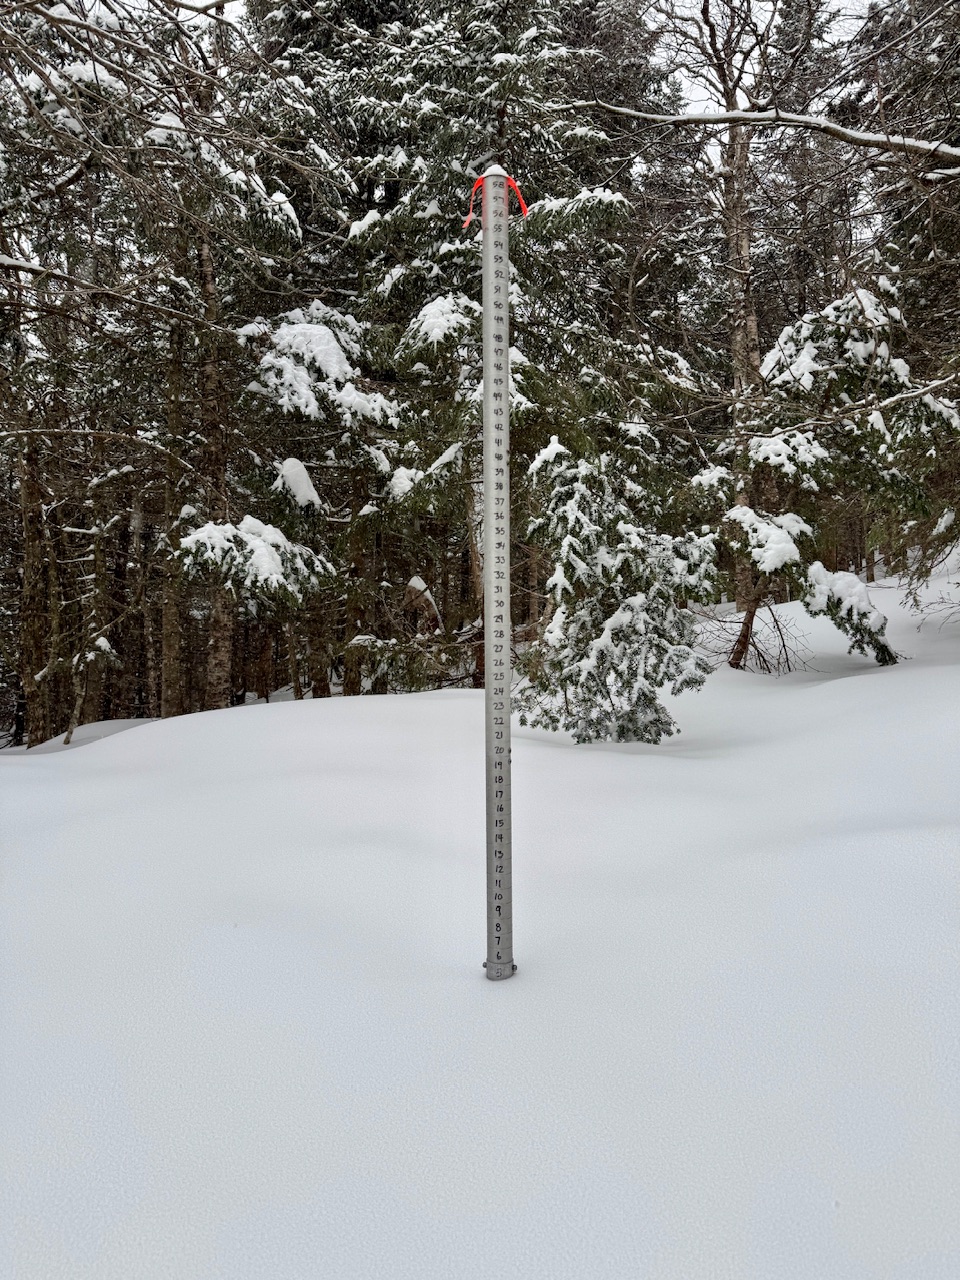
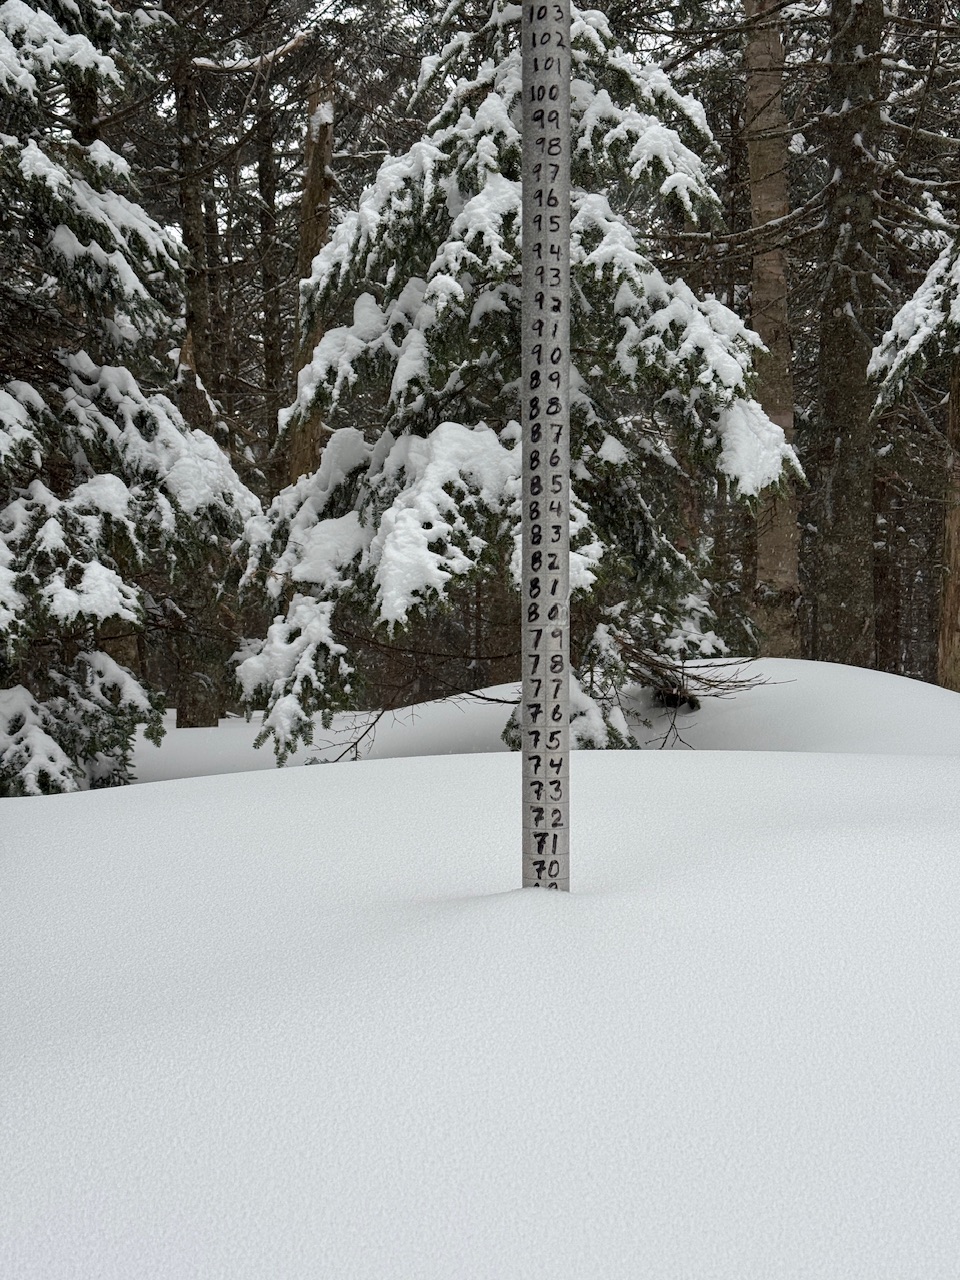
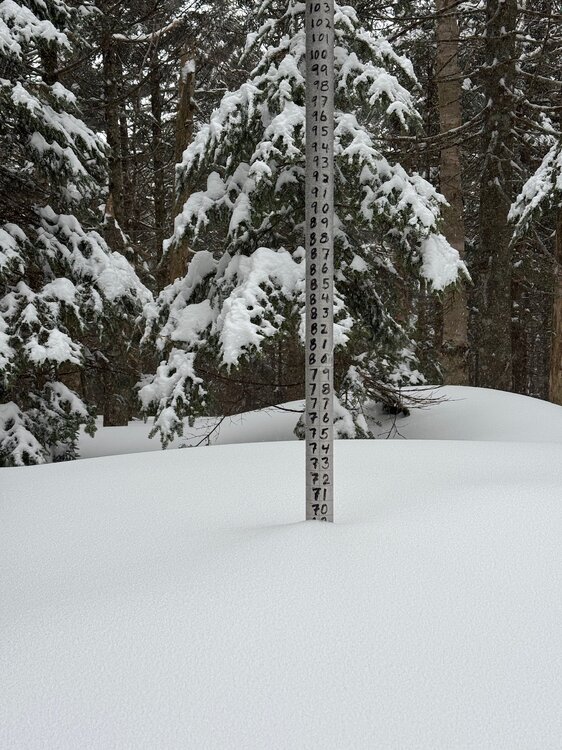
5” today… 70” depth… 288” measured season total. Cleared and reset for the next snowfall.

- Today
-
It's headed to +QBO territory by winter 26-27, that usually means less blocking and a stronger polar vortex.
-
what's the pack like up at Glen? Or even Wildcat if you went?
-
I never questioned the overall scope of the heat out west currently. Just details are important in the sciences. Such an event allowed an exercise in presenting such details in the form of limits and caveats of how we measure and record wx data, along w/ some ancillary practical information. That is a good thing.
-
E PA/NJ/DE Spring 2026 Obs/Discussion
Albedoman replied to PhiEaglesfan712's topic in Philadelphia Region
I agree, nothing burger. The air was just not unstable enough today. The northern areas need the rain too. At least there has been no wind issues- I so sick of picking up limbs in the yard -
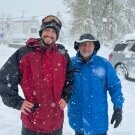
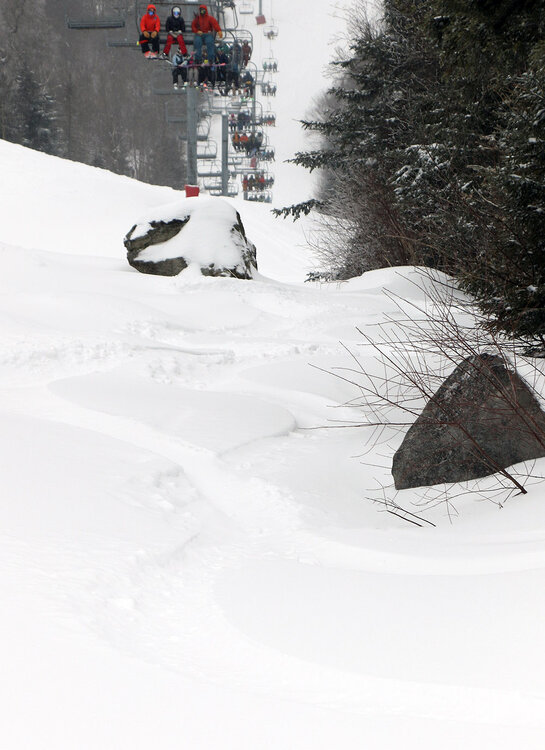
As CoastalWx might have said if he had this scenic view, "IT LOOKS VIOLENTLY BEAUTIFUL OUT THERE!!!" Never in 1000 years would have ever thought to pair the words "violently" and "beautiful" together!
-
Of course, I'd hope as a science board we all had this type of nuance and discretion. We see posters question observations all the time, ahem Coastalwx. There should be an understanding that we all can see the signs of stations running off the rails (MADIS analysis) on here. But the discussion started on the western heat, too. Regardless of what we think of instruments, extra sitings, etc... this has been a high-end heater out west. Even if certain sites may run warm, the 50,000 foot view of this is a high-end heater. Even if we chalk up and toss several sites for setting their April records to siting or instrumentation.
-
There was a beautiful snowy day in North Conway. Decided to drive back tonight because the roads were just wet pavement. The fog on Rt 9 in NH from Peterborough to Brattleboro was white knuckle insane! I’m going to drink a double IPA and go lay on the floor to decompress.
-
I’m roughly projecting that March 2026 at Phoenix will end up 12-13 F above normal. The current warmest of any month of the year is only 10-11 F AN.
-
54 my high
-

E PA/NJ/DE Spring 2026 Obs/Discussion
RedSky replied to PhiEaglesfan712's topic in Philadelphia Region
Garbage showers -
Thank you. Not trying to score points or be dogmatic, just presenting food for thought.
-
Unless those Ohio storms make it which models say no, that’s another nothing burger
-
Is +-2 F good enough? I would say not when you are calculating averages out to the 1/10 or 1/100 of a deg. Or when you are counting days reaching, say 90 or 100, when you have some fixed values as benchmark for a record. Recall the first 100 F at Tampa last year? And how the ASOS is sited at the turn point for taxiing jets? Here's where it gets more psychological than physical, but has real world impacts. We love numbers ending in 0 or 5, and powers of 10?, forget it! So when Tampa hit 100 F for the first time, it was treated like the second coming for news. Really? 99 vs. 100?, that's not a big deal, but we make it a make deal. As a result this skews perception about things like heat and warming more than it should. It can put it this way, if Tampa hit 99 instead of 98 this day, it would have been nothing for news. So minor things are not always so minor as to their effects.
-
Top out 74.3. Not near any water.
-
Gorgeous here at Sunday River about 8 down light snow
-

Occasional Thoughts on Climate Change
donsutherland1 replied to donsutherland1's topic in Climate Change
I didn't say "never" in the Earth's history. Almost certainly there were comparable or even more severe heatwaves during the mid-Pliocene, Eocene Thermal Maximum, etc. I stated, that the current March heatwave "is the most severe heatwave Phoenix has experienced in the period where records exist (even prior to the daily period of record that begins in August 1895) during March." It is. There's no credible information to suggest otherwise. -
Great info.
-
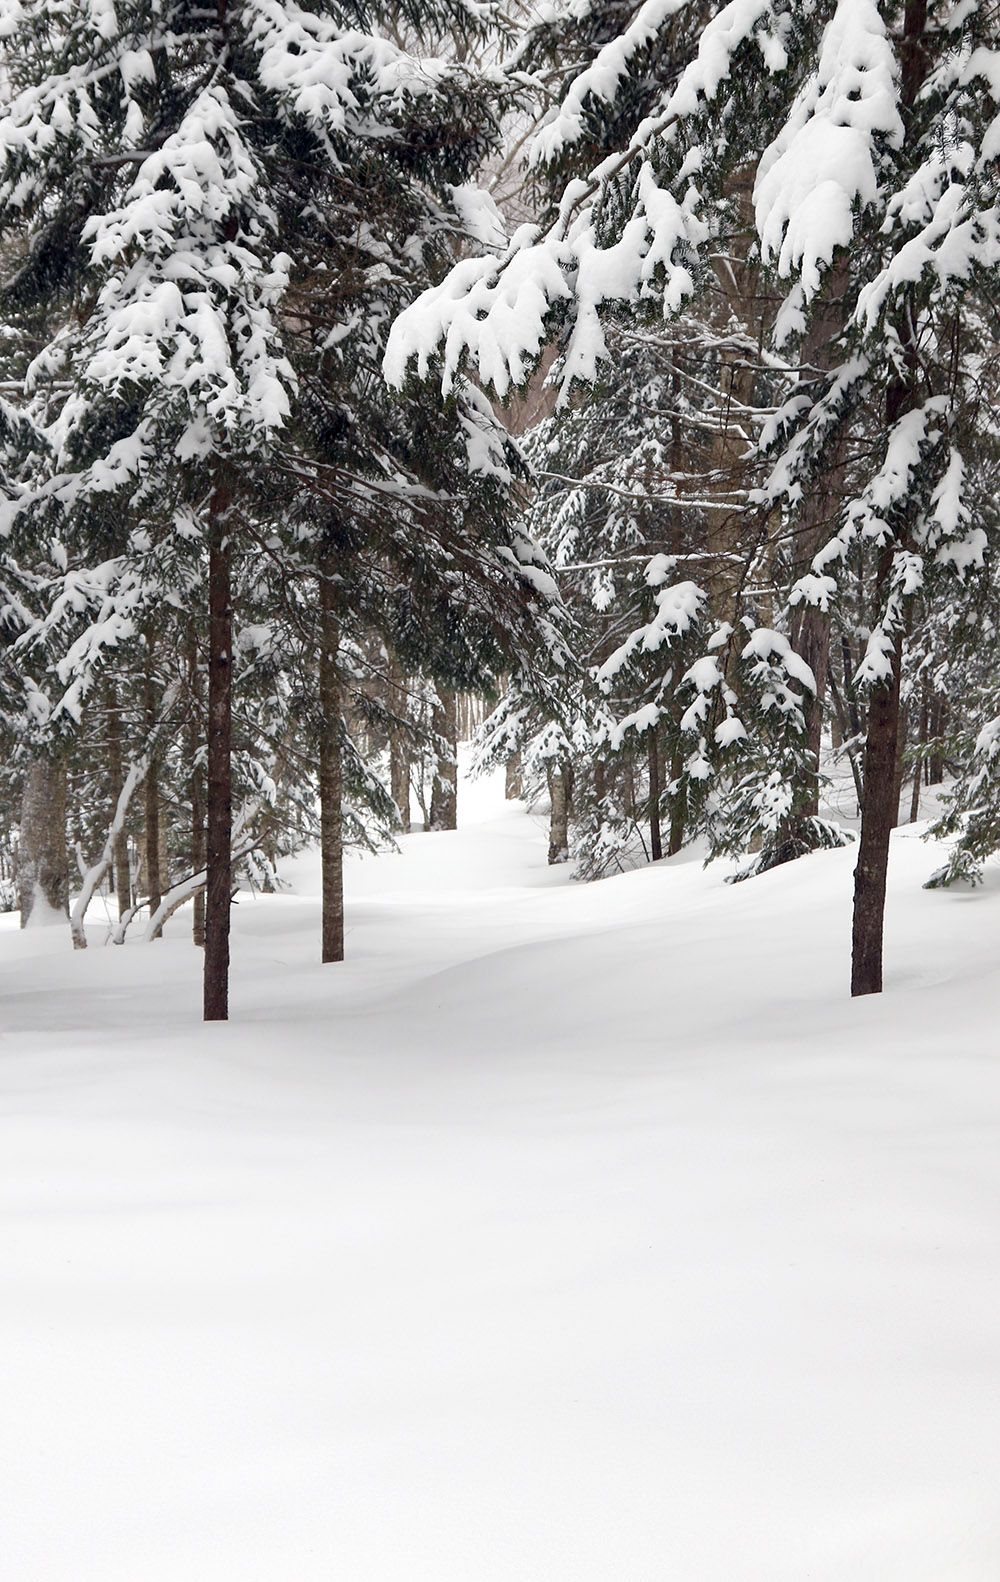
Our next winter system in the current series moved into the area overnight, and by early this morning we’d picked up another couple of inches of snow in the valley. The mountains had picked up a few inches of new snow as well, and since it was expected to continue throughout the day, I was a bit torn on whether to head right up for a ski session in the morning or wait for later in the day when there might be more accumulation. I decided that early morning was the better option, and I’d say that was probably the right call because we started to get into more mixed precipitation as we approached midday. For convenience, I parked at the Timberline Base, but my real goal for the morning was to head right over to the Vista Quad and get up to the Vista Summit – the Vista Quad hasn’t really run since Thursday due to wind/mechanical issues. That meant that all the snow from these recent systems has been siting there without any skier traffic. Based on yesterday’s conditions, I brought out the alpine boards today; I wanted the extra stability to easily handle that hard layer of subsurface snow where the new snow hadn’t bonded well, or, if it turned out that there was enough new snow to start diving into the really steep terrain, I’d want to have the alpine boards for those adventures anyway. Thankfully, the latter of those two situations applied, and it was game on for a lot of very steep terrain. With the fresh opening today of the Vista Quad, the Vista Summit was definitely the place to be – my measurements typically revealed 10-12” of dense powder anywhere that hadn't seen skier traffic. Down in the valley we’ve had over an inch of liquid equivalent in the snow we’ve seen from these past couple of systems, so the mountains must be in the range of at least 1 to 1½ inches of liquid at this point, and that’s generally enough to get into resurfacing high-angle terrain. The snow that’s out there is dense and surfy, and I was typically getting bottomless powder turns on both single black and double black pitches like those in the Hard Luck, Vermont 200, and TNT area. The caveat to that was that vegetation mattered – in the trees, and especially evergreen areas, enough of the new snow was captured on branches that the lower depths on the ground were obvious. The open trails were the place to be, since all that new dense powder was just sitting there. When I was wrapping up my session and heading back to Timberline, the conditions were so good even in the lower elevations that I hung around there for a couple of extra runs. Even below 2,000’ I was finding 9-10” of that same dense powder in areas that had not yet seen any skier traffic. A testament to just how good all this dense snow has been with respect to resurfacing slopes is that fact that patrol was reopening trails all over the place on Timberline – even the steepest pitches like the Tattle Tale Headwall were skiing well. Like yesterday, groomed terrain was skiing very well with over an inch of new liquid equivalent tilled in because of the new snow. The weather today wasn’t quite as friendly as it was yesterday; today there were some periods of wind, and at times heavy snowfall and blowing snow. The early morning snowfall was generally regular flakes, but those became mixed with grainy flakes as the morning wore on, so your goggles were definitely needed. As PF mentioned, there was also a bit of freezing mist at times, so you had to keep that from obscuring your goggles. Relatively speaking, the freezing mist wasn’t too heavy though, and I only cleaned it off my goggles once when I stopped in at the Timberline Base for a late morning break. None of the precipitation seemed to hamper the snow surfaces, and thankfully the dense snow and grainy flakes only continued to help deepen the powder. In term of visitors, it was a surprisingly quite day on the mountain for a weekend storm day (not to mention the fresh opening of the Vista Quad). Perhaps the questionable weather kept a lot of people away. All the lifts were basically walk on, and it was especially quiet at Timberline – there were often several empty chairs between people when I was there around midday. That could be a bit of the late March slowdown taking place as people start to get busy with other things, but as I’ve often seen this season, there were a good number of Indy Pass holders making use of their two free days at Bolton Valley. That’s probably a good way to manage your passes though: use March and April to hit up some of those northern resorts that are still getting good snowstorms.


-
These are great questions. No. they are not all wrong, but when we are talking avg temps out to the tenth or hundredth of deg in long-term climate, what is a minor error for a daily temp, becomes major monthly and longer. It's not a big deal daily if a sensor runs 0.5 F too warm, but that shows up once you get to monthly, and that 0.5 F become more significant as you avg over longer and longer periods. There are a couple of hard facts that indicate warm bias. 1) Urbanization and the location of climate sites is a significant issue and growing larger w/ time. Many climate sites are located in and near urban areas, and this means warmer locally/mesoscale practically by default. But only about 2% of the world is urbanized, so how can this be an good representation of avg global temp when so many climate sites are located near and in this 2%? 2) Even w/o urbanization, having infrastructure nearby (like at airports) can and do bias warmer b/c so much of our infrastructure gives off or retains heat. Things like paved areas, concrete/metal structures, solar panels, jet exhaust, AC units, etc. they are all extra heat sources. How many artificial cold sources are there overall comparatively? Not much. 3) Digital thermometers have largely replaced glass thermometers, and record a continuous record of temps. They more sensitive to passing artificial external heat sources. So instantaneous spikes are recorded more. If one does avg temp, say hourly, to get value for a day, this error is washed out, but that's not done a lot. Absolute max and min for a day are used to get an avg temp. Yes, sensor calibration can run cold, but this seems largely masked by items 1 and 2 above, I mean, how often do we see or notice, "that sensor is running cold."? I don't know about studies comparing mesonet to ASOS/AWOS, but look at siting of most mesonet sites, they are more remote and placed better. That means less artificial heat contamination. Another items to consider for records, we have far more wx stations now, and they increase all the time. So certain wx records, such a state's highest temp or max 24 hr precip, as two examples, are more likely to be detected and go into the record. This gives the perception that things are more intense or worse, when technology has merely allowed us to see better what has always been there or can happen due to more data recording points. How our observation network changes and the technology associated w/ it over time are factors, just another caveat about comparing wx/climate over long periods of time. This doesn't discount warming trends overall, both from natural variability and added CO2., but it is not wrong to be skeptical and ask questions about methods and networks as to how we record and process wx data. And there are many ways to do this w/ data, all have their pluses and minuses, and can be manipulated to produce desired results. Not necessarily wrong, but calculated in a way that isn't what it seems, or have practical/noticeable/meaningful effects, such as being statistically significant. I recommended this book: https://en.wikipedia.org/wiki/How_to_Lie_with_Statistics

.thumb.png.4150b06c63a21f61052e47a612bf1818.png)