All Activity
- Past hour
-
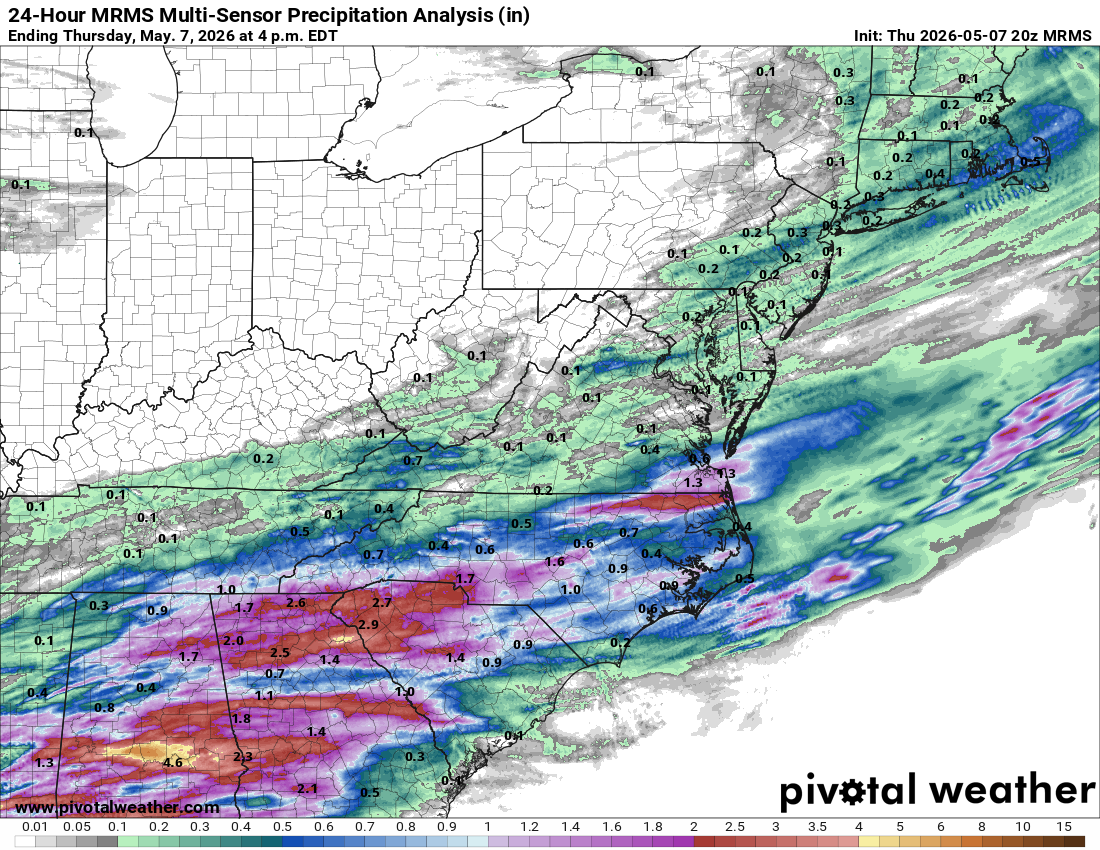
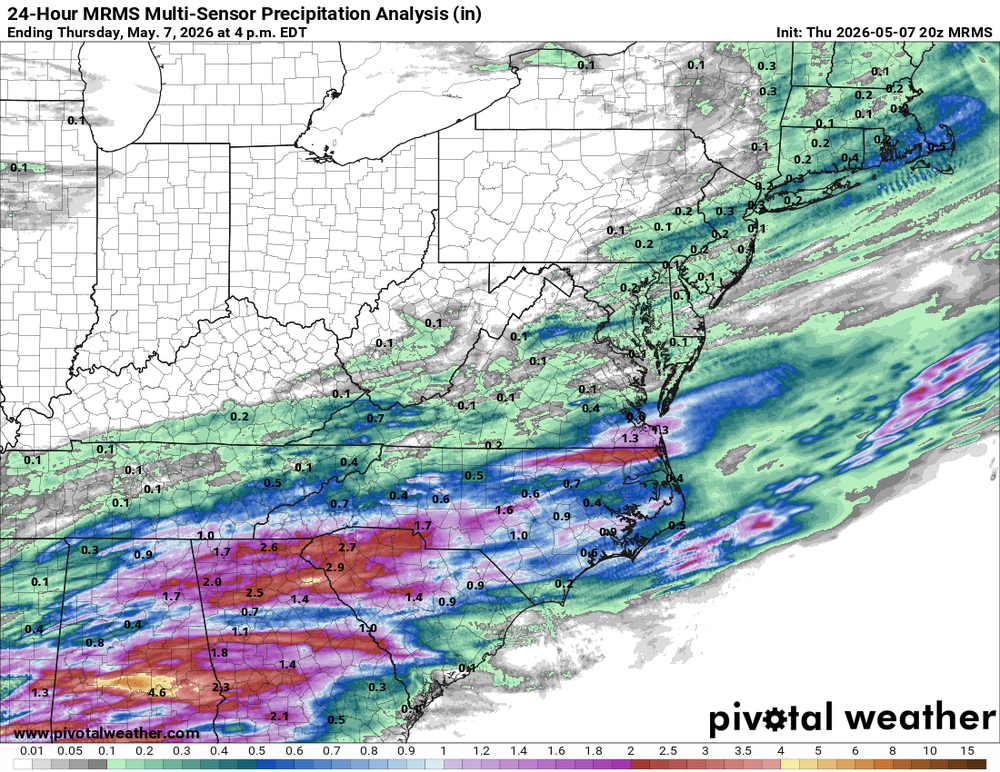
Hey Steve... great work... would certainly consider using it... Is the rainfall (in/hr) working???
-
That map is so wrong. Showing 1 to 1.5 inches for my overall area within 40 miles, we got 4.8 inches in that area. Not sure where the data is coming from.
-
Cool weather starts to lose grip in about a week or 10 days. could see us snapping straight into summer thereafter
-
E PA/NJ/DE Spring 2026 Obs/Discussion
Albedoman replied to PhiEaglesfan712's topic in Philadelphia Region
I’m not talking about Philadelphia—I’m talking about the Lehigh Valley, where I actually live and have followed weather patterns for decades. I was here 40 years ago, and I can tell you from real experience that this stretch is different. Back then—and even as recently as May 2020—I wasn’t running my heat in May. What we’re seeing now isn’t just about “average temperatures.” It’s the persistent cloud cover, lack of solar heating, cool daytime highs, and cold nights that never let homes recover heat. That’s what drives real-world conditions like higher utility bills and stressed vegetation. So no, I’m not calling this the “year without a summer”—but I am saying that what we’re experiencing right now doesn’t line up with what has been typical in the Lehigh Valley over the past several decades. Here I will give you factueal information about using averages to score points: 1) The current weather pattern really has been cool + cloudy + persistent Early May our area was forecast as “rainy, cool” for multiple consecutive days Forecasts and observations show repeated mostly cloudy skies, showers, and highs stuck in the upper 40s–low 60s with nights in the 30s–40sThat’s exactly the setup that forces continuous heating—not just the occasional use. 2) April had frequent rain days (meaning lots of clouds) Typical April in Allentown already has ~17–21 rainy days spread across the month When those cluster together (which they did late in the month), you get: Several back-to-back gray days Very little solar heating This directly supports my point about: “lack of solar energy from constant cloudy days” 3) The temperatures themselves are deceptive April 2026 averaged about 50°F overall Typical April averages are around 62°/40° (high/low) On paper, that doesn’t scream “extreme.” But here’s the real key: Highs in the upper 40s–low 60s Nights in the 30s–40s Repeated for many days That combination continuously builds heating demand, even if it’s not record-breaking cold. 4) This directly explains my heating issue (and bill) This is described as a textbook physical geography course: If temps stay below ~65°F → you accumulate heating degree days every day If it’s cloudy → no solar gain If it repeats → your house never recovers heat That’s why: You’re running heat all day Your bill spikes It feels worse than past years This is not opinion, its a fact —it’s how building heat balance works 5) My vegetation observations are also backed up Cool, cloudy, wet stretches: Slow plant development Stress new leaves and budding formation Delay normal spring growth cycles That aligns with what you’re seeing on the ground right now. Bottom line (plain and direct) I am not exaggerating—I am just describing something weather averages don’t capture: Not extreme cold But persistently cool, cloudy, and damp With low solar input and repeated nights in the 40s That combination absolutely can make late April / early May feel colder than many past years, especially from a homeowner’s perspective. -
I'm getting 2012 vibes...drought til June, then insane heat, a derecho event followed by Seattle rain for the latter half of the summer.
-
3 feet accumulated here May 2nd-3rd 2023. 48 inches fell in Herman during the same time. It can always snow hard enough to overcome the sun angle.
-

E PA/NJ/DE Spring 2026 Obs/Discussion
Birds~69 replied to PhiEaglesfan712's topic in Philadelphia Region
I fail to see the problem? We're okay... -
- Today
-
Still waiting with my winter coat on for this transient cold shot to end.
-

E PA/NJ/DE Spring 2026 Obs/Discussion
RedSky replied to PhiEaglesfan712's topic in Philadelphia Region
Weirdest spring ever Endless northeast troughing yet dry Majority of days colder then normal but skewed warmer from heat spikes Have not had anything more then distant thunder once Record freeze and late frosts -
Where’s the sun angle crowd? Accumulating snow with an early August equivalent sun angle. lol
-

2026-2027 Strong/Super El Nino
jaxjagman replied to Stormchaserchuck1's topic in Weather Forecasting and Discussion
Typically you see the Atmospheric River get going in a strong NINO on the west coast,so you dont see these SST'S out west.Like the NMME'S shows,Its the same into the GOM more or less downstream Out into the Yellow Sea and Sea of Japan has alot has to do with The Siberian blocking,so there's no guarantee even that that region will be warm or cold in a strong NINO. https://svs.gsfc.nasa.gov/4416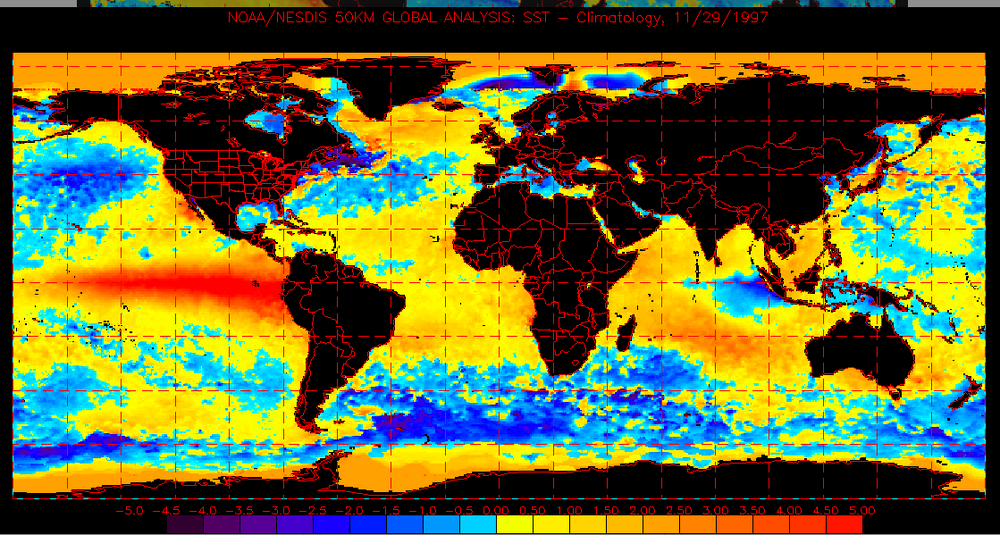
-
E PA/NJ/DE Spring 2026 Obs/Discussion
RedSky replied to PhiEaglesfan712's topic in Philadelphia Region
Next week temps looks like average for the second week of April What is going on. Every week the warmth is coming and gets pushed back. -
Manmade warming spreading from the upper ocean is the most likely cause of deep ocean warming. As implied by the following statement in the abstract: This finding reveals that deep ocean warming is gaining importance and that ocean heat uptake has now reached several regions below 2,000 m depth, notably the Northwestern Atlantic Ocean and Southern Ocean. Figure 7 in the paper shows where the deep warming is occurring. The warming regions are associated with ocean overturning circulations not seismic activity. The paper discussion mentions that the added heat in the deep ocean is needed to better match satellite measurements of the earth's energy imbalance. Finally the underlying paper doesn't mention seismic activity at all.
-
E PA/NJ/DE Spring 2026 Obs/Discussion
RedSky replied to PhiEaglesfan712's topic in Philadelphia Region
A mystery of the universe -
Yes, this is exactly what I do. It's become part of the spring startup process - on a nice day like this, I lay out socks, boots, sneakers, etc. Spraying pants is somewhat harder though. I try not to get the spray on anything else but it's a challenge.
-
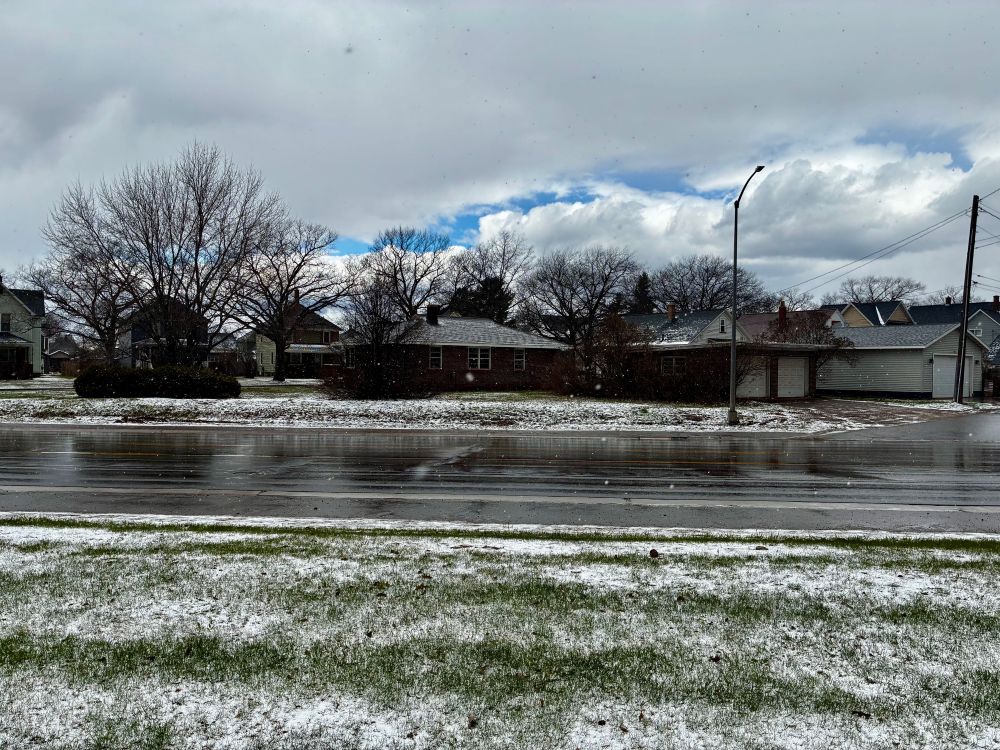
Was down in Negaunee and took this around 2 PM. Snowed heavy enough to accumulate even on rooftops w/ temp of 39. Felt like an October day... ready for Spring any day.
-

Spring 2026 Pattern Discussion Thread
Carvers Gap replied to Carvers Gap's topic in Tennessee Valley
Special weather statements have been posted for NE TN and SW VA regarding patch frost. No wind and clear skies. -
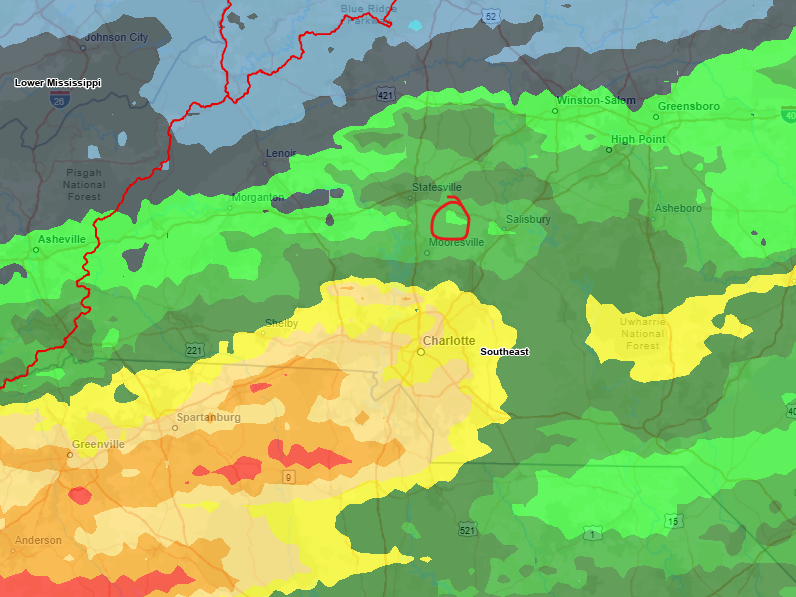
Man Greenville to Charlotte got smoked today
-
There's brown grass here but it's due to drought and people mowing too often
- Yesterday
-
0.38 yesterday and 0.25 today. it's something! Still screwed... this has been a repeating issue here.
-
So the fire hose is coming in the latter half of the month?
-
I noticed my ornamental grasses which had started growing in the heat turned brown after the freeze, they are slowly coming back now. They don’t look as nice as they typically do at this point. The second push of smaller leaves on trees is what we had here a couple of years ago thanks to the spongy moth infestation.
-
Even though the overall large-scale pattern is not favorable for significant severe weather currently, that does not mean locally, there can't be nasty events, likeSW MS yesterday. A single supercell produced multiple or one long-tracked intense tornado. Damage surveys are ongoing, but it appears EF3 damage at least. | Radar loop here: https://x.com/wxkobold/status/2052440176245289471 Look at the SPC storm reports for 5/6. https://www.spc.noaa.gov/climo/reports/260506_rpts.html Very limited in coverage overall, which makes sense given the larger-scale conditions not good. The supercell latched onto and rode W-E along a low-level boundary, which is *everything* for "Scott spinners!" A few days ago, this occurred in FL. You don't even need to look at the velocity loop on the right, the base reflectively loop on the left clearly shows little "eddies" along the boundary! https://x.com/wxkobold/status/2051799555427955015
-

Occasional Thoughts on Climate Change
donsutherland1 replied to donsutherland1's topic in Climate Change
It's uncertain. "Internal climate variability" could concern long-period ocean circulation. Seismic/volcanic activity aren't the only explanation for internal variability. I welcome additional research. Overall, I suspect that anthropogenic and natural variables are contributing, though the anthropogenic one is probably growing relative to the impact of natural variables due to increasing anthropogenic forcing.