All Activity
- Past hour
-
Thank you. I made it.
-
This summer so far really hasn’t been that rainy compared to the past. Only a few areas in the interior have had 10” this month. Notice how far down in the rankings we are for wet summers at the major stations like NYC and ISP which missed the heaviest rains this month. Time Series Summary for NY CITY CENTRAL PARK, NY - Jun through Aug Wettest Summers Click column heading to sort ascending, click again to sort descending. 1 2011 25.23 0 2 2021 24.03 0 3 1975 22.40 0 4 1989 22.36 0 5 2009 21.38 0 6 2006 20.79 0 7 2007 20.62 0 8 1928 20.50 0 9 1903 20.43 0 10 1927 20.01 0 11 2003 19.87 0 12 1942 19.82 0 13 2018 19.15 0 14 1971 18.88 0 15 1889 18.55 0 16 1990 18.37 0 17 1871 18.22 0 18 1919 18.16 0 19 1884 17.62 0 20 1967 17.57 0 21 1922 17.23 0 22 1937 17.22 0 23 1911 17.11 0 24 1872 17.05 0 25 1938 16.87 0 26 1887 16.64 0 27 1875 16.55 0 28 1902 16.37 0 29 1960 16.29 0 30 1897 16.28 0 31 2000 15.97 0 32 1991 15.86 0 33 2013 15.79 0 34 1972 15.76 0 35 1904 15.75 0 36 1878 15.67 0 37 1873 15.45 0 38 1926 15.37 0 39 1933 15.24 0 40 1901 15.19 0 41 1946 15.16 0 42 1920 15.13 0 43 2019 14.93 0 - 1880 14.93 0 44 1941 14.76 0 45 1879 14.68 0 46 1896 14.66 0 47 1984 14.17 0 48 1915 14.12 0 49 1955 13.89 0 50 1930 13.85 0 51 1909 13.69 0 52 2004 13.68 0 53 1890 13.53 0 54 2023 13.52 0 - 1973 13.52 0 55 1997 13.50 0 56 1983 13.48 0 57 1994 13.40 0 58 2020 13.37 0 59 1996 13.34 0 60 2008 13.12 0 61 1969 13.06 0 62 1948 13.02 0 63 1987 12.95 0 64 2024 12.93 0 - 1959 12.93 0 65 1982 12.92 0 66 1992 12.75 0 67 1893 12.44 0 68 2017 12.29 0 69 2014 12.10 0 70 1945 11.92 0 71 1888 11.79 0 72 1978 11.67 0 73 1986 11.66 0 - 1968 11.66 0 74 1905 11.63 0 75 1988 11.62 0 76 2016 11.59 0 - 1952 11.59 0 77 1985 11.40 0 - 1918 11.40 0 78 1950 11.39 0 79 1877 11.30 0 80 1895 11.17 0 81 2015 11.12 0 82 1962 11.11 0 83 1925 11.09 0 84 1908 11.08 0 85 1961 10.91 0 86 2005 10.73 0 87 1976 10.72 0 88 1934 10.69 0 89 1935 10.64 0 90 1974 10.61 0 91 1885 10.58 0 92 1936 10.50 0 93 2002 10.44 0 - 1940 10.44 0 94 1913 10.42 0 95 1917 10.40 0 96 1931 10.39 0 97 1874 10.27 0 98 1980 10.26 0 99 1892 10.15 0 100 1899 10.14 0 101 2012 10.09 0 102 1914 10.07 0 103 1977 10.00 0 104 1900 9.93 0 - 1891 9.93 0 105 2001 9.89 0 106 1998 9.81 0 107 1916 9.65 0 - 1870 9.65 0 108 1939 9.62 0 109 1981 9.51 0 - 1924 9.51 0 110 1921 9.38 0 111 1869 9.36 0 112 1943 9.35 0 113 2022 9.18 0 114 1951 9.17 0 115 1898 9.13 0 116 1932 8.98 0 117 2010 8.94 0 118 2025 8.70 0 119 1956 8.68 0 120 1993 8.60 0 121 1958 8.59 0 - 1876 8.59 0 122 1947 8.56 0 123 1949 8.52 0 124 1995 8.40 0 125 1954 8.37 0 126 1883 8.35 0 127 2026 8.28 31 Time Series Summary for ISLIP-LI MACARTHUR AP, NY - Jun through Aug Wettest Summers Click column heading to sort ascending, click again to sort descending. 1 1990 22.31 0 2 1989 20.44 0 3 2014 18.82 0 4 2012 18.54 0 5 1992 17.71 0 6 2011 17.02 0 7 2003 16.60 0 8 2006 16.51 0 9 1967 15.64 0 10 2009 14.91 0 11 2000 14.49 0 12 1998 14.26 0 13 2023 14.18 0 14 1982 14.14 0 15 1984 13.97 0 16 1976 13.87 0 17 1969 13.76 0 18 1985 13.57 0 19 2021 13.35 0 20 1996 13.24 0 21 2013 13.21 0 22 2018 12.94 0 23 1991 12.71 0 24 1975 12.54 0 25 2007 12.33 0 26 2024 11.49 0 27 1977 10.85 0 28 1983 10.83 0 29 1979 10.66 0 30 2019 10.64 0 - 2001 10.64 0 31 1997 10.39 0 32 2008 10.04 0 33 2020 9.96 0 34 1973 9.94 0 35 2002 9.93 0 36 1986 9.82 0 37 2017 9.41 0 38 1978 9.33 1 39 1972 9.25 0 40 1971 9.06 0 41 1987 8.89 0 42 1970 8.72 0 43 2004 8.71 0 44 1981 8.67 0 45 1994 8.53 0 46 1968 8.49 0 47 2026 8.43 31
-
He’s been a reliable (and cheap) fifth starter for several years. Will occasionally throw a gem, occasionally a major clunker. He’s been pretty rough lately though.
-
Not sure i love getting anything from the Orioles but maybe this Kremer dude can be salvageable...my guess is no but hey my Twins are at least looking
-

2026-2027 Super El Nino
bluewave replied to Stormchaserchuck1's topic in Weather Forecasting and Discussion
That will be the test going forward. We will have to see how things evolve in the coming months. Since the seasonal models missed this summer pattern. So the seasonal models may even have lower skill than they traditionally have had beyond the one month forecast period. This summer is featuring a weaker Aleutian low than usual for a developing super El Niño and a much stronger mid-latitude ridge across the Pacific and the CONUS. So if this continues into the winter , then it could mean the traditional super El Niño ridge gets displaced further south and perhaps east into the CONUS than usual. Since a -PDO atmospheric state even overlapping at 10%-20% relative to the winter super El Niño forcing could lead to shifts. This would have implications on the warmth and possibly where the heaviest precipitation zones set up. The mid-latitude ridges being stronger than the troughs has been the main feature of our winters and other seasons since the 2015-2016 super El Niño. -
The dog days of summer. Starting with a Saturday soaking for many of us.
-
 Sildenafil 100mg price: MedMenNews - Viagra Tablet price
 -

2026-2027 Super El Nino
mitchnick replied to Stormchaserchuck1's topic in Weather Forecasting and Discussion
Well, I'm happy with the new Cansips. Still too cool up north I suspect, but the precip anomalies are great if you like coastal and temps are more than workable for many I would say. And fwiw, the end of the run is cooling waters around Japan dramatically and warming the NE Pacific. End of -PDO maybe, or at least working on it? Definitely working to build a Niña at the end though. 500mb starting December: https://www.tropicaltidbits.com/analysis/models/?model=cansips®ion=namer&pkg=z500a&runtime=2026080100&fh=4 Surface temps starting December: https://www.tropicaltidbits.com/analysis/models/?model=cansips®ion=us&pkg=T2ma&runtime=2026080100&fh=4 Precip starting December: https://www.tropicaltidbits.com/analysis/models/?model=cansips®ion=us&pkg=apcpna_month&runtime=2026080100&fh=4 -
I really like this chart that you posted! Did you make it yourself or grab it from somewhere?
-
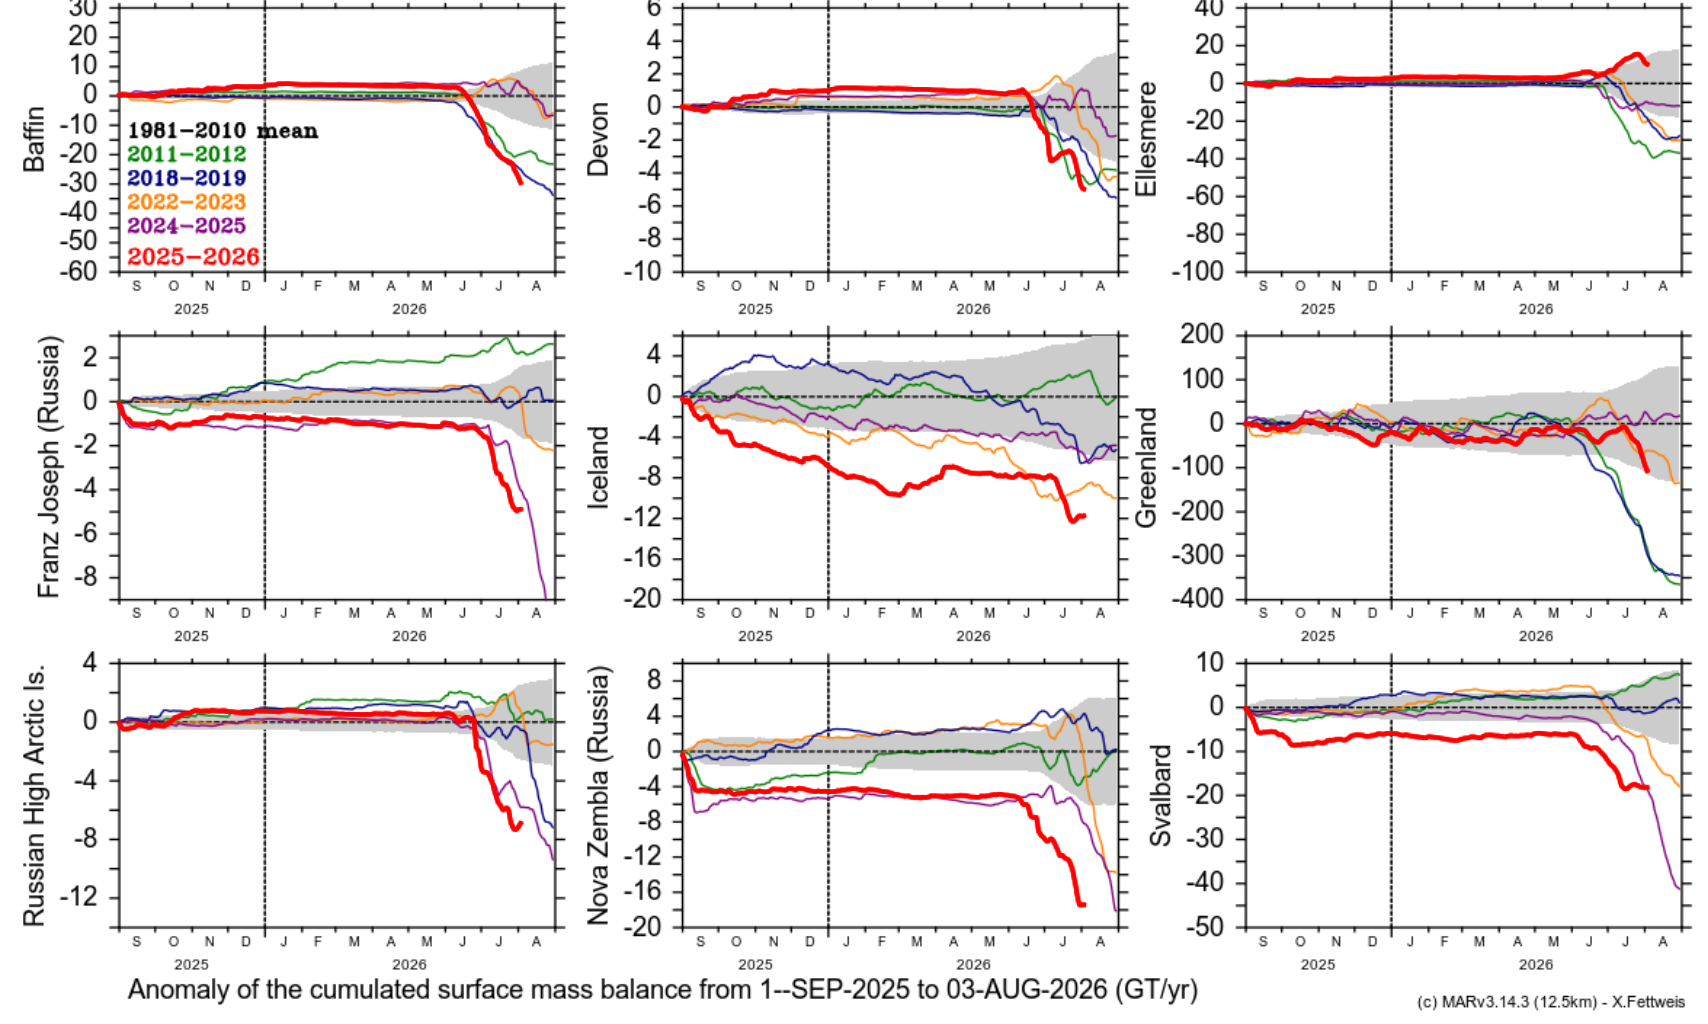
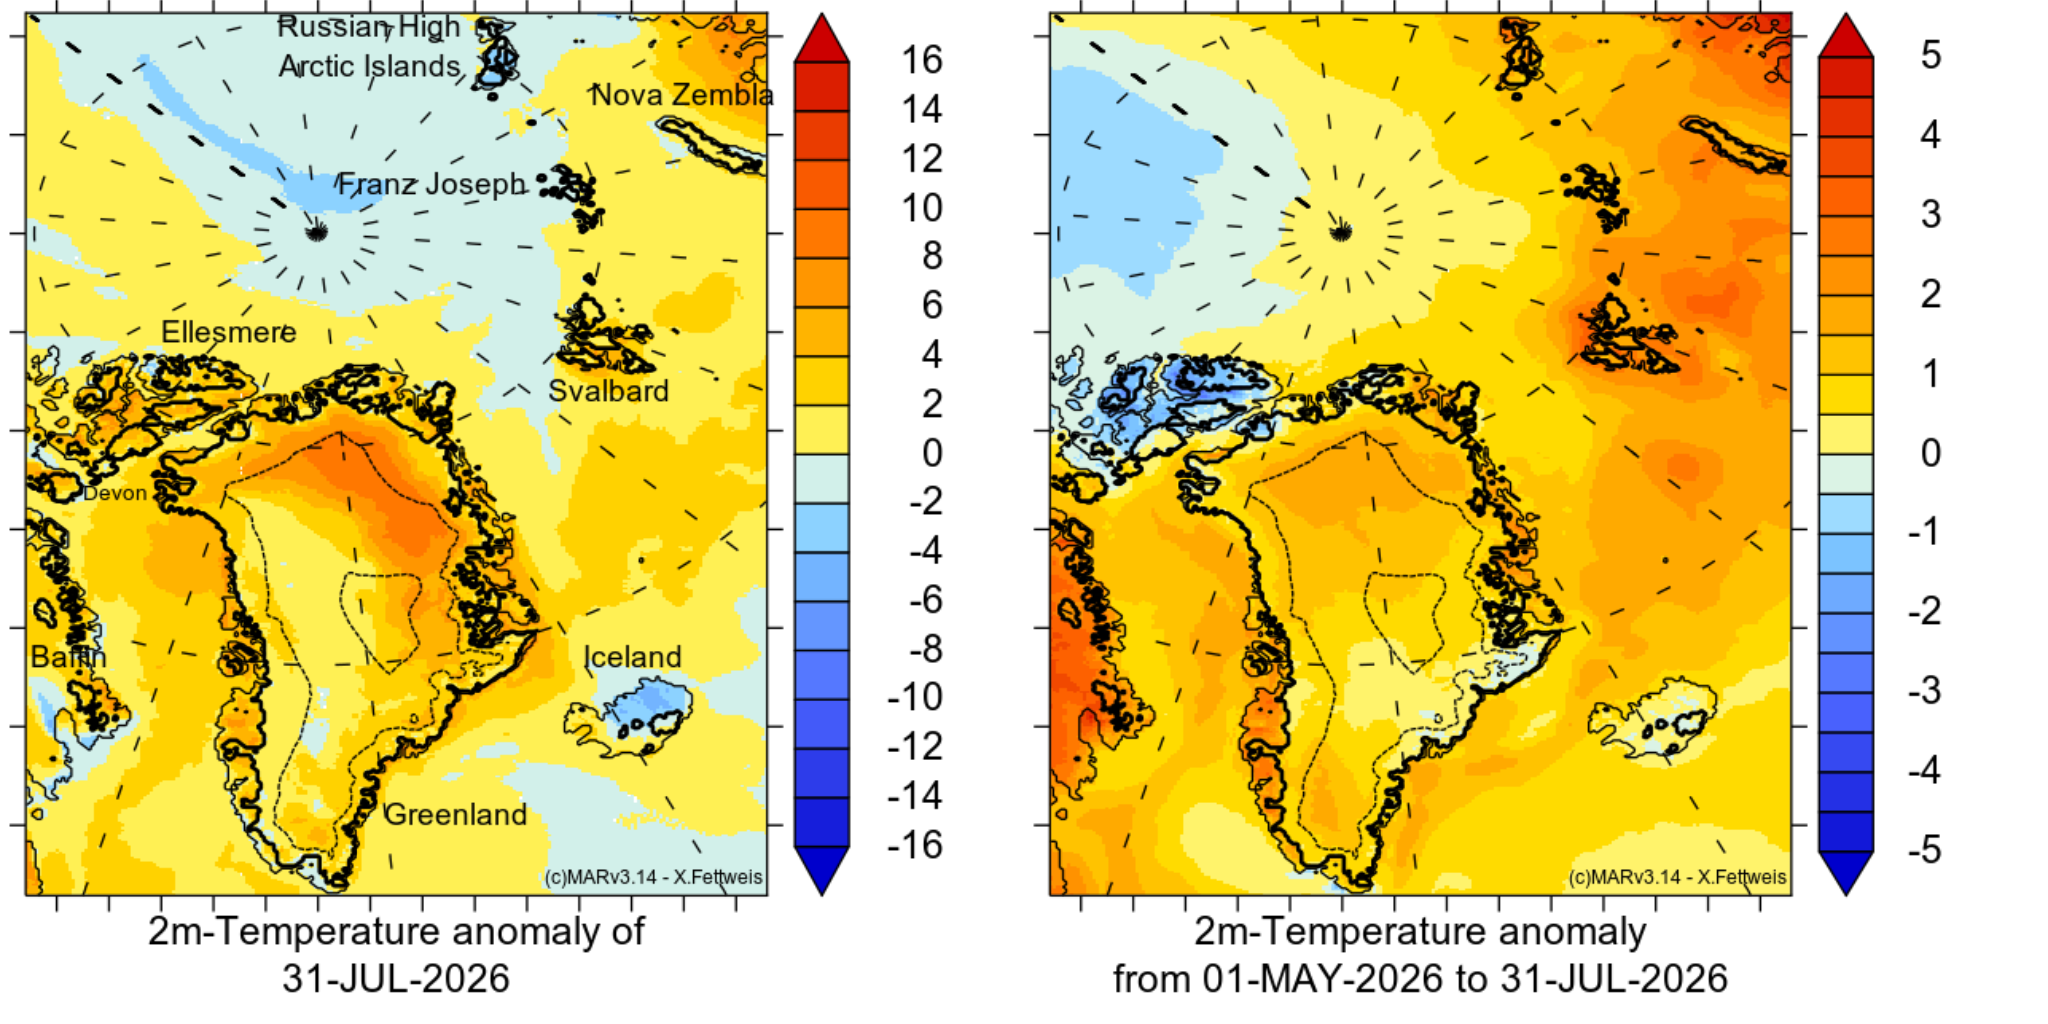
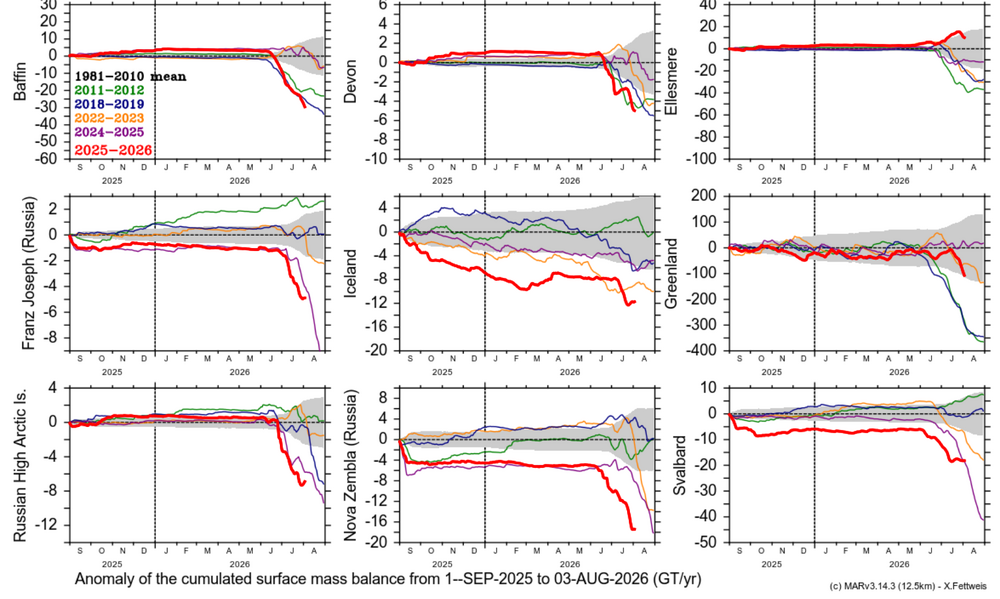
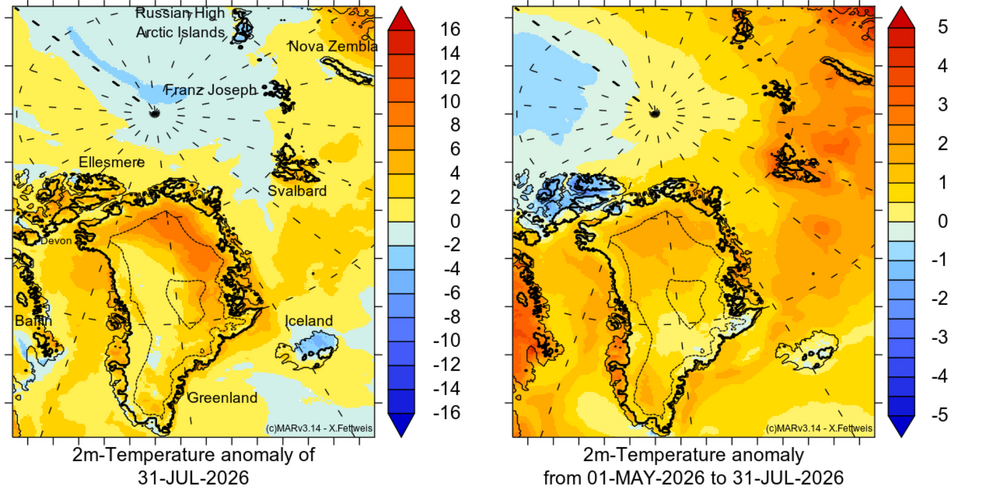
Most of the Arctic Ice caps are having a record or near record melt year. The exceptions are Greenland which has above average losses and Ellsmere Island the which has below average losses. The loss distribution is consistent with the average temperature map since May 1. The Atlantic side of the arctic has been warm, while the Pacific side has been cool. Other than Ellesmere, the arctic ice caps are on the Atlantic side. https://www.climato.uliege.be/cms/c_5855702/fr/climato-arctic
-
2026-2027 Super El Nino
EasternLI replied to Stormchaserchuck1's topic in Weather Forecasting and Discussion
That is the PDO battle royale in a nutshell. As a -PDO plus +ENSO can yield a weaker Aleutian low than you would otherwise expect to see. Yet, PDO variability and transitions has links to the strength of the Aleutian low too. So it's fascinating watching a +enso of this caliber coming up against the deeply entrenched -PDO state. Since Aleutian low strength has ties to +enso strength also. Does one or the other win out? Or is it more of a blend between the two? I lean towards a record el nino taking an upper hand at some point. I feel like this event has some potential to flip us out of that long term -PDO state too or at least begin to. Who knows, but it's really interesting to watch. -
2026-2027 Super El Nino
bluewave replied to Stormchaserchuck1's topic in Weather Forecasting and Discussion
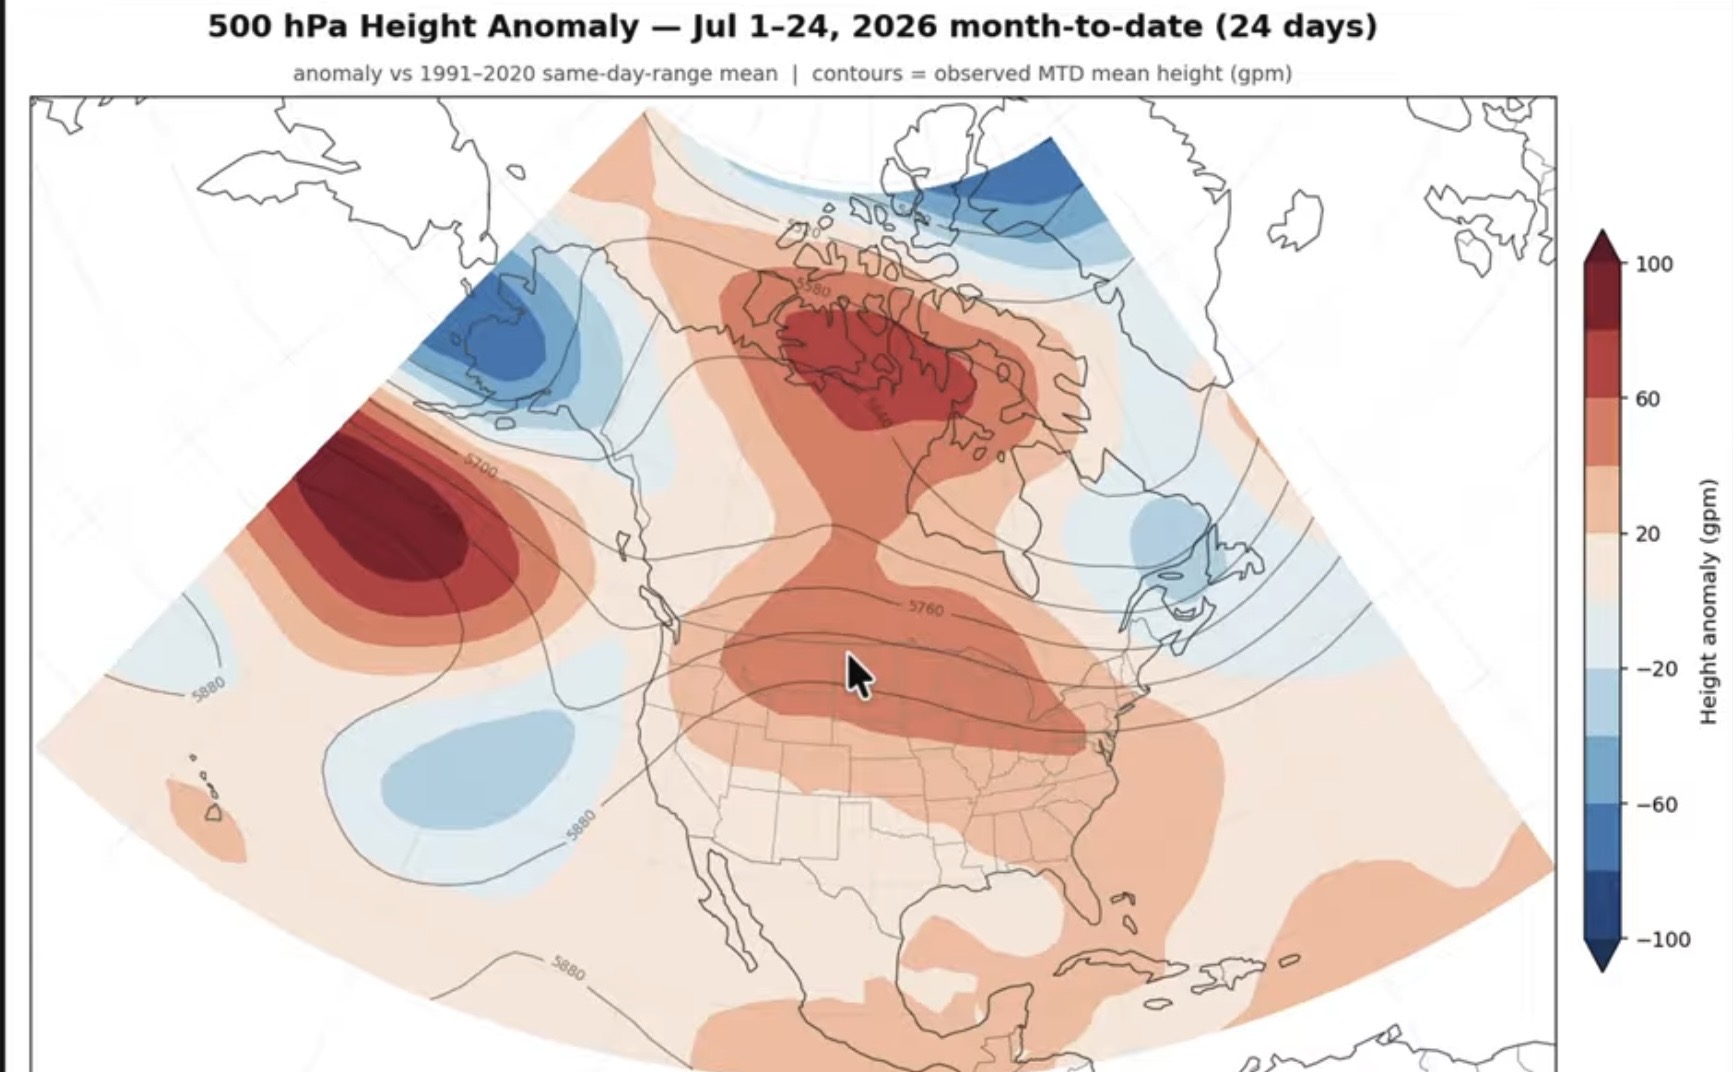
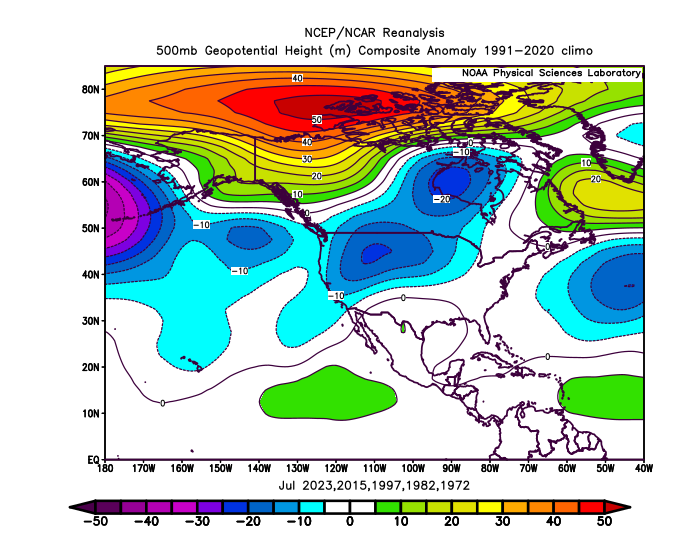
2026 is near the warmest July on record in my first post using 1991-2020 climate normals at +2.5 since that is the base period Brian used. The departure would be even higher if an older base period was used. My 2nd post uses 1971-2000 climo and even that cooler one shows that 1987 wasn’t a warm summer for the CONUs even during the 1980s. Notice the warmest summer of that decade was 1988 which came in the summer after the El Niño and not before. So this El Niño is getting off to a much warmer start than usual. It’s El Ninoish since it matches most of the pattern for an El Niño summer from the Pacific across to the Atlantic. Every spot isn’t going to be a 100% match. But most of the area from the Pacific to the Atlantic is a reasonable 500 mb match whatever the base period is used for an El Niño summer. A hallmark of a developing very strong El Niño pattern during the summer is higher 500mb heights further north and lower heights underneath from the Pacific to the Atlantic. This summer the pattern is reversed which lead to all the record warmth across the CONUS. The record ridge north of Hawaii this month is the reason that the PDO had the steep drop in July. This is not the 500 mb pattern that we have typically had during any El Niños which were on their way to super status. So this event is in a league of its own in numerous ways.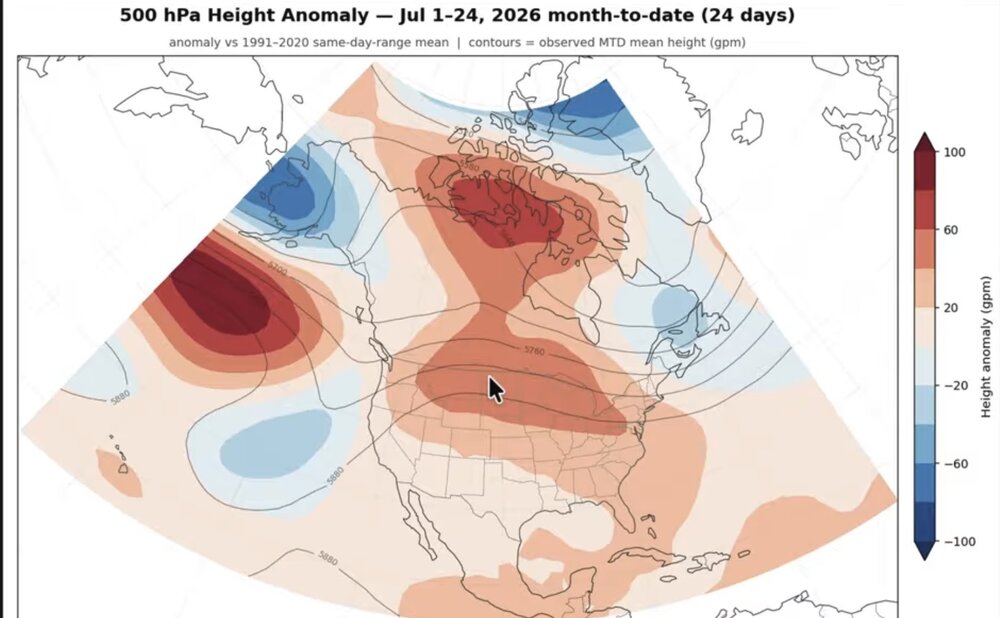
- Today
-
This is easily the greenest my front lawn has been in years. Its usually burnt out by the end of july and i can usually go weeks without mowing.
-
sildenafil online: MedMenNews - Order Viagra 50 mg online
-
Cheap Viagra 100mg: Viagra without a doctor prescription Canada - buy viagra here
-
Waxing
-
That trade is kind of weird. Why would Minnesota win Dean Kremer?
-

Chester County PA - Analytical Battle of Actual vs. Altered Climate Data
chubbs replied to ChescoWx's topic in Climate Change
Nope. Your station selection and AI's method are both faulty. The key period for evaluating the Coatesville post-war moves is 1945-1950, the period immediately after the war when the moves occurred. I didn't include Sadsbury, Kennett Square, and the other Chesco stations you listed, because they didn't operate in that period. After reading the AI analysis more closely, I see that AI used regression analysis to make its determination. As I said above, that is a poor choice because the station moves are focused in time not spread out over a long period of time. AI based its conclusion largely on regression results from Devault and Morgantown both of which didn't start operating until 1951. AI is drawing a conclusion from two stations that don't provide any information on the Coatesville post-war moves; because, they weren't operating at the time. A clear indication of a faulty analysis approach. With 2 of the 3 Chesco stations, Caotesville and Phoenixville, both experiencing spurious cooling between 1945 and 1950, It is important to include non-Chesco stations in the analysis. That's why my analysis included 10 non-Chesco stations. The non-Chesco stations and West Chester agreed completely with West Chester in identifying the common weather signal between 1945 and 1955. Having the common weather signal makes identification of the Coatesville and Phoenixville moves easy; and, with plenty of stations is highly significant statistically. A faulty analysis does not disprove a good one. To disprove my analysis, you need show that the significant difference between the move and non-move stations in the 1945-55 period changes when more data is added. Good luck with that, the P value is 0.0001. -
buy Viagra over the counter [url=http://medmennews.com/#]Med Men News[/url] viagra without prescription
-
Day 4-8 Convective Outlook NWS Storm Prediction Center Norman OK 0317 AM CDT Sat Aug 01 2026 Valid 041200Z - 091200Z ...DISCUSSION... ...Day 4/Tuesday... A broader-scale trough is forecast over central Canada into the north-central U.S. with a series of subtle disturbances moving through the base of that feature. At the surface, a front is expected to move through the upper Great Lakes with the western extension of the boundary settling slowly south through the central High Plains. A severe weather threat may materialize from the mid MO Valley into the central High Plains along the front and in the post-frontal upslope, where an overlap of moderate instability and stronger vertical shear is expected to reside. Elsewhere, a more widespread area of moderate instability developing across southern AZ could support a locally greater risk of severe storms. The extent of the severe weather threat in both areas is currently too uncertain to delineate an area. ...Day 5/Wednesday... The broad, cyclonic flow regime will continue over the north-central CONUS with a belt of slightly enhanced mid-level winds extending from the northern Rockies through the northern and central Plains into the Great Lakes. At the surface, the previously mentioned front will continue through the Great Lakes with the boundary extending southwest through the mid MS Valley into the central or southern High Plains. Similar to Day 4/Tuesday, some severe weather appears possible along the boundary over the lower MO into mid MS Valleys, as well as within the post-frontal upslope across the central High Plains. The subtle nature of the forcing for ascent leads to uncertainty in severe storm coverage, so no area will be included. ...Days 6-8/Thursday through Saturday... The 00Z ensemble means are in reasonably good agreement in depicting the continuation of an upper high over the southwestern U.S. with lower-amplitude troughing over the Great Lakes into the Northeast. At the surface, there is considerable model spread in the location of relevant boundaries that might focus severe storms. That being said, much of the available AI guidance suggests an increasing severe weather threat in the Mid-Atlantic during this time frame. Model trends will continue to be monitored for the possible inclusion of an area in subsequent outlooks. ..Mead.. 08/01/2026
-
http://medmennews.com/# Med Men News generic sildenafil
-
 I wanted Mt. Washington baked out for Mid-Am in October but looks like they got too much rain.
 -
 Synthetic Aperture Radar (SAR) products that give very detailed surface wind profiles for TCs. Click on the storm you want and then "profile plots" for the max winds in each quadrant and RMW text output, among other things. https://www.star.nesdis.noaa.gov/socd/mecb/sar/sarwinds_tropical.php
 -
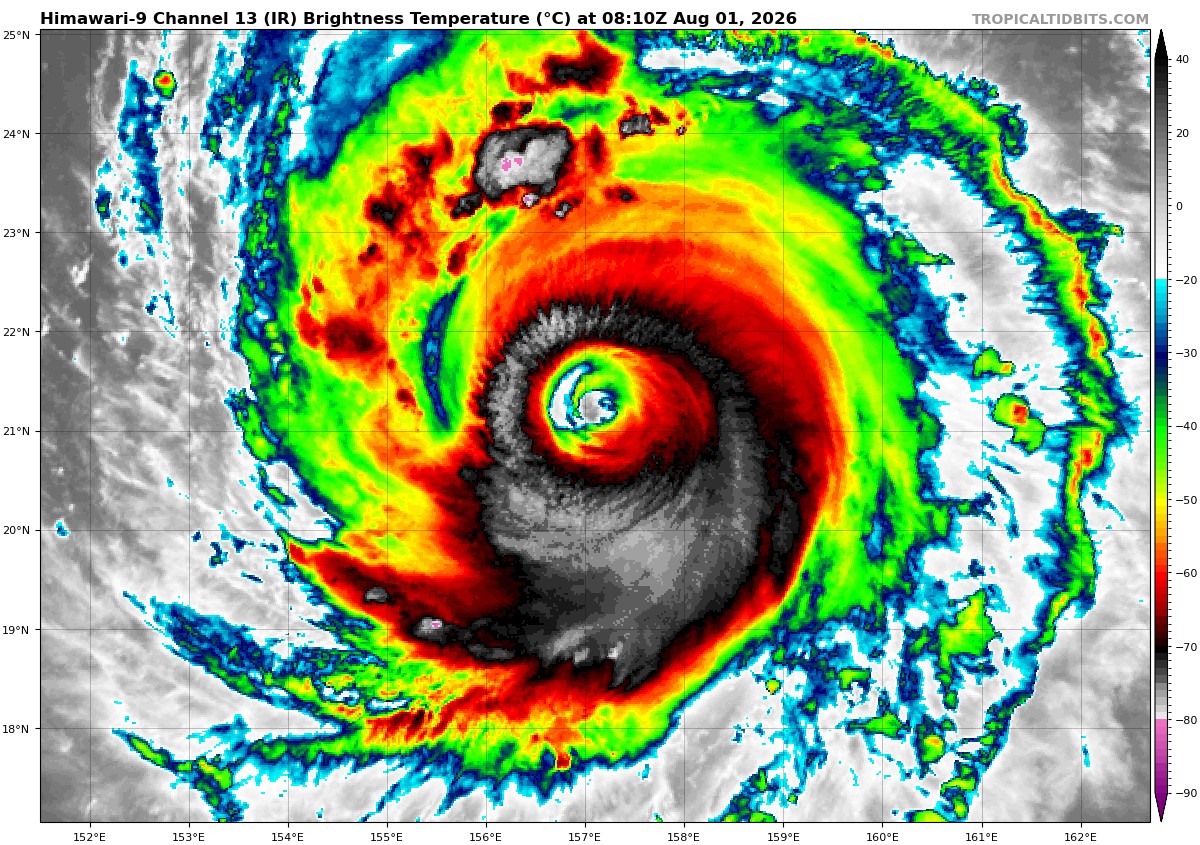
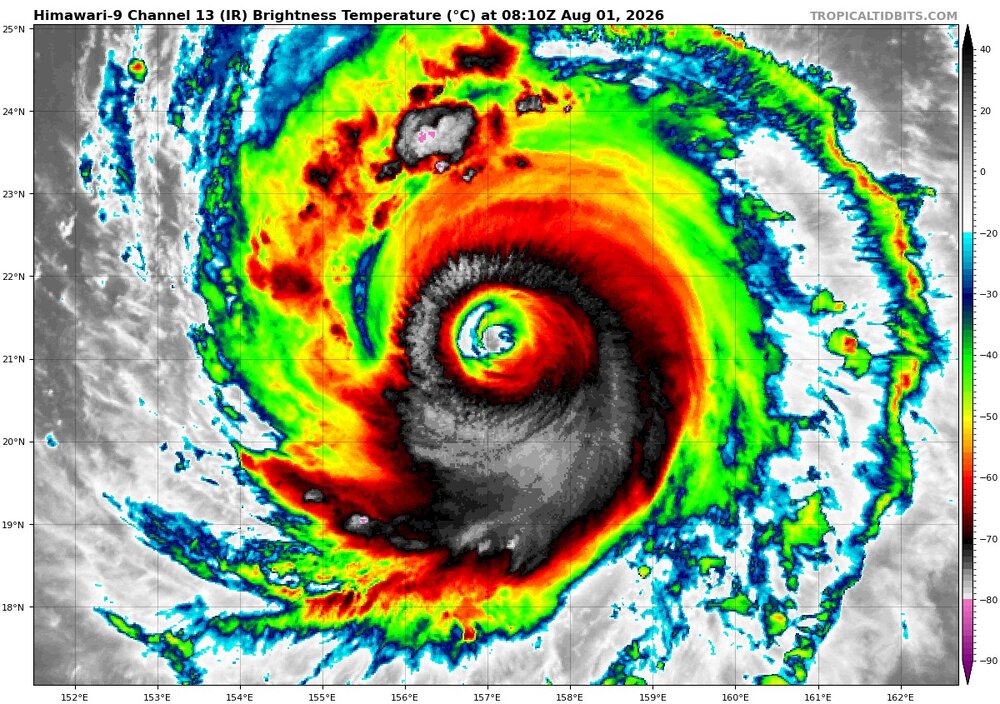
Looks like Dolphin is ready to form a huge eye. Several hours ago, I got about 20 nm for a eye diameter. Based on what I see on EIR now, the new larger eye is going be be close to 60 nm!
-
Yes, higher OHC means what can form and intensify has better potential. However, one thing I have learned is that there is lot more to it, and it is surprising/counterintuitive at times. This underscores what I say a lot, you can't think of the global system in a 1-2-3 linear manner. Human nature is conditioned though for this, as in correlation = causation in a very basic sense! Look at this BAMS paper concerning EPAC and WPAC TC intensification rates. You'd think the WPAC would be "better" for everything concerning TCs b/c it is the most active region on the globe, but that is not true. noaa_54129_DS1.pdf