All Activity
- Past hour
-
Local stations report about 0.8" since Friday. Hoping to add maybe a half inch to that today if all goes correctly. Drought busting? Nah. Drought avoidance? yep
-
Tropical downpour in Calvert. Heavy rain and thunder, very soupy out.
-
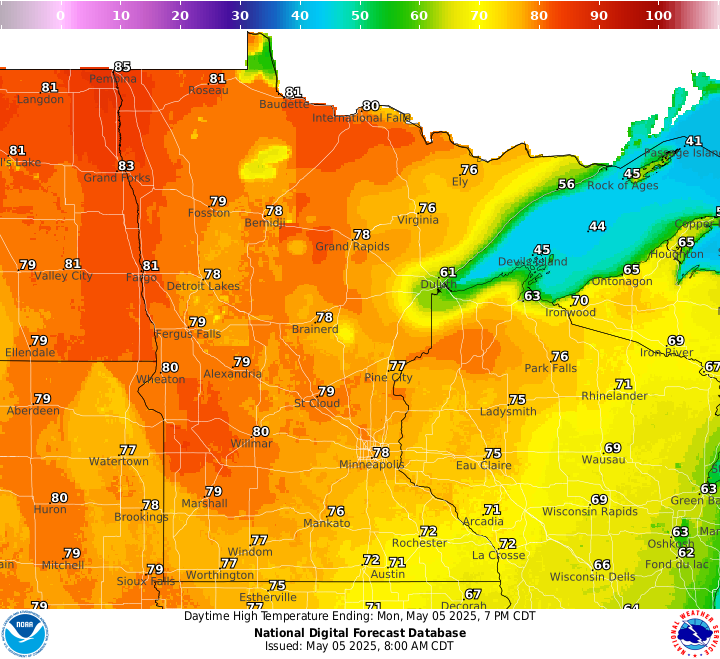
Going to be another hot one away from the Lake today. Max temps across MN will running +15-20. Almost the whole state again. Similar to yesterday.
-
Better than bullseye.
-
1.6 seconds. Just damn. The Blues had an historically bad 6v5 defense this year and it cost them.
-
Been following this thread for a week, arrived from sofla saturday in nyc and heading to Hawley,PA today...will post anything of interest later today and tomorrow. 2-3 inches of rain is very different here than 2-3 inches in sofla, we are in a drought(typical right before the rainy season starts, we are almost there) but even in the rainy season, 3 inches in an afternoon doesnt really move the needle.
-

2025 Spring/Summer Mountain Thread
Maggie Valley Steve replied to Maggie Valley Steve's topic in Southeastern States
38 this morning with clear skies at sunrise. Clouds have rolled in and showers are nearby associated with the cold core upper low. -
Chicago (and Cleveland) lakeshore would have more of a difference year-round than Detroit. Its my understanding the entire reason the NWS (or formerly Weather Bureau) moved stations is for more uniformity due to increasing influences at a station site. DTW airport absolutely has seen increasing UHI since the 1980s due to so much expanding concrete. They were a radiational cooling magnet in the 1960s-70s and that changed drastically starting in the 1990s. Detroit city airport is no longer a first-order station, but it does have a thermometer so to compare, the first 20 years DTW became the official site, DTW averaged 1.7F cooler than DET. The last 20 years DTW has averaged just 0.3F cooler. Regardless of the site locations, we dont know all the warming influences (or lackthereof) at any given time. There is no way a big city full of dirt roads in the 1870s would have the same temperature readings as that same spot would have as a concrete jungle in the 2020s. That chart, "since 1970". THAT has also been discussed multiple times now. This unusual starting date is used frequently, and it is soley to make warming look as extreme as possible. Starting a chart in 1970 ahead of the coldest winters on record will give you the biggest regression line. And as we move farther away from 1970, why cling onto using that starting point? Its now 55 years, so far more than the 30-year periods commonly used, that you wonder why not go longterm? Its because to do that, youd have to include the much milder winters of the 1930s-1950s which would really tone down that regression line. So youd have to go back to 1870 to make it a bit better. You will never, EVER see a regression line chart start in 1930. And whats funny is that that would make a lot more sense than 1970 as we are nearing the 100-year mark. Yes Ann Arbor winters have warmed 3.9F since 1970....and theyve warmed 1.4F since 1930. Regardless of the amount of warming or any discussion on temps, site changes, etc...the lower Great Lakes are not seeing any notable adjustments to their snowfall or snowcover climo other than normal decade to decade noise, although erring on the side of INCREASING somewhat rather than decreasing. So this brings me back to my original point, how is it that suddenly NYC is seeing this erratic rubber band from snowiest decade on record to a snow drought from which they supposedly may never recover?
-
No signs of 90 degree temps on the horizin. Actually, nice cooler weather coming at the end of this week for a couple of days.
.thumb.png.f32e01e9d4d4e87e62d121e0c0d40413.png)
-
SLGT risk added today for NoVA and western half of MD. But it excludes me by like 5 miles
-
.90 so far here in 21057
-
some storms nearing you from the SE
-
0.71"
-
Exactly!
-
Installing a generator on the Cape in Dennis today. Beautiful morning here, warm and sunny
-
Same, just had 6 bud's fully open yesterday. Made sure to take this opportunity to fertilize them.
-

Central PA Spring 2025
Mount Joy Snowman replied to canderson's topic in Upstate New York/Pennsylvania
Low of 62 and a 3-day rain total of exactly 1.50”. Grass is looking lush. - Today
-
Don't forgot to try some New Haven Apizza. I like Bar and Modern Archie Moore's has the best wings in New Haven as well. Please don't go to Wingstop. Also, long wharf across from IKEA has dozens of really good food trucks along the water.
-
I see the GFS with the first Atlantic cane of the season
-
The rain might be great for some veggies but my newly bloomed red roses look all mangled right now.
-
Rainfall totals Fri through 0600 NYC: 1.10 EWR: 0.43 JFK: 0.41 New Brnwck: 0.36 LGA: 0.13
-
it's bad enough for most of the week to be wet, but another friggin Saturday!! C'mon man
-
This is a perfect time to be getting rain like this with full leaf out occurring and help get rid of the green crap everything is coated in.
-
Records: Highs: EWR: 94 (1949) NYC: 90 (1980) LGA: 90 (1955) JFK: 84 (1980) Lows: EWR: 38 (1966) NYC: 34 (1891) LGA: 42 (1978) JFK: 41 (2002) Historical: 1917 - The same storm which a day earlier produced eight inches of snow in the Texas panhandle, produced a foot of snow at Denver CO, their heaviest snow of record for the month of May. (David Ludlum) 1930 - The temperature at College Park, VA, soared from 43 degrees to 93 degrees to begin an exceptional heat wave. (Sandra and TI Richard Sanders - 1987) 1933: An estimated F4 tornado cut a 35-mile path from near Brent into Shelby County, Alabama. The town of Helena, AL was especially hard hit, as 14 people died. The tornado roared through Helena at 2:30 am. 1987 - Unseasonably hot weather prevailed in the western U.S. A dozen cities in California reported record high temperatures for the date. Afternoon highs of 93 degrees at San Francisco, 98 degrees at San Jose, 100 degrees at Sacramento, and 101 degrees at Redding, were the warmest of record for so early in the season. The high of 94 degrees at Medford OR was also the warmest of record for so early in the season. (The National Weather Summary) 1987 - Parts of the western U.S. were in the midst of a blistering May heat wave. The reading of 100 degrees in Downtown Sacramento CA was their earliest of record. Sacramento CA established daily record highs on nine of eleven days between the 4th and the 14th. (The Weather Channel) 1988 - A stubborn low pressure system continued to drench the eastern U.S. with rain. Thunderstorms again produced large hail in North Carolina. (The National Weather Summary) 1989 - Thunderstorms swept across Georgia and the Carolinas during the late afternoon and evening hours spawning seventeen tornadoes. A tornado at Toccoa GA injured 15 persons, and a tornado at Chesnee SC killed two persons and injured 35 others. Five tornadoes in North Carolina accounted for five deaths, 88 injuries, and sixty million dollars damage. Thunderstorms also produced baseball size hail at Lake Murray SC, and wind gusts to 78 mph at Brooklyn MD. (The National Weather Summary) (Storm Data) 1990 - A strong Pacific cold front moving rapidly inland caused weather conditions at the east end of the Strait of Juan de Fuca in Washington State to quickly change from sunny and calm to westerly winds of 60 mph and ten-foot waves. Three recreational fishing boats capsized in heavy seas off Port Angeles resulting in five deaths. In California, temperatures soared above 90 degrees across much of the state. The high of 101 degrees in downtown Los Angeles was eight degrees hotter than their previous record for the date. (The National Weather Summary) (Storm Data) 1995: A supercell thunderstorms brought torrential rains and large hail up to four inches in diameter to Fort Worth, Texas. This storm also struck a local outdoor festival known as the Fort Worth Mayfest. At the time the storm was the costliest hailstorm in the history of the US, causing more than $2 billion in damage.
-
I was turning 10 years old and we had just moved into a new house and I was enjoying the central air and our big back yard with large pine trees and acorns lol where I played ball. Great memories!!


.png.4419545b25263636308cb225e6ea29c7.png)