
All Activity
- Past hour
-
Yeah, the 100°+ heat has generally been occurring earlier in the summer since 2010 than in previous decades. There have been only 2 years since then with 100° heat between August 1st and 9th. No 100° heat from August 10th onward. First/Last Summary for NEWARK LIBERTY INTL AP, NJ Each section contains date and year of occurrence, value on that date. Click column heading to sort ascending, click again to sort descending. Minimum 06-09 (2011) 06-30 (2021) 0 Mean 07-01 07-21 19 Maximum 07-20 (2022) 08-09 (2022) 43 2025 06-23 (2025) 101 07-30 (2025) 100 36 2024 06-21 (2024) 100 08-01 (2024) 100 40 2023 - - - - - 2022 07-20 (2022) 100 08-09 (2022) 101 19 2021 06-29 (2021) 102 06-30 (2021) 103 0 2020 - - - - - 2019 - - - - - 2018 - - - - - 2017 - - - - - 2016 - - - - - 2015 - - - - - 2014 - - - - - 2013 07-18 (2013) 101 07-19 (2013) 100 0 2012 07-07 (2012) 102 07-18 (2012) 104 10 2011 06-09 (2011) 102 07-23 (2011) 102 43 2010 07-04 (2010) 101 07-07 (2010) 101 2 First/Last Summary for NEWARK LIBERTY INTL AP, NJ Each section contains date and year of occurrence, value on that date. Click column heading to sort ascending, click again to sort descending. Minimum 06-15 (1994) 06-19 (1994) 0 Mean 07-11 07-25 13 Maximum 08-07 (2001) 09-03 (1993) 75 2009 - - - - - 2008 - - - - - 2007 - - - - - 2006 08-01 (2006) 100 08-03 (2006) 101 1 2005 07-27 (2005) 101 08-13 (2005) 102 16 2004 - - - - - 2003 - - - - - 2002 07-04 (2002) 100 08-13 (2002) 100 39 2001 08-07 (2001) 100 08-09 (2001) 105 1 2000 - - - - - 1999 07-05 (1999) 103 07-19 (1999) 100 13 1998 - - - - - 1997 07-15 (1997) 101 07-17 (1997) 100 1 1996 - - - - - 1995 07-15 (1995) 104 07-15 (1995) 104 0 1994 06-15 (1994) 101 06-19 (1994) 102 3 1993 06-19 (1993) 102 09-03 (1993) 100 75 1992 - - - - - 1991 07-20 (1991) 100 07-21 (1991) 102 0 1990 - - - - - 1989 - - - - - 1988 06-22 (1988) 101 07-17 (1988) 100 24 1987 - - - - - 1986 07-07 (1986) 100 07-07 (1986) 100 0 1985 - - - - - 1984 - - - - - 1983 - - - - - 1982 07-18 (1982) 100 07-18 (1982) 100 0 1981 - - - - - First/Last Summary for NEWARK LIBERTY INTL AP, NJ Each section contains date and year of occurrence, value on that date. Click column heading to sort ascending, click again to sort descending. Minimum 06-21 (1953) 06-26 (1943) 0 Mean 07-14 07-27 12 Maximum 08-28 (1973) 09-02 (1953) 72 1980 07-20 (1980) 101 07-21 (1980) 101 0 1979 - - - - - 1978 - - - - - 1977 07-19 (1977) 100 07-21 (1977) 102 1 1976 - - - - - 1975 - - - - - 1974 - - - - - 1973 08-28 (1973) 100 08-28 (1973) 100 0 1972 - - - - - 1971 - - - - - 1970 - - - - - 1969 - - - - - 1968 - - - - - 1967 - - - - - 1966 06-27 (1966) 101 07-13 (1966) 100 15 1965 - - - - - 1964 - - - - - 1963 07-01 (1963) 100 07-01 (1963) 100 0 1962 - - - - - 1961 - - - - - 1960 - - - - - 1959 06-29 (1959) 100 06-29 (1959) 100 0 1958 - - - - - 1957 07-22 (1957) 101 07-22 (1957) 101 0 1956 - - - - - 1955 07-05 (1955) 101 08-02 (1955) 100 27 1954 07-14 (1954) 102 07-31 (1954) 103 16 1953 06-21 (1953) 100 09-02 (1953) 105 72 1952 06-26 (1952) 102 06-26 (1952) 102 0 1951 - - - - - 1950 - - - - - 1949 07-03 (1949) 100 08-11 (1949) 102 38 1948 08-26 (1948) 103 08-28 (1948) 102 1 1947 - - - - - 1946 - - - - - 1945 - - - - - 1944 08-04 (1944) 100 08-13 (1944) 100 8 1943 06-25 (1943) 100 06-26 (1943) 102 0 1942 - - - - - 1941 - - - - - 1940 - - - - -
-
How are yall even in a drought..lol We are having the same luck here like @ Dwagner is going through,i dont think we've gotten a inch the last 30 days while some parts are doing exceptional well.
-

Central PA Summer 2026 Discussion/Obs Thread
Superstorm replied to Voyager's topic in Upstate New York/Pennsylvania
0.23” of rain yesterday. . -
Central PA Summer 2026 Discussion/Obs Thread
Superstorm replied to Voyager's topic in Upstate New York/Pennsylvania
COC for next 10 days. . -
I'll also say this is a big, big win for AI guidance, especially Euro AI and Euro AI ensembles. It identified the window and also latched onto a more western track early on. I continue to be highly impressed by AI sniffing out windows in marginal conditions.
-
https://www.severe-weather.eu/global-weather/rare-atlantic-nina-joins-super-el-nino-atmospheric-shield-hurricane-season-winter-united-states-canada-fa/
-
09-10 was modiki (west based). Best we can hope for this year is probably basin wide.
-
(002).thumb.png.6e3d9d46bca5fe41aab7a74871dd8af8.png) So we did a little fact check on Charlie's claim that the raw data cooled more than surrounding stations.....The facts are that the raw cooling data is well supported by the surrounding regions! Below is the AI review of the raw data for the 3 stations in question. What that regional record shows for 1946–1970 Using Penn State's State Climatologist office data (built from this same NCEI divisional dataset): Metric Official SE PA Division (Chester/Berks/Montgomery/Lancaster region) Your 3-station Chesco composite 1946 annual avg 54.0°F — 1970 annual avg 52.4°F — Trend −0.093°F/yr −0.083°F/yr Total change, 1946–1970 −2.23°F −2.00°F R² 0.365 0.352 p-value 0.0014 0.0018 That's a remarkably close match — both in direction, magnitude, and statistical significance. Individually, Phoenixville 1E (−2.34°F, p=0.0008) and West Chester 2NW (−2.48°F, p=0.0014) track the regional figure almost exactly; Coatesville 1SW is a bit weaker (−1.17°F) and only marginally significant on its own (p=0.055), but still points the same direction. Bottom line: Yes, the cooling is well supported by the surrounding region. This is a case where the "raw" county data and the "official" broader regional data agree closely So if the cooling in the raw data is statistically the same as the surrounding data why did NCEI choose to chill the raw data further in each and every year between 1946-1970??
So we did a little fact check on Charlie's claim that the raw data cooled more than surrounding stations.....The facts are that the raw cooling data is well supported by the surrounding regions! Below is the AI review of the raw data for the 3 stations in question. What that regional record shows for 1946–1970 Using Penn State's State Climatologist office data (built from this same NCEI divisional dataset): Metric Official SE PA Division (Chester/Berks/Montgomery/Lancaster region) Your 3-station Chesco composite 1946 annual avg 54.0°F — 1970 annual avg 52.4°F — Trend −0.093°F/yr −0.083°F/yr Total change, 1946–1970 −2.23°F −2.00°F R² 0.365 0.352 p-value 0.0014 0.0018 That's a remarkably close match — both in direction, magnitude, and statistical significance. Individually, Phoenixville 1E (−2.34°F, p=0.0008) and West Chester 2NW (−2.48°F, p=0.0014) track the regional figure almost exactly; Coatesville 1SW is a bit weaker (−1.17°F) and only marginally significant on its own (p=0.055), but still points the same direction. Bottom line: Yes, the cooling is well supported by the surrounding region. This is a case where the "raw" county data and the "official" broader regional data agree closely So if the cooling in the raw data is statistically the same as the surrounding data why did NCEI choose to chill the raw data further in each and every year between 1946-1970?? -
.thumb.gif.f92b16c631a1d15d405ed77b33f0710d.gif) Yeah not sure what they were thinking there...any heat looked transient through early Ughust at the minimum
Yeah not sure what they were thinking there...any heat looked transient through early Ughust at the minimum -
 It’s been the trend for the last 10 years or so.
 -
Saturday, July 18, 2026 Thunderstorm/Severe Weather Potential
CoastalWx replied to weatherwiz's topic in New England
FAIL -
Saturday, July 18, 2026 Thunderstorm/Severe Weather Potential
CoastalWx replied to weatherwiz's topic in New England
What about Al? -
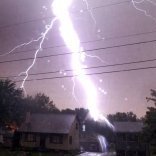
We got maybe 34 rain drops last night around 9-930pm but man helluva light show from all the lightning and was windy. Everything just missed us not by much. Total rainfall yesterday was .03" here
-
 If you’re not getting anything then I have no chance whatsoever
 -
Saturday, July 18, 2026 Thunderstorm/Severe Weather Potential
Cyclone-68 replied to weatherwiz's topic in New England
Please call me Ken lol -

2026-2027 Super El Nino
roardog replied to Stormchaserchuck1's topic in Weather Forecasting and Discussion
Don’t they pretty much always do that? The last two winters defaulted to a Nina look. That didn’t turn out too well either. -
Kudos to the UKMET. Especially with the eventual westward component that it started suggesting before anything else. A few days ago, the ensembles latched onto taking the feature into the WATL. I was confident of that as well. But confidence means little in the early stages of a disorganized system caught between several dominant features and weak steering currents that are not fully resolved. Now, we have to see how convection evolves with the overall broader surface low. If a smaller vorticity becomes dominant, location if where that occurs will be critical to how long this system remains over water versus the gradual westward turn. Regardless, it looks like copius rainfall is on the menu for the Panhandle/So. Alabama, MS, and LA.
-
In the below 2022 study, "the authors analyzed thousands of different versions of the dataset downloaded over 10 years. They studied the homogenization adjustments for more than 800 European temperature records. They found that these adjustments changed dramatically every day when NOAA re-ran their computer program. The authors found that only 17% of NOAA’s adjustments were consistent from run to run. Furthermore, by compiling historical records known as station history metadata for each of the stations, they were able to compare the adjustments applied by NOAA’s computer program to the documented changes that were known to have occurred at the weather station. They found that less than 20% of the adjustments NOAA had been applying corresponded to any event noted by the station observers - such as a change in instrumentation or a station move." Homogenization of data is badly flawed and should be disregarded as such"The study itself was not focused on the net effects of these adjustments on long-term climate trends. However, the authors warned that these bizarre inconsistencies in this widely-used climate dataset are scientifically troubling. They also are concerned that most researchers using this important dataset have been unaware of these problems until now.https://www.ceres-science.com/post/major-problems-identified-in-data-adjustments-applied-to-a-widely-used-global-temperature-dataset?fbclid=IwY2xjawTJxvZleHRuA2FlbQIxMABicmlkETFRaGlnYzJQQVNzdndoTkdwc3J0YwZhcHBfaWQQMjIyMDM5MTc4ODIwMDg5MgABHlguzGDpWxHyS0ptciE_1okX3LFV-2pBe4Pu2WQnleZLxvskMdPVhhDxQZq5_aem_g_cHQVsBuo4BwgjgPPTV1g
-
Clear as ever around 8 this morning. Just looked out my window at the hill to the west - smoke is back.
-
Just checking in. A month ago it looked like a possible west based Nino. Now east base? I thought 2009-10 was a east base?
-
1.80" for event, up to 5" for month....first 5"+ month since 8/24.
-
Rare to see the CSU and SPC so at odds (wrt Tuesday). 12k NAM has a couple rounds here locally, one midday and one later in the evening, while the RRFS has just one, in the afternoon. my interest is certainly piqued whenever we get strong flow in the summer, so expecting at least a few SVRs throughout the day.
-
There still is some suspended smoke on satellite.
-
Tropical Depression Two Discussion Number 1 NWS National Hurricane Center Miami FL AL022026 1000 AM CDT Sun Jul 19 2026 The area of low pressure that NHC has been monitoring in the northeastern Gulf of America during the past few days has now developed a well-defined low-level circulation. The convective activity remains patchy, likely due to intrusions of dry air from its northeast, but there is enough persistent convection near the center and in bands on its northeast and southwest sides to justify this system as a tropical depression. The circulation is sprawling and still weak, however. Based on surface observations and earlier ASCAT data, the initial intensity is set at 25 kt and the minimum pressure is 1011 mb. The Air Force Hurricane Hunters are scheduled to investigate this system later today, and their data will be helpful to better assess the system’s initial structure. The initial motion of the system is difficult to know since it has only recently become well defined, but our best guess is north-northwestward at 3 kt. The system is currently caught in weak steering currents between a ridge over the western Atlantic, another ridge over the south-central and southwestern U.S., and a trough over the northeast U.S. This pattern should take the cyclone slowly northwestward through Monday night, and the system will likely be close enough to the Florida Panhandle to bring the potential for tropical storm conditions there. After that time, a turn to the west or west-northwest seems to be the most likely scenario as the ridge over the southern U.S. builds eastward, taking the system near or across the Gulf coast during the middle and latter portions of the week. The NHC track forecast lies a touch to the south of middle of the guidance envelope, in best agreement with the usually best-performing aids HCCA, TVCN, and GDMI. The sprawling nature of the system, nearby dry air, and some northeasterly vertical wind shear suggest that any strengthening should be slow to occur, especially in the short term. Nonetheless, the system is expected to become a tropical storm as it approaches the Florida Panhandle during the next day or two. There seems to be a better opportunity for the system to strengthen once it turns westward, however, the amount of strengthening will be dependent on how far offshore the circulation is. The NHC track forecast lies toward the upper end of the model guidance, however, there is a low amount of confidence given the uncertainty of how much land interaction will take place. Key Messages: 1. The depression is expected to gradually strengthen and could bring tropical storm conditions to portions of the Florida Panhandle, where a Tropical Storm Watch has been issued. 2. Interests in Alabama, Mississippi, Louisiana, and Texas should monitor the progress of this system, as watches could be required for portions of that area over the next day or two. 3. Areas of flash flooding will be possible through Thursday along the eastern and central Gulf Coast from western Florida to southern portions of Alabama, Mississippi, and Louisiana. FORECAST POSITIONS AND MAX WINDS INIT 19/1500Z 28.0N 85.3W 25 KT 30 MPH 12H 20/0000Z 28.2N 85.4W 30 KT 35 MPH 24H 20/1200Z 28.5N 85.7W 35 KT 40 MPH 36H 21/0000Z 28.8N 86.0W 40 KT 45 MPH 48H 21/1200Z 29.1N 86.4W 40 KT 45 MPH 60H 22/0000Z 29.4N 87.3W 45 KT 50 MPH 72H 22/1200Z 29.7N 88.4W 50 KT 60 MPH 96H 23/1200Z 29.5N 91.6W 50 KT 60 MPH 120H 24/1200Z 29.7N 95.1W 45 KT 50 MPH...INLAND $$ Forecaster Cangialosi







.thumb.jpg.ad3a2e31d30aff035044689b311a0540.jpg)
