All Activity
- Past hour
-
No guarantee it gets that hot down here (Ft Worth) this summer.
-
 Yup
Yup
-

Central PA Summer 2026 Discussion/Obs Thread
Mount Joy Snowman replied to Voyager's topic in Upstate New York/Pennsylvania
Welcome! Great story, I love all things Pine Creek related ha. -
GRR is at -1.4° below normal heading into the final day.
-
Corona, Queens is one of the prime spots for compressional heating.
-

2026-2027 Super El Nino
PhiEaglesfan712 replied to Stormchaserchuck1's topic in Weather Forecasting and Discussion
What if I told you that the coldest CONUS winter in the 21st century happened during a strong el nino year? And we did it with Nino 1+2 being close to neutral? But for there to be a cold winter in the Northeast or mid-Atlantic in a strong or super el nino, one would think the record warmth would be centered on the PNW or even southwest Canada (like in 2009-10, when record warm temperatures affected the Winter Olympics in Vancouver). Yeah, the only time a robust el nino held for two years was 1986-88, and that el nino dissipated quickly in the 2nd year, setting up the stage for one of the strongest la ninas on record in 1988-89. Prior to the mid-2010s el nino, it was almost a certainty that a strong or super el nino was followed by a strong la nina starting from 1972-73: 1973 - Yes 1983 - No (but we did get a multiple-year la nina, which peaked in the high weak/low moderate) 1988 - Yes 1992 - No (but a major volcano happened, and that might have screwed things up) 1998 - Yes, multi-year strong la nina 2010 - Yes Of course, 2016 and 2024 weren't followed by a strong la nina. Do we think it will happen 3 times in a row that we don't get a strong la nina after a robust el nino? -
Yeah, big heat coming. We are now under an Extreme Heat Watch (formerly 'Excessive Heat Watch') for Thursday morning through at least Friday evening.
-
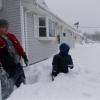
No, just a couple fans to circulate the air and dry the sweat. Currently 71/71.
-
 Amateur question here...Is that 70 Mt. Washington?
 -
IYKYK... Even for someone like me who loves heat and humidity, that's just not fun for anyone.
-
lol what the hell is the criteria down there??? A heat advisory seems…insufficient.
-

2026-2027 Super El Nino
George001 replied to Stormchaserchuck1's topic in Weather Forecasting and Discussion
Depends on where you live. For my area weak El Niño is the sweet spot, and really weak ENSO is best (the top 2 ENSO states are weak El Niño and weak La Niña). ENSO has a pretty weak correlation though here. The only time I really lower expectations for winter due to ENSO here is if it’s a super Nino. I’ve been saying for a while I would rather roll the dice with a strong La Niña than a super Nino here. I would bet on the 27-28 winter producing more snow here than the 26-27 winter. All we really know for 27-28 is it won’t be a super Nino, since 26-27 will be and we don’t see multi year super ninos. I do think there is an elevated chance for a strong La Niña in 27-28 like @PhiEaglesfan712 is saying, but it’s not a guarantee. -
 GSPcountry joined the community
 -
Do you have any AC?
-
 Mr Senior joined the community
 -
Detroit is at -0.1F on the last day of the month so with the heat it will end up a few tenths of a degree above avg. Basically, a "normal" June anyway you slice it (generally +/- 0.5F is often considered "normal" by many). For me personally it has been a cool and very enjoyable June, due to the timing of my Alaska trip coinciding with our warmth early in the month and then my return coming with 2 weeks of below avg temps.
-
 Zen Blue joined the community
 -

2026-2027 Super El Nino
michsnowfreak replied to Stormchaserchuck1's topic in Weather Forecasting and Discussion
I could be wrong, but I believe a strong El Nino is traditionally better compared to avg for Colorado than it is in the east. Plus of course, we know how Denver can rack up September and May snow with 70F in January . While measurable snow is normal here in the Detroit area from November thru April, its a more traditional curve, with the snowiest month being January followed closely by February (each month over 12"), with both November and April each averaging just under 2". A common trend seen in strong El Ninos is well ABOVE avg snowfall in November, followed by below avg snow in December. Once you get to January results get more mixed. -
 I'm not buying that at IK in the woods. 95 seems more doable.
 -
 This is rare for this area. Not sure it works this way
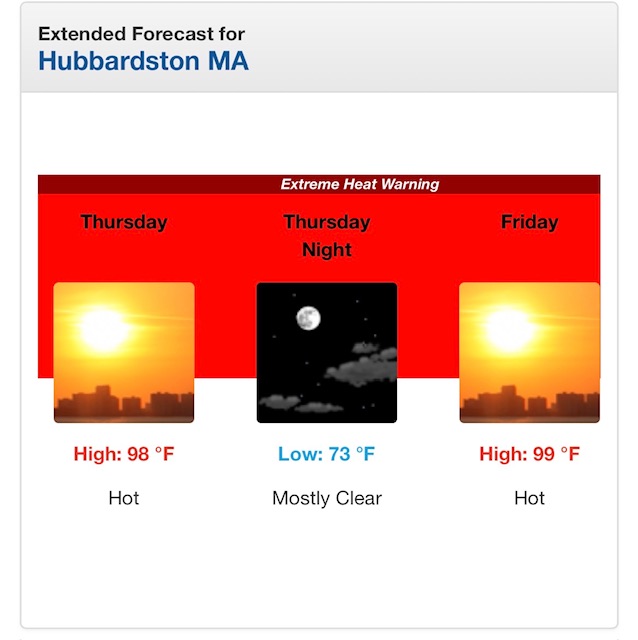
-
Dews will be dewlicious
-
 JohnnyH95 joined the community
 -
 Analyzed everything from the 00z GFS/Euro/Canadian. En masse/holistically the Wed-Sat heat wave was modestly more intense by potential 1-3 F max (which situates higher nocturnals) than the previous two or three model cycles. Emphasis on 'modest'. Because none of these model run/analysis going back several days at this point have deviated significantly from a general motif of being near or at upper bound heat event, it's unlikely to register as much of a sensible human difference. 97 or 101, you're not feeling that change particularly if the DP varies by some ( HI's may vary). Extremist was GFS at 101/102's common from D.C. to Metro West Boston. Contrasting upper 90s from the GGEM. Euro's low balling Wednesday I feel ...otherwise might be a decent compromise. Hard to really pick one over the other. I don't see many limiting factors on this 00z cycle, across the board. All three have off-shore light winds under 21 to 23C 850s, with 300, 500, and 700 sigma level RH fields well below materialized cloud numbers ( ~60%), implying ample solar. The only thing we're missing here is truer longevity, where it cycles between an interim relaxation followed by resurge over a 7 to 10 day memory maker. That could materialize in future guidance, but for now ... the index floor doesn't appear to be as favorable for that. However, there are no huge cooler corrections signaled, either. The indices are more neutral - keeping in mind that they are less useful in summer. And the Euro and GFS have typical autumn troughs erroneously over Hudson Bay... which are not mass-field supported, nor demoing any continuity, run to run. The heights locally stay in the 582 dm range, either way, which connects to climo as AOA Impressive heat wave as is. Seldom do I recall - if ever - two days back to back on MEX with 101 at KFIT. This event has some bulk. Usually we're 94 for 4 days with one day to 99 typology. Not sure what our climatological "normal"/seasonal heat wave is but I know we don't typically succeed 100 two days running save for some rare historical events. We'll see where this lays out.
 -
Last year or 2022 for many in NJ
-
For EWR: # Days When 5 Jul 20–24, 2022 4 Jul 4–7, 2010 4 Jul 7–10, 1993 4 Aug 28–31, 1953 3 Jun 23–25, 2025 3 Jul 21–23, 2011 3 Aug 1–3, 2006 3 Aug 7–9, 2001 3 Jul 2–4, 1966 3 Aug 9–11, 1949 3 Jul 28–30, 1949
-
-
3rd / 4th / 5h : 6th : Opens blazing hot Fri/Sat - i still think most fireworks are uninterrupted with isolated to scatteered showers of course models focus thos storms in the 6pm - mid night timeframe, but its not widespread. Sunday looks to drop back and pending on clouds might break the heatwave. Monday remains a bit unsettled.
-
With no rain in the forecast I will confidently say 2.46” is my monthly total, far less than most of the county but my highest monthly total since August
-
Records: Highs: EWR: 103 (2021) NYC: 99 (1964) LGA: 100 (2021) JFK: 99 (1964) Lows: EWR: 55 (1940) NYC: 53 (1914) LA: 57 (1996) JFK: 56 (1988) Historical: 1792: The first recorded tornado in Canadian history struck the Niagara Peninsula between Foothill and Port Robinson, leveling some houses and uprooting trees between the communities. (Ref. Wilson Wx. History) 1816: The mean temperature for June 1816 in Philadelphia, PA was a record breaking 64°F (p.33 Washington Weather Book 2002 by Ambrose, Henry, Weiss) 1841: A tornado hit Danvers, Salem, and Marblehead, MA. During this severe weather event, small fish fell on a street in Boston. (Ref. Wilson Wx. History) 1886 - The second destructive hurricane in nine days hit the Apalachicola-Tallahassee area. (David Ludlum) 1900: The combination of high winds and the presence of wooded fuel-filled cargo helped to spread fire on the Hoboken Docks in New Jersey. The fire began when cotton bales caught fire and spread to nearby volatile liquids. The fire killed at least 300 people and was seen in New York City. 1901 Maximum temperature greater than 85° in Washington, DC from June 21st until July 7th, and greater than 90°F from 25th to 4th and 98° on 30th. (Ref. Washington Weather Records - KDCA) 1908: A huge fireball streaked across the sky during the early morning hours over Siberia. A huge explosion occurred in the air near the remote Stony Tunguska River. The explosion flattened trees for 40 miles around and killed wildlife, but no crater or meteorite fragments were ever found. (Ref. Wilson Wx. History) 1930: The Great Drought of 1930-1931 the year of 1930 was the driest year since the drought of 1869 to 1870. The drought caused $40 million dollars (1930 dollars) in losses to farmers in Maryland alone. Forest fires by the dry spell caused $580,000 in losses in Maryland. The precipitation deficit began in December 1929 and was fully classified as a drought by May of 1930. An extreme dry period set in from the end of June 1930 and continued through February 1931. During the 15-month period from December 1929 through February 1931, most places saw 60 percent or less of their normal rainfall. The average precipitation across Maryland and Delaware was 29.58 inches, which was 21.51 inches below normal. Baltimore recorded 27.31 inches for the 15-month period that was 23.03 inches below normal or 54% or normal. Washington, DC recorded 26.78 inches, which was 20.40 inches below normal or 57% below normal. The drought of 1998 to 1999 did not come near this severity, but it was the second severest drought of this century. The Palmer index, which is used to signal drought severity, classifies values of -3 to -4 as "severe drought" and values at -4 or less as "extreme drought". The Palmer Index for the region reached its lowest values during the end of the extreme dry period. In Maryland, west of the bay, Northern Virginia and the eastern panhandle of West Virginia, the Palmer Index was between -6.5 and -7.5 for January and February. Areas experienced up to 17 months of extreme drought conditions. The drought moderated some after February 1931 with periodic rains and showers through the summer months that helped the crops. However, these rains were not enough to restore the water table and water flow levels. Officially the drought did not end until about May 1932. 1942 - The temperature at Portland, OR, hit 102 degrees, an all-time record for that location. (The Weather Channel) 1949: Only 0.02 inches of rain fell at Central Park in New York City for its driest month on record. (Ref. Wilson Wx. History) 1968: A cloudy June came to an end in Sault Ste. Marie, MI. Not one clear day was observed during the month. (Ref. Wilson Wx. History) 1972: The entire state of Pennsylvania was declared a disaster area as a result of the catastrophic flooding caused by Hurricane Agnes, which claimed 48 lives, and caused 2.1 billion dollars damage. (The Weather Channel) 1972 - The entire state of Pennsylvania was declared a disaster area as a result of the catastrophic flooding caused by Hurricane Agnes, which claimed 48 lives, and caused 2.1 billion dollars damage. (The Weather Channel) 1978: Havre, MT measured a wind gust to 138 mph from a severe thunderstorm. (Ref. Wilson Wx. History) 1986: Thunderstorms produced large hail and high winds in southwest South Dakota. During the afternoon hours hail up to the size of baseballs pounded Ellsworth Air Force base near Rapid City. 20 people were hurt at the Air Force Base as the hail broke over one thousand windows. Hail was 3 to 6 inches deep on the roads in Spearfish Canyon in the Black Hills and snowplows needed to be called out to clear the roads. 1986: Today marked the end of the driest six months on record for the Athens, GA area since records began in 1845. The six month precipitation total at Athens was 11.23 inches compared to the normal of 27.33 inches. This also marked the end of the driest six months on record for Lynchburg, VA, with only 9.43 inches measured. Where as San Antonio, TX had their wettest June on record with 11.95 inches of rain besting the previous record of 10.44 inches set back in 1973. (Ref. Wilson Wx. History) 1987 - Hot weather prevailed in the Pacific Northwest, with readings above 100 degrees reported as far north as southern British Columbia. Yakima, WA, reported a record high of 100 degrees, while temperatures near the Washington coast hovered near 60 degrees all day. Thunderstorms prevailed from southwest Texas to New England. Thunderstorm winds gusting to 100 mph at Gettysburg, PA, killed one person. High winds and large hail caused more than five million dollars damage to property and crops in Lancaster County, PA. (The National Weather Summary) (Storm Data) 1988 - Thunderstorms in eastern Kansas drenched Worden with 12.21 inches of rain, and a wall of water two to four feet deep swept through Lone Star, KS, flooding every home in the town. Up to ten inches of rain was reported southeast of Callaway, NE. Thunderstorm winds gusted to 75 mph at Winfield, KS. Seventeen cities in the north central and northeastern U.S. reported record low temperatures for the date, including Duluth, MN, with a reading of 36 degrees. (The National Weather Summary) (Storm Data) 1989 - Winnfield, LA, reported 22.52 inches of rain in three days, and more than thirty inches for the month, a record for June. Shreveport LA received a record 17.11 inches in June, with a total for the first six months of the year of 45.55 inches. Thunderstorms also helped produce record rainfall totals for the month of June of 13.12 inches at Birmingham AL, 14.66 inches at Oklahoma City, OK, 17.41 inches at Tallahassee FL, 9.97 inches at Lynchburg, VA, and more than 10.25 inches at Pittsburgh, PA. Pittsburgh had also experienced a record wet month of May. (The National Weather Summary) 1991: Five inch diameter hailstones bombarded a spot near the town of Hathaway, MT. (Ref. Wilson Wx. History) 1992: 399 tornadoes occurred across the U.S. during June. This set a new record for the greatest number of tornadoes in a single month up to that time (this record was broken in May 2003). (Ref. Wilson Wx. History) 1993: Across parts of South Dakota, June of 1993 was a cool and wet month. In Iowa, temperatures averaged nearly three degrees below normal while precipitation averaged 8.09 inches, which is 3.67 inches above normal. Le Mars was one of only two stations which recorded below normal rainfall for June of 1993, but still received 3.09 inches. Not too far away though, Estherville recorded its wettest month on record with an astounding 13.49 inches. 1993: Mississippi River levels rose dramatically during the last half of the month. On the Upper Mississippi River basin near the Quad Cities, river levels rose above major flood levels which occurred in 1965 and 1973. (Ref. Wilson Wx. History) 1994: El Paso, TX soared to 114° to break their all-time record high temperature, again. A record high of 113° was just set on the 27th and 28th of this month. (Extreme Weather p. 277, by Christopher C. Burt - The 1981 record) (Ref. Wilson Wx. History) 1999: Mount Baker, Washington closed out a record snowfall season both for the United States and the verifiable world record as the seasonal total from July 1, 1998, to June 30, 1999, finished with 1,140 inches. 2001: A severe thunderstorm at 1 AM produced baseball size hail and 80 mph winds at Ashland, MT. The storm had tops up to 70,000 feet. There were many smashed windows and windshields and birds killed. (Ref. Wilson Wx. History) 2003: Tropical Storm Bill added to the second wettest June ever at New Orleans, LA by dropping over 4.50 inches of rain, bringing the monthly total to 17.37 inches. This was just shy of the all-time wettest June ever, which occurred in 2001, when 17.62 inches fell. New York City, NY closed out the month with a record amount of rain for any June as 10.27 inches fell, nearly three times the normal monthly amount of 3.84 inches. (Ref. Wilson Wx. History) 2005: June had 13 days with 90°F or above temperatures which ties the old record set in 1994. (Ref. Annandale Weather Records - KRIC) 2005: Lightning injured five campers at Loft Mountain Campsite in the Shenandoah National Park (Albemarle County). (Ref. Lightning - Virginia Weather History) 2005: A derecho produced 80 mph winds and damaged several homes/structures in S Crawford County (KS). 2 women were hurt as winds destroyed a mobile home between McCune and Cherokee. One of the women was critically injured when “scalped” by flying debris. (Ref. Weather Guide Calendar with Phenomenal Weather Events 2011 Accord Pub. 2010, USA) 2010: The hottest June on Record! The Richmond International Airport reported the mean temperature for June was 81.1 °F which was a new 113 year record. This breaks the old record of 79.2 °F set in 1943 and was a +8.7 °F departure from average. June had 8 new daily temperature records and all were for heat. Both June 27th and 28th had a maximum temperature 102 °F. Richmond has never had back to back 102 °F days before in June. Only three June days have been hotter: (June 30, 1937 103 °F) (June 19, 1944 103 °F) (June 26, 1952 104 °F ) June 2010 also had 19 days of 90 °F or higher temperatures the record was 20 in 1943. June had only 0.82 inches rainfall making it the second driest in 113 years only 1980 was drier with only 0.38 inches and with the heat made severe drought conditions. (Ref. Richmond Weather Records - KRIC) 2010: Both Philadelphia, Pennsylvania, and Washington, D.C. recorded their hottest Junes, with the thermometer in Philadelphia averaging 5.9°F above normal for the month. Miami, Florida notched not just its hottest June, but its hottest month on record. (Ref. Weatherwise U.S. Weather Highlights of 2010 page 8 ) 2011: Chicago got hammered with 2-inch hail (that damaged cars/police cars) and up to 800 lightning strikes in 10 minutes! This storm caused 94 mph in a harbor on Lake Michigan just north of the city and a funnel cloud was spotted.(Ref. Images by John Koontz) (Ref. Amazing You-Tube Video of a Very Close Lightning Strike) (Ref. NWS Tells the Complete Story in a 5 Min. Movie) 2015: The heat was a big story for us throughout the month of June. It may come as no surprise then that this was one of the warmest Junes on record in Richmond. Our average temperature was 77.92° for the month. That was high enough to place June 2015 as the 8th warmest June in Richmond since record-keeping began in 1880. Richmond International Airport normal average temperature is 74.3°F. Richmond's (Ref. NWS Wakefield) 2021: An intense late-June heat wave peaked across the Northeast on June 30, 2021, as a powerful upper-level ridge sent temperatures soaring into the upper 90s and lower 100s. Newark Liberty International Airport (EWR) reached 103°F, setting its hottest June temperature on record, while LaGuardia Airport (LGA) climbed to 101°F, tying its hottest June reading ever. Central Park reached 98°F, and Boston hit 100°F, marking its hottest June temperature on record. The remarkable heat capped one of the warmest Junes ever observed across much of the Northeast and produced numerous daily and monthly temperature records from New Jersey through southern New England.