All Activity
- Past hour
-
Thats wonderful
-

Central PA Fall Discussions and Obs
canderson replied to ChescoWx's topic in Upstate New York/Pennsylvania
Those are transformers popping -
Things our region actually does well: Humid in the summer Warm/wet, cold/dry in the winter
-
 Until Will comes back there’s nothing . Find other things to do
 -

November 2025 general discussions and probable topic derailings ...
CoastalWx replied to Typhoon Tip's topic in New England
You’ve been below normal too, as I said, we just haven’t had cold lows. -
Was a great storm but that was it for the winter
-

November 2025 general discussions and probable topic derailings ...
BrianW replied to Typhoon Tip's topic in New England
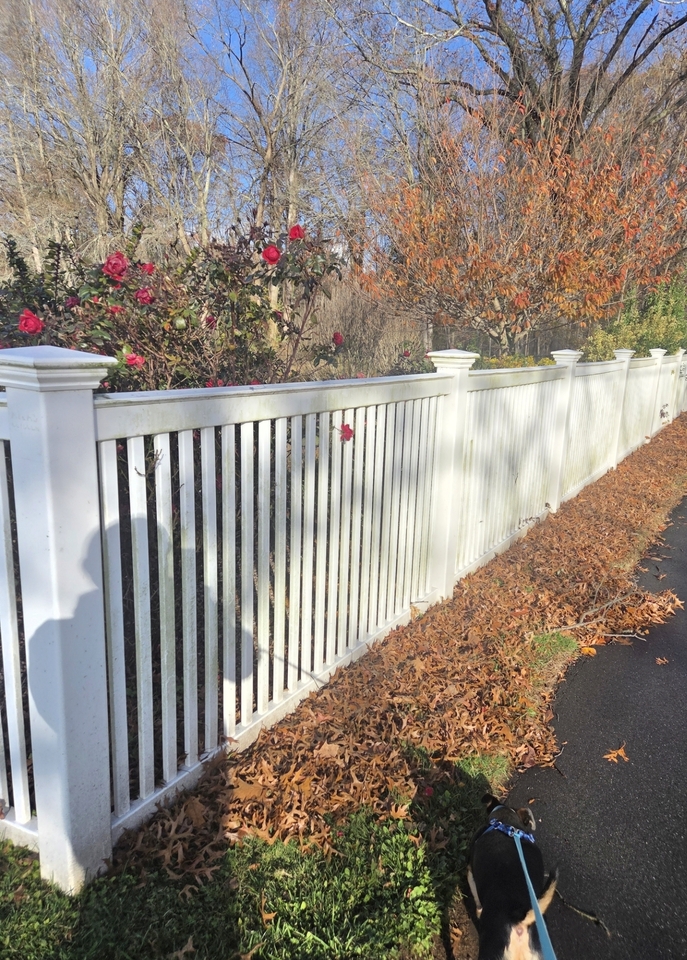
Maybe up north? There still hasn't been a killing frost here. Just took the dog for a walk and could smell my neighbor's roses that are in full bloom..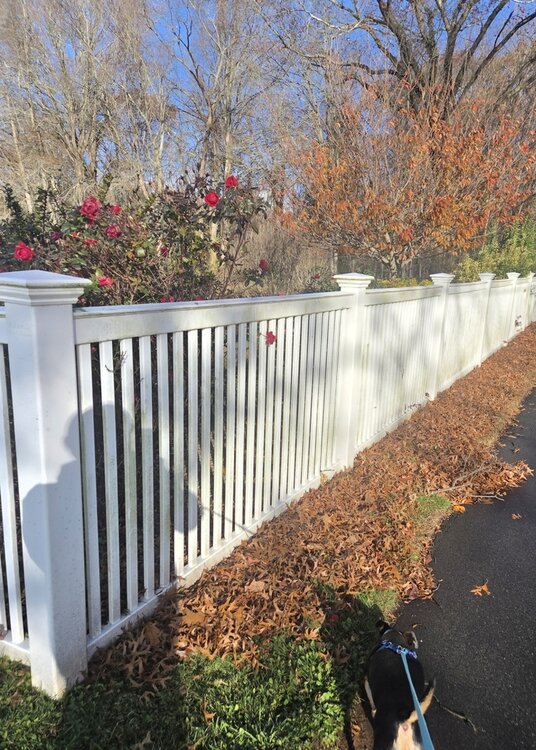
-
That storm and the afternoon snowstorm just before St. Patrick’s Day back in March, 2018 were the hardest I ever saw it snow in my life. Both were literal whiteouts for hours
-
 KTEB and KLGA 40-41 KT past hour and many reports DCA/Philly and far S NJ 40-43 kt. Post 1015 am
 -

Central PA Fall Discussions and Obs
Jns2183 replied to ChescoWx's topic in Upstate New York/Pennsylvania
The wind sounds like mini explosions going off Sent from my SM-G970U1 using Tapatalk -
2000 through 2018 seemed like every single snow event at least clipped central park, mimicking 1955 through 1969. 1970 through 1999 it was the complete opposite where it felt like snow was impossible to come by for central park. Mimicking 2019 through today. In fact the 30 year central park snowfall average for 1970 through 1999 is not far off from 2019 through last winter. Not saying this period will last 30 years as well, however, there were 5 good winters in that 30 year period, so we should see a few until the next good period arrives (we already had 2020/2021, so just 4 more above average snowfall winters and we match 1970 through 1999).
-
They already had snow and this seems not that uncommon for them to have snow before the first freeze. Heat Island.
-

November 2025 general discussions and probable topic derailings ...
SnoSki14 replied to Typhoon Tip's topic in New England
If that trough buries out west then we're screwed. I suspect we'll get some cold intrusions given the -EPO but looks very meh overall. -
Bayesian stats ftw
-
The 2011-12 winter had a +PNA for both December and January…that’s a surprise. I thought that was a predominant -PNA winter
-

Central PA Fall Discussions and Obs
Voyager replied to ChescoWx's topic in Upstate New York/Pennsylvania
They're down at Canderson's place waiting so they can travel together with his cans... -
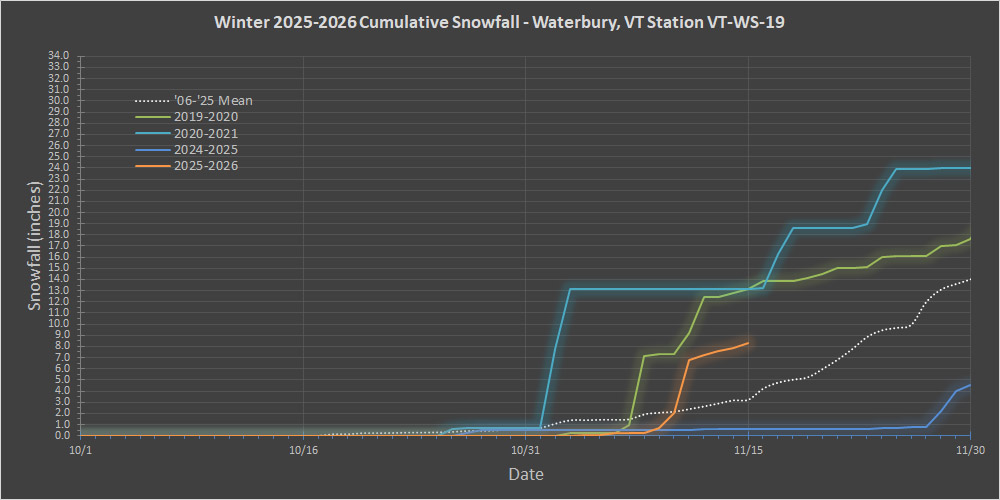
I haven’t done a valley snowfall update yet this season, but now that we’ve reached the middle of the month and the snows have been rolling along well in both the mountains and the valleys, it’s probably a decent time. Last season was certainly solid as a whole with over 200” of snow here in the valley, but November was actually one of the weak spots, at least in the lower elevations. We only had 4” of snow (the lowest November snowfall total in almost 10 years), which is well below average, and most of it came at the end of the month as we were moving into December (you can see how the blue line in the plot below compares to the dotted white line for average snowfall progression). This season (orange line in the plot is off to a solid, above-average start, but up to this point it hasn’t been in the league of seasons like 2019-2020 or 2020-2021. The valley snows this season did seem to hit quick and hard (I hadn’t even finished blowing the last few leaves off the lawn or put out the driveway marker poles), so I was curious to see where we stood with respect to snowpack. The current snowpack started up on the 11th of the month, which is on the early side, so I was curious to see where it would sit if it were to persist into the winter. It turns out that if it does persist, it wouldn’t be a record, since the continuous winter snowpack for the 2019-2020 season started on November 8th, and even the 2018-2019 season snowpack started on November 10th. The past five seasons have had more typical/average snowpack starts at the end of November/beginning of December, which probably gives the early feeling to this season. Part of what’s helped jumpstart this season was simply being in that zonal flow for a while this month with modest storms/clippers passing through the area. And it looks like temperatures for Morrisville have come in right around average for the first half of the month (departure of -0.1 F), which shows that even average November temperatures can produce some decent snows for both the mountains and the valleys. That got me thinking about the weather patterns around here. More and more, I’m seeing the value of these zonal patterns with respect to getting, and more importantly, keeping snow and retaining snow quality. Every year it becomes more apparent that highly amplified patterns are just so much riskier – you basically have this narrow window/slot of storm tracks where you can get some big storms, and an average of 50% of the time you risk a storm passing to the west and putting the area in the warm sector and damaging the snowpack. The discussions around here so often cast “zonal flow” as bad, annoying, unwanted, whatever, but if zonal/average flow is not good, then that’s essentially saying “average” weather is not good. That’s a scary statement with respect to an area’s winter/snow climatology if even “average” isn’t good enough – it would suggest that only a subset of weather patterns (probably well under 50%) are going to be decent, and more often than not you’re really just going to end up with something else.
-
November 2025 general discussions and probable topic derailings ...
CoastalWx replied to Typhoon Tip's topic in New England
I mean we’ve had a cool few weeks. Highs certainly BN, we just haven’t had insanely cold lows. -
I just looked up -ENSO winters with a -PNA in Dec to see how often it went to a +PNA in Jan. In what winters did this occur? -1954-5: -0.52 to +0.40 -1962-3: -0.08 to +0.58 -1983-4: -0.31 to +0.97 -1984-5: -1.60 to +1.63 -1996-7: -1.23 to +0.63 -1998-9: -0.09 to +0.16 -2008-9: -1.41 to +0.61 -2010-11: -1.78 to +1.29 -2012-3: -1.01 to +0.55 -2013-4: -0.86 to +0.97 -2016-7: -0.35 to +0.28 -2021-2: -2.56 to +1.01 -2022-3: -0.66 to +0.22 So, although it wasn’t common from 1954-5 through 1971-2, when only 2 of 9 (22%) switched, here’s something that just blew my mind: -ALL 11 -ENSO -PNA Decs since 1983-4 switched to +PNA Jans (listed above)! -These 11 averaged +0.76 in January! -Now, check out the -ENSO Jan PNAs since 1983-4 that had a +PNA in Dec: 1) 1985-6 went from +1.39 to +0.97 2) 1988-9 went from +0.63 to -0.72 3) 1995-6 went from +0.92 to -0.02 4) 1999-00 went from +0.21 to -0.82 5) 2000-01 went from +1.23 to +1.51 6) 2001-2 went from +0.56 to -0.04 7) 2005-6 went from +1.38 to -0.43 8) 2007-8 went from +0.14 to -0.32 9) 2011-2 went from +0.36 to +0.60 10) 2017-8 went from +0.89 to +0.40 11) 2020-1 went from +1.58 to +0.19 12) 2024-5 went from +1.70 to +1.05 -So, for these 12 -ENSO Decs since 1983-4 with a +PNA, only 50% also had a +PNA in Jan. -So, since 1983-4, whereas only 50% of the 12 -ENSO Decs with a +PNA also had a Jan +PNA, 100% of the 11 -ENSO Decs with a -PNA in Dec went to a +PNA in Jan! Thus, having a -PNA in Dec during -ENSO since 1983-4 has, if anything, meant a big increase in the chance for a +PNA in Jan whether random or not! I didn’t know this til just now. Link to monthly PNAs back to 1950: https://www.cpc.ncep.noaa.gov/products/precip/CWlink/pna/norm.pna.monthly.b5001.current.ascii.table @donsutherland1
-
Strong winds continue to be the big story this month with all the lows racing through the Eastern Great Lakes and New England.
-
November 2025 general discussions and probable topic derailings ...
CoastalWx replied to Typhoon Tip's topic in New England
It’s gonna be well under 50 tomorrow. Take the under for a few days there. That’s also N to BN there. -

November 2025 general discussions and probable topic derailings ...
Torch Tiger replied to Typhoon Tip's topic in New England
Yeah turkey pop is up up up. everywhere you go it's huge flocks -

November 2025 general discussions and probable topic derailings ...
powderfreak replied to Typhoon Tip's topic in New England
Isn’t the normal high for BDL still 52F right now? And that’s for the south shore? Looks normal, no? -
 That's exactly average for BDR. Torch is after that with the cutters. Average high is 53 down 50 through day 10 and average low is 38 down to 36 by day 10.
 -
I just looked up -ENSO winters with a -PNA in Dec to see how often it went to a +PNA in Jan. In what winters did this occur? -1954-5: -0.52 to +0.40 -1962-3: -0.08 to +0.58 -1983-4: -0.31 to +0.97 -1984-5: -1.60 to +1.63 -1996-7: -1.23 to +0.63 -1998-9: -0.09 to +0.16 -2008-9: -1.41 to +0.61 -2010-11: -1.78 to +1.29 -2012-3: -1.01 to +0.55 -2013-4: -0.86 to +0.97 -2016-7: -0.35 to +0.28 -2021-2: -2.56 to +1.01 -2022-3: -0.66 to +0.22 So, although it wasn’t common from 1954-5 through 1971-2, when only 2 of 9 (22%) switched, here’s something that just blew my mind: -ALL 11 -ENSO -PNA Decs since 1983-4 switched to +PNA Jans (listed above)! -These 11 averaged +0.76 in January! -Now, check out the -ENSO Jan PNAs since 1983-4 that had a +PNA in Dec: 1) 1985-6 went from +1.39 to +0.97 2) 1988-9 went from +0.63 to -0.72 3) 1995-6 went from +0.92 to -0.02 4) 1999-00 went from +0.21 to -0.82 5) 2000-01 went from +1.23 to +1.51 6) 2001-2 went from +0.56 to -0.04 7) 2005-6 went from +1.38 to -0.43 8) 2007-8 went from +0.14 to -0.32 9) 2011-2 went from +0.36 to +0.60 10) 2017-8 went from +0.89 to +0.40 11) 2020-1 went from +1.58 to +0.19 12) 2024-5 went from +1.70 to +1.05 -So, for these 12 -ENSO Decs since 1983-4 with a +PNA, only 50% also had a +PNA in Jan. -So, since 1983-4, whereas only 50% of the 12 -ENSO Decs with a +PNA also had a Jan +PNA, 100% of the 11 -ENSO Decs with a -PNA in Dec went to a +PNA in Jan! Thus, having a -PNA in Dec during -ENSO since 1983-4 has, if anything, meant a big increase in the chance for a +PNA in Jan whether random or not! I didn’t know this til just now. Link to monthly PNAs back to 1950: https://www.cpc.ncep.noaa.gov/products/precip/CWlink/pna/norm.pna.monthly.b5001.current.ascii.table