All Activity
- Past hour
-
Augdewst 2026: Summer's Last Stand
WxWatcher007 replied to Prismshine Productions's topic in New England
Beautiful summer day out there -
Close, CVG topped out at 70. Only topped out at 70 here, too. Got 1.13" more of rain here yesterday. Now at 5.91" for the month so far, currently the 9th wettest August on record. Top 10 Wettest Augusts (KDAY) 1. 8.03" - 1974 2. 7.95" - 1979 3. 7.54" - 1995 4. 6.98" - 1978 5. 6.64" - 1912 6. 6.59" - 1926 7. 6.42" - 1982 8. 6.40" - 2001 9. 5.91" - 2026 (as of 8/12) 10. 5.56" - 1906
-
I'll b waitin
-
(002).thumb.png.6e3d9d46bca5fe41aab7a74871dd8af8.png) Mike, this is in my view the most useful thing anyone has put in this thread, and it changes my position on several points. Thank you for doing the archival work rather than just asserting it. Taking your points in order. You're right that "undocumented" in the algorithm's metadata linkage is not the same as "no documentation exists." I was treating the two as equivalent and that was a wee bit sloppy. Your figure shows some actual events behind most of the Coatesville breaks, and the burden argument is fair — I shouldn't claim an absence of records without going through the 530-1s, the deeds and the aerials first. I hadn't. You had - thanks!. You're also right that a high rate of undocumented detections is expected from a detector built to catch undocumented changes, so the 86% figure doesn't carry the weight I was giving it. I'd already dropped that argument after NCEI sent me their changepoint list for this station — it shows 4 of 12 linked to documented events, not zero, so the Berkeley code counts were never a good proxy for what the PHA is doing. On the ramp point: Mike - you're right - many small stacked breaks produce a ramp-shaped cumulative. I proved your point without meaning to — cumulating NCEI's twelve discrete changepoints gives a series that fits a straight line at r-squared 0.495. That's a stack of steps looking smooth, exactly as you say. Zero-adjustment stations and the diurnal range point are both fair points also. A detector leaving clean stations alone is working, and DTR divergence is a studied phenomenon rather than a contradiction. And I accept that a handful of stations in one county is a noisy sample by nature. Now a couple things I will push back on a little, not on it's substance but on how firmly you state it. Your own figure marks 1920 unresolved. And I'd read the 1959-1976 group differently to the header on it. The box says five breaks, but NOAA only has two in that window — 1959 and 1971. The other three are BEST-only. And BEST's five nearly cancel: -0.50, +0.37, +0.02, +0.72, -0.71 comes to -0.10 F net across seventeen years, which isn't doing much work. NOAA's two come to +0.40 F, and that's the direction you'd correct for spurious cooling, not for a station warming under encroaching infrastructure. Which brings me to the part I can't pull together. The station moves to progressively cooler sites implies the raw acquires spurious cooling and needs the later data warmed — which matches what NOAA applied. Infrastructure growing up around the site implies the opposite. Both are in your account of this window. Which one do you think is actually driving it? For what it's worth, your 1959 and 1971 values match NCEI's changepoint list for this station exactly once converted — -0.54 and +0.94 F against -0.28 and +0.53 C. So we're working from the same PHA output, which is worth knowing! Thanks again Mike!! That window also stops something I was about to post. I ran a segmented breakpoint analysis on the raw daily data and it attributed only one concordant discontinuity to Coatesville, January 1973. I then fitted the 1952-82 trend with that single step in the model. If there are more real breaks in that window, my model is under-specified and the number isn't worth quoting. I'm going to refit it against the full break set before I use it. If it doesn't survive, I'll say so here. Stay tuned for that later! The one thing still open is narrower and comes out of NCEI's own files rather than the station history. Cumulating their twelve changepoints reproduces +0.123 C/decade of adjustment trend. The actual adjusted-minus-unadjusted trend for the same station and years is +0.184. About a third isn't in any listed changepoint. It isn't rounding, and it isn't run-to-run variation — I compared two pulls of the adjusted series two days apart and they were identical across all 119 years at West Chester. I've asked NCEI what accounts for it rather than guessing, and I'll post their answer either way. I sent the email this morning to my contact there...stay tuned for more of that later! Now my ask - would you be willing to share your compiled 530-1 and deed work for Coatesville, and whatever you have for West Chester? I'd rather build on it than duplicate it badly, and I'll take your point about the 1978, 1982 and 1988 West Chester breaks — the Daily Local should have left a trail worth chasing. Charlie, I think most of the above answers you as well. You were right that a 35-year regression is not a breakpoint test, and running it properly is what led here. On 1945-49 specifically, NCEI's list has a documented move at 1946-01 with a +0.79 C step, so something documented did happen there. I still can't test that window myself — only three Chester County stations cover 1930-1975 with continuity and attribution needs four — so at this point we can't claim it either way. Paul
Mike, this is in my view the most useful thing anyone has put in this thread, and it changes my position on several points. Thank you for doing the archival work rather than just asserting it. Taking your points in order. You're right that "undocumented" in the algorithm's metadata linkage is not the same as "no documentation exists." I was treating the two as equivalent and that was a wee bit sloppy. Your figure shows some actual events behind most of the Coatesville breaks, and the burden argument is fair — I shouldn't claim an absence of records without going through the 530-1s, the deeds and the aerials first. I hadn't. You had - thanks!. You're also right that a high rate of undocumented detections is expected from a detector built to catch undocumented changes, so the 86% figure doesn't carry the weight I was giving it. I'd already dropped that argument after NCEI sent me their changepoint list for this station — it shows 4 of 12 linked to documented events, not zero, so the Berkeley code counts were never a good proxy for what the PHA is doing. On the ramp point: Mike - you're right - many small stacked breaks produce a ramp-shaped cumulative. I proved your point without meaning to — cumulating NCEI's twelve discrete changepoints gives a series that fits a straight line at r-squared 0.495. That's a stack of steps looking smooth, exactly as you say. Zero-adjustment stations and the diurnal range point are both fair points also. A detector leaving clean stations alone is working, and DTR divergence is a studied phenomenon rather than a contradiction. And I accept that a handful of stations in one county is a noisy sample by nature. Now a couple things I will push back on a little, not on it's substance but on how firmly you state it. Your own figure marks 1920 unresolved. And I'd read the 1959-1976 group differently to the header on it. The box says five breaks, but NOAA only has two in that window — 1959 and 1971. The other three are BEST-only. And BEST's five nearly cancel: -0.50, +0.37, +0.02, +0.72, -0.71 comes to -0.10 F net across seventeen years, which isn't doing much work. NOAA's two come to +0.40 F, and that's the direction you'd correct for spurious cooling, not for a station warming under encroaching infrastructure. Which brings me to the part I can't pull together. The station moves to progressively cooler sites implies the raw acquires spurious cooling and needs the later data warmed — which matches what NOAA applied. Infrastructure growing up around the site implies the opposite. Both are in your account of this window. Which one do you think is actually driving it? For what it's worth, your 1959 and 1971 values match NCEI's changepoint list for this station exactly once converted — -0.54 and +0.94 F against -0.28 and +0.53 C. So we're working from the same PHA output, which is worth knowing! Thanks again Mike!! That window also stops something I was about to post. I ran a segmented breakpoint analysis on the raw daily data and it attributed only one concordant discontinuity to Coatesville, January 1973. I then fitted the 1952-82 trend with that single step in the model. If there are more real breaks in that window, my model is under-specified and the number isn't worth quoting. I'm going to refit it against the full break set before I use it. If it doesn't survive, I'll say so here. Stay tuned for that later! The one thing still open is narrower and comes out of NCEI's own files rather than the station history. Cumulating their twelve changepoints reproduces +0.123 C/decade of adjustment trend. The actual adjusted-minus-unadjusted trend for the same station and years is +0.184. About a third isn't in any listed changepoint. It isn't rounding, and it isn't run-to-run variation — I compared two pulls of the adjusted series two days apart and they were identical across all 119 years at West Chester. I've asked NCEI what accounts for it rather than guessing, and I'll post their answer either way. I sent the email this morning to my contact there...stay tuned for more of that later! Now my ask - would you be willing to share your compiled 530-1 and deed work for Coatesville, and whatever you have for West Chester? I'd rather build on it than duplicate it badly, and I'll take your point about the 1978, 1982 and 1988 West Chester breaks — the Daily Local should have left a trail worth chasing. Charlie, I think most of the above answers you as well. You were right that a 35-year regression is not a breakpoint test, and running it properly is what led here. On 1945-49 specifically, NCEI's list has a documented move at 1946-01 with a +0.79 C step, so something documented did happen there. I still can't test that window myself — only three Chester County stations cover 1930-1975 with continuity and attribution needs four — so at this point we can't claim it either way. Paul -
Some steady light anvil rain with some distant thunder. Pretty cool looking comma head on the radar in Iowa earlier.
-
Well that does seem like the 2 options. Probably no middle ground, so weird that he sorta averaged them together lol
-

Arctic Sea Ice Extent, Area, and Volume
Prismshine Productions replied to ORH_wxman's topic in Climate Change
Wtf happened here in Antarctica to lose over 300k... shelf calfing? Sent from my SM-S176V using Tapatalk -
DP's still 70 here
-
2026-2027 Record-breaking El Nino
40/70 Benchmark replied to Stormchaserchuck1's topic in Weather Forecasting and Discussion
Probably @Typhoon Tiplol -

2026-2027 Record-breaking El Nino
michsnowfreak replied to Stormchaserchuck1's topic in Weather Forecasting and Discussion
I believe that was the case in Feb 2015. I don't remember who, but someone had a meltdown with the historic cold because it was warm elsewhere in the globe, saying this is the worst thing for Americans who mock cc. -
2026-2027 Record-breaking El Nino
michsnowfreak replied to Stormchaserchuck1's topic in Weather Forecasting and Discussion
I thought i was reading backwards. "Poor guy" . HE was a complete dick, not the other way around. -
Sunday still looks like it has a chance. Maybe next Thursday too?
- 1,891 replies
-
- 1
-

-
- severe
- thunderstorms
- (and 7 more)
-
Raindrop is an excellent quick reference. I have been using it for probably 6 months. This radar indicated output can sometimes be a little too heavy compared to actual gauge measurement. My radar indicated data is probably different than yours, because my scan is near 13000 ft. I often compare radar vs. gauge measurement.
-
 https://mexisaferx.shop/# mexican pharmacys
 -
mexican mail order pharmacy and mexican pharmacy that ships to the us the purple pharmacy mexico http://www.leimbach-coaching.de/url?q=https://mexisaferx.com mexican pharmacy that ships to the us or http://clubdetenisalbatera.es/user/ffvynmqkta/ pharmacy in mexico [url=https://images.google.tn/url?sa=t&url=https://mexisaferx.com]pharmacys in mexico[/url] progreso, mexico pharmacy online or [url=https://www.0468wudi.com/home.php?mod=space&uid=246950]order meds from mexico[/url] the purple pharmacy mexico
-
Chicago NWS UPDATE... Issued at 1106 AM CDT Thu Aug 13 2026 Mosaic radar imagery shows a broad swath of rain showers moving east through Iowa and into southwestern Wisconsin and western Illinois. Notably, DVN radar shows a distinct curl from an MCV just south of Grandview as it crosses the Mississippi River. Recent mesoanalysis shows a low level instability gradient from Muscatine, IA to Fowler, IN. This remains the favored corridor that the system would likely want to travel along, and any storm movement east of this gradient in the forecast area would be expected to lose strength. Even as the complex loses strength over the area, stratiform rain is expected to spread over Illinois and northwest Indiana. Therefore, the forecast was adjusted to increase PoPs all the way up to the Wisconsin stateline through the afternoon for the increasing chances for widespread rain. However, the focused area for thunder remains southwest of Oregon to Morocco line. Wind shear is fairly marginal (localized up to 30 knots), but there is a stout DCAPE gradient from southern LaSalle to Benton County increasing southward to over 1000 J/kg. It will be this area that has the best probability for localized strong to potentially severe wind gusts, but confidence remains low.
-

Augdewst 2026: Summer's Last Stand
dendrite replied to Prismshine Productions's topic in New England
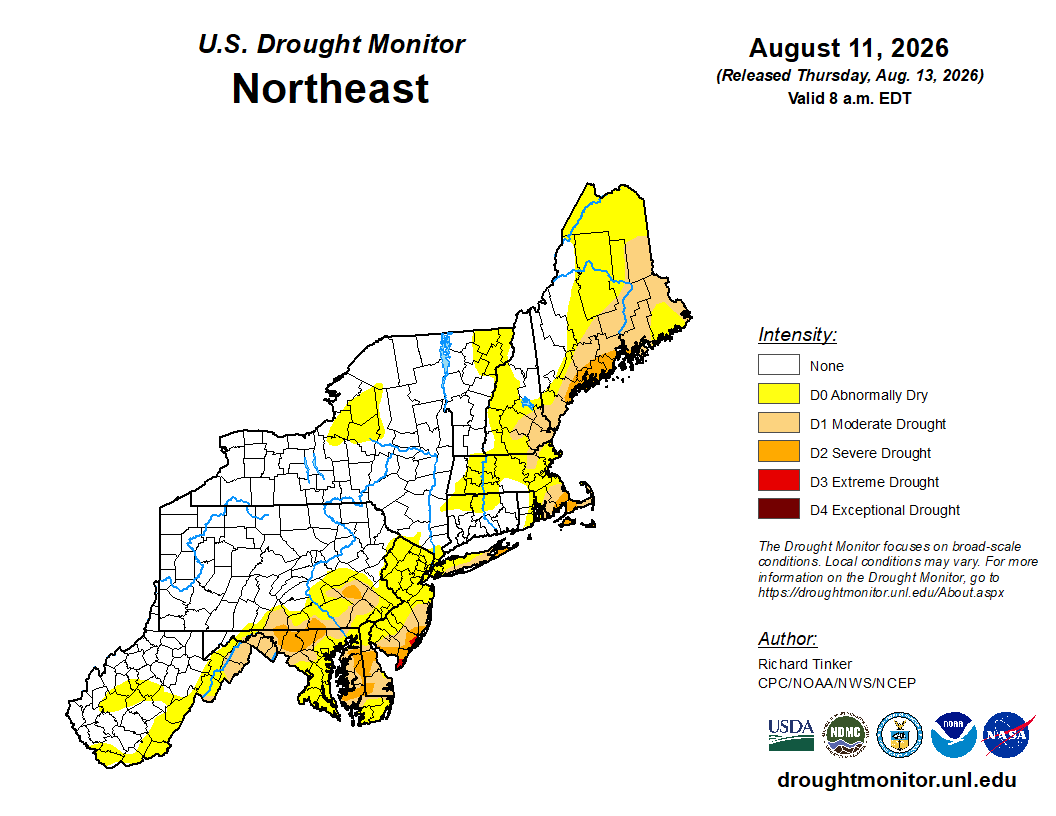
Someday the great drought will end.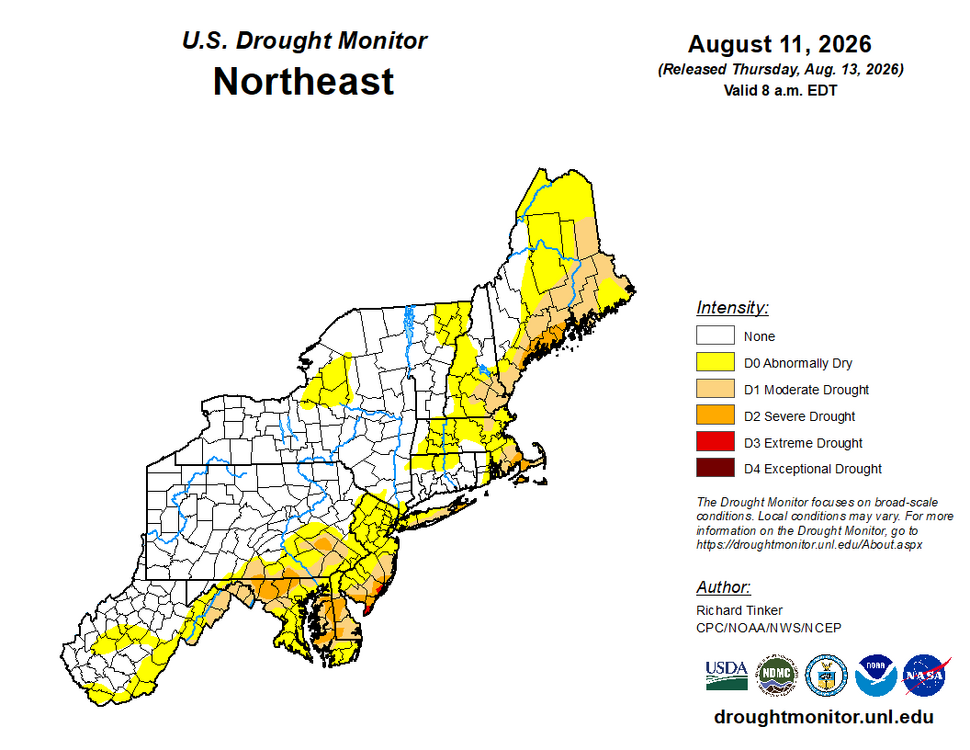
-
The U.S. Drought Monitor has been correcting weekly recently, gradually eliminating the Extreme Drought category in Virginia. This mornings update completely removes Extreme Drought from Augusta County. The 9 am version puts most of Augusta County in Severe Drought, with Moderate Drought west of Churchville and near Harriston. This is the first time in 2 months that the Monitor has been close to correct.
-
Yes, the ""tor psbl" tag gives a lot more leeway yet covers the threat just the same. It is a good "in-between" and works b/c now we know there are so many little spin-ups in SQLN situations. Some are very transient, but still can do damage. Then you have gustnadoes w/ can be up to EF1 strength, but do not count as tornadoes unless they connect to the cloud base, which often not easy to determine in the more moist environment and less visibility compared to the Plains.
-
JB’s top 6 analogs show what we’re facing. 3 has an HECS storm. The other 3 were snowless winters.
-
Ugh. How is this not getting more backlash? Seems to be a pretty big deal to me.
-
This Aug 1871 hurricane made landfall on the Big Island as an estimated Cat 3. Details analysis here: https://journals.ametsoc.org/view/journals/bams/99/1/bams-d-16-0333.1.xml
-
2 inches more than me. Of course the drought monitor says it has lessened.
-
2026-2027 Record-breaking El Nino
40/70 Benchmark replied to Stormchaserchuck1's topic in Weather Forecasting and Discussion
That JMA output is textbook Modoki composite. Again, I think that is overdone in the seasonal mean, but it is what it is. -
I sense we're incrementally inching closer, year by year, to the 'winter it didn't snow' Up N that's more likely just a shockingly low season total, but ranging to a phatty 0 at LGA and Logan. ORH got 1.5" of glop on January 7th and white pawed their way to more climate denial excuses. Sardonic aside, eventually that does have to happen. It'll be once ...then 5 years goes by, a span that host so-so's and one winter that is phenomenal, as much for snow as it will be enabling. Then, it happens again so soon? huh. Eventually ... they're happening more frequently and viola, "we're not Va Beach" This is a toad in the pan thing -