All Activity
- Past hour
-
100%
-

2026-2027 Record-breaking El Nino
GaWx replied to Stormchaserchuck1's topic in Weather Forecasting and Discussion
Please post banter or garbage here: -
Any year now I'm expecting tarantulas and scorpions to be roaming SNE! Lol
-
Maybe they’re saving cap space so we can get two more relievers that should be in the Charlie Brown league.
-
Popping towers but definitely looks like its ingested some dry air over the past couple hours.
-
Post banter here so readers of the main El Niño thread will be able to locate the good quality posts without having to sift through lots of garbage to find them.
-
Ughhhhh I knew this was bound to happen. They’re just getting bigger and deadlier here. Adapting to our climate and just relocating from other areas. https://www.wtnh.com/news/connecticut/new-haven/venomous-spider-species-documented-in-connecticut-for-the-first-time/?utm_medium=social&utm_source=facebook_WTNH_News_8&fbclid=IwZnRzaAUzh-hleHRuA2FlbQIxMQBwZG9mBWZkaWQWUP0fgIBV4YT5gAujHlk__9yP03ilPXNydGMGYXBwX2lkCjY2Mjg1NjgzNzkAAR46RL7csvZP_EevojJ70Jc8_yzDkguN2GZP_lfF_0i9ITCVH690hW3pJK0g_w_aem_afEitbdedFZMbV3_6lCdUA
-
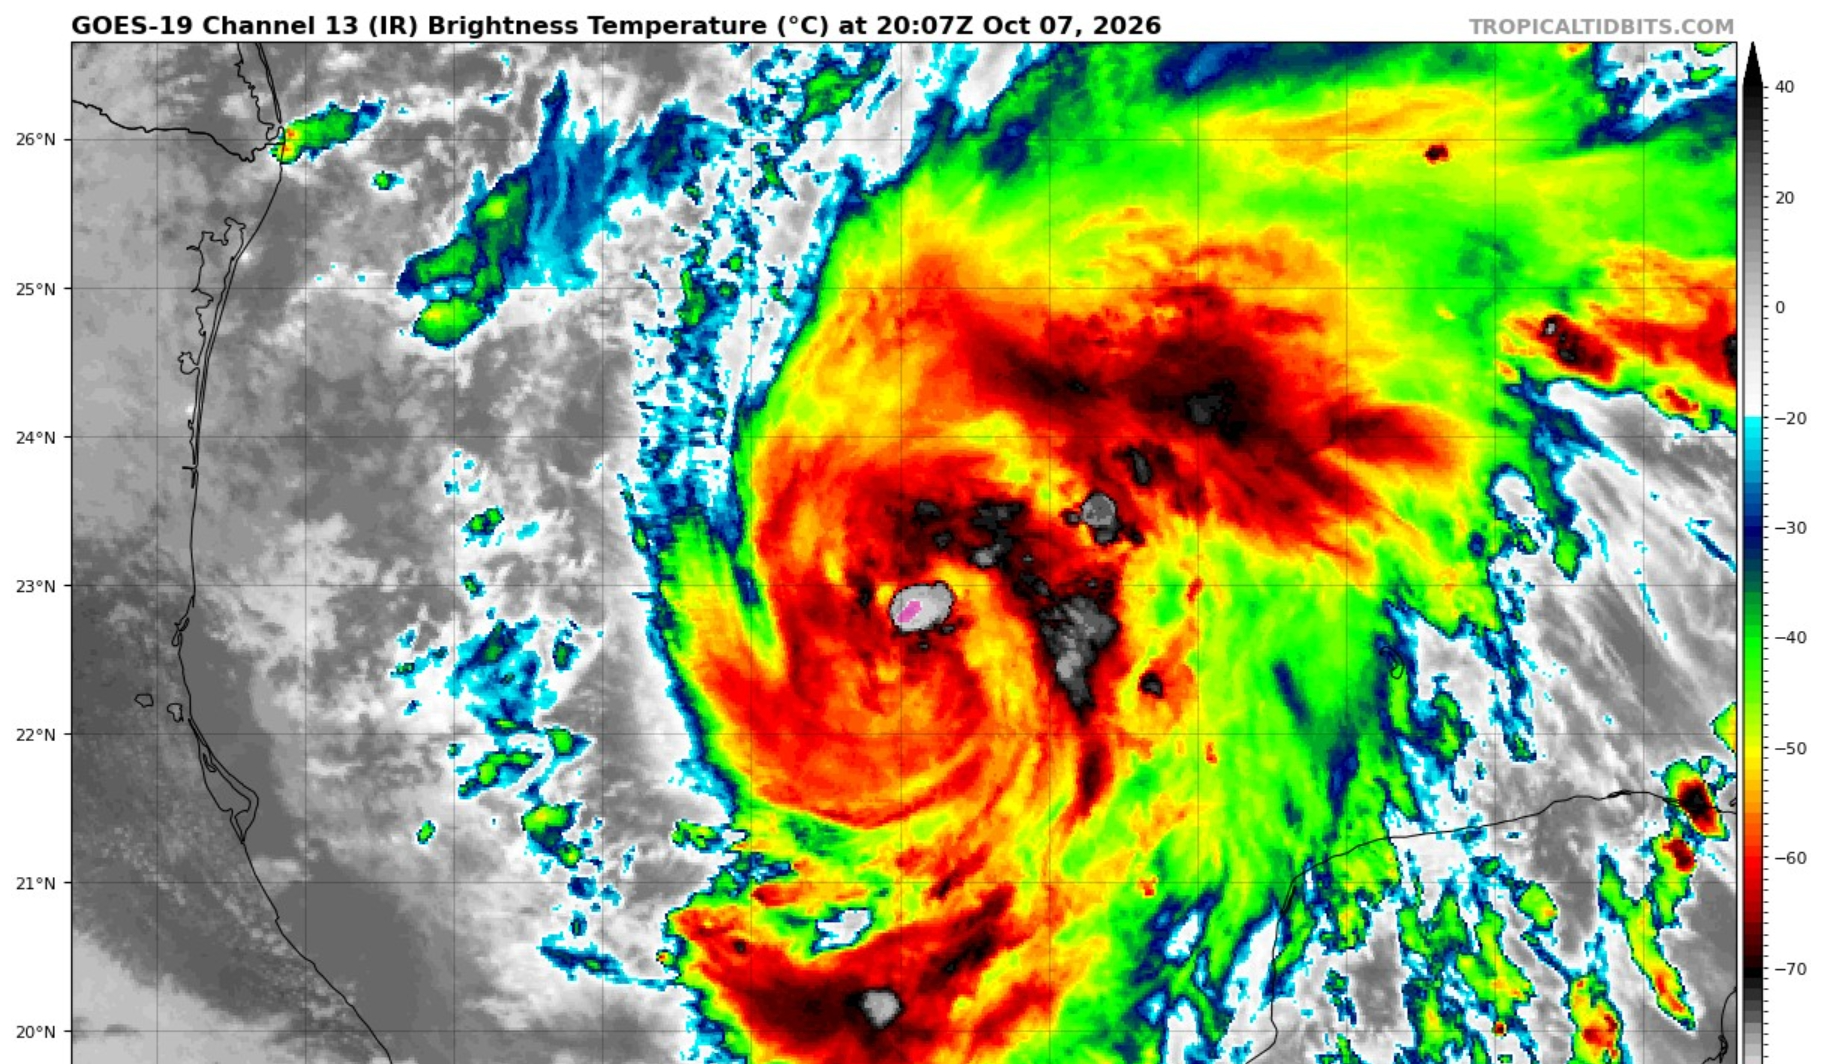
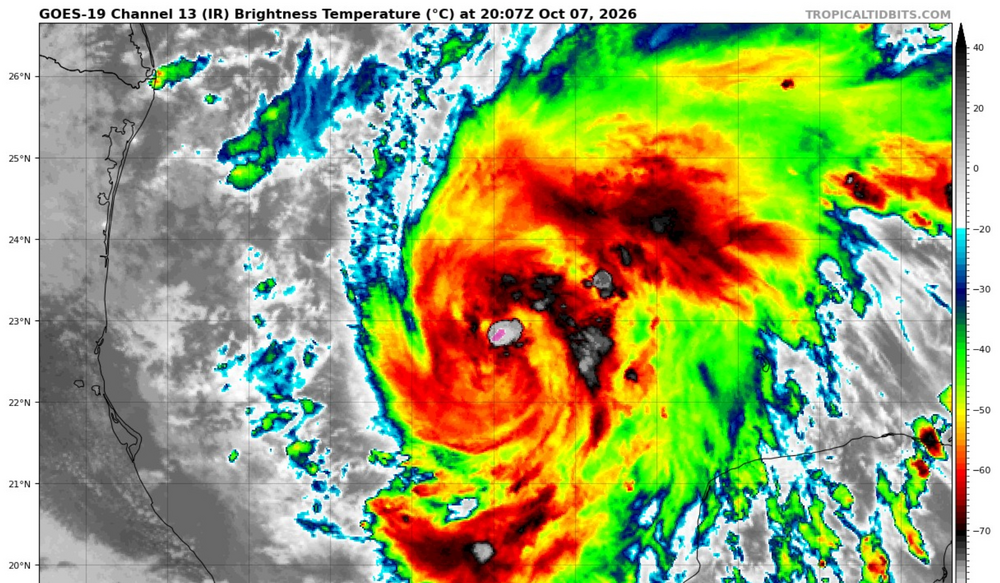
Large tower just went up over Isaias' center
-

2026-2027 Record-breaking El Nino
michsnowfreak replied to Stormchaserchuck1's topic in Weather Forecasting and Discussion
This is the actual anomaly map. -

2026-2027 Record-breaking El Nino
MJO812 replied to Stormchaserchuck1's topic in Weather Forecasting and Discussion
Colder in the east ? https://www.severe-weather.eu/long-range-2/winter-2026-2027-forecast-october-update-colder-snowier-shift-super-el-nino-polar-vortex-united-states-canada-europe-fa/ -

E PA/NJ/DE Autumn 2026 Obs/Discussion
Birds~69 replied to PhiEaglesfan712's topic in Philadelphia Region
Saw my first one today climbing up a tree and it was a big mother which made me wonder... 68F/DP 50F Sunny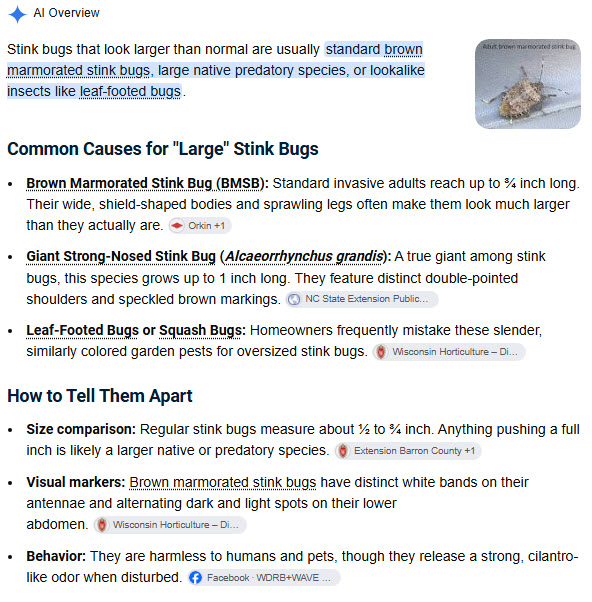
-
35.2° for the low here. No visible frost. Love the lack of bugs on these cold mornings
-
I will just drop this in here. Hopefully, I beat my .06 from last weekend. From the GSP AFD : There is some hint that heavier rain will set up along the coastal front, where better instability and frontogenesis will be. This could interrupt moisture transport, and help keep rainfall totals over the CAD wedge and the SELY upslope areas in check.
-
Watching the news. What’s up with the Os firing the Splash Dude and the Mascot??? lol
-
2026-2027 Fall/Winter Mountain Thread
Maggie Valley Steve replied to BlueRidgeFolklore's topic in Southeastern States
I'm not to concerned about a significant wind threat at this time as Isaias will likely have transitioned to Extra Tropical by the time it makes it to our latitude. Looks like less than an inch near the border and 1 to 3 inches along the Escarpment with a couple of isolated total of 4 to 6 inches in upslope areas. A weak cold front arrives Friday setting up CAD that actually could reduce rainfall amounts. The highest gusts I'm currently seeing are in to 30 to 35 range. I'll take a closer look in the morning for our local Region. -

2026-2027 Record-breaking El Nino
soadforecasterx replied to Stormchaserchuck1's topic in Weather Forecasting and Discussion
looks like it got removed all together -
 pharmacy order online: OmniRxDirect - trusted online pharmacy
 -
First freeze at Westhampton-dropped to 31.
-
Is it still a mistake if you correct it? https://youtu.be/MMHy_AJWwvY?si=sTO47o4uYd6UWfWH
-
makes sense, by the time we get to the "I" storm it's usually the heart of the season
-
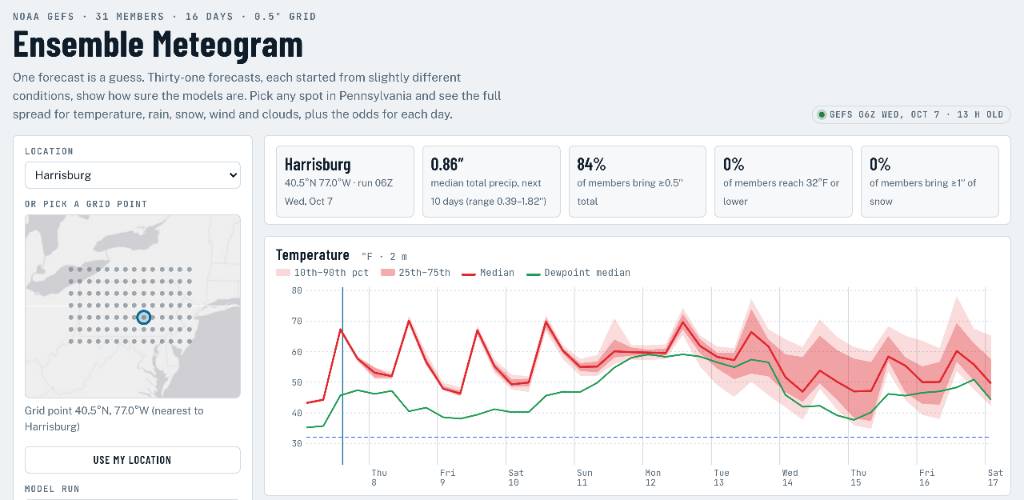
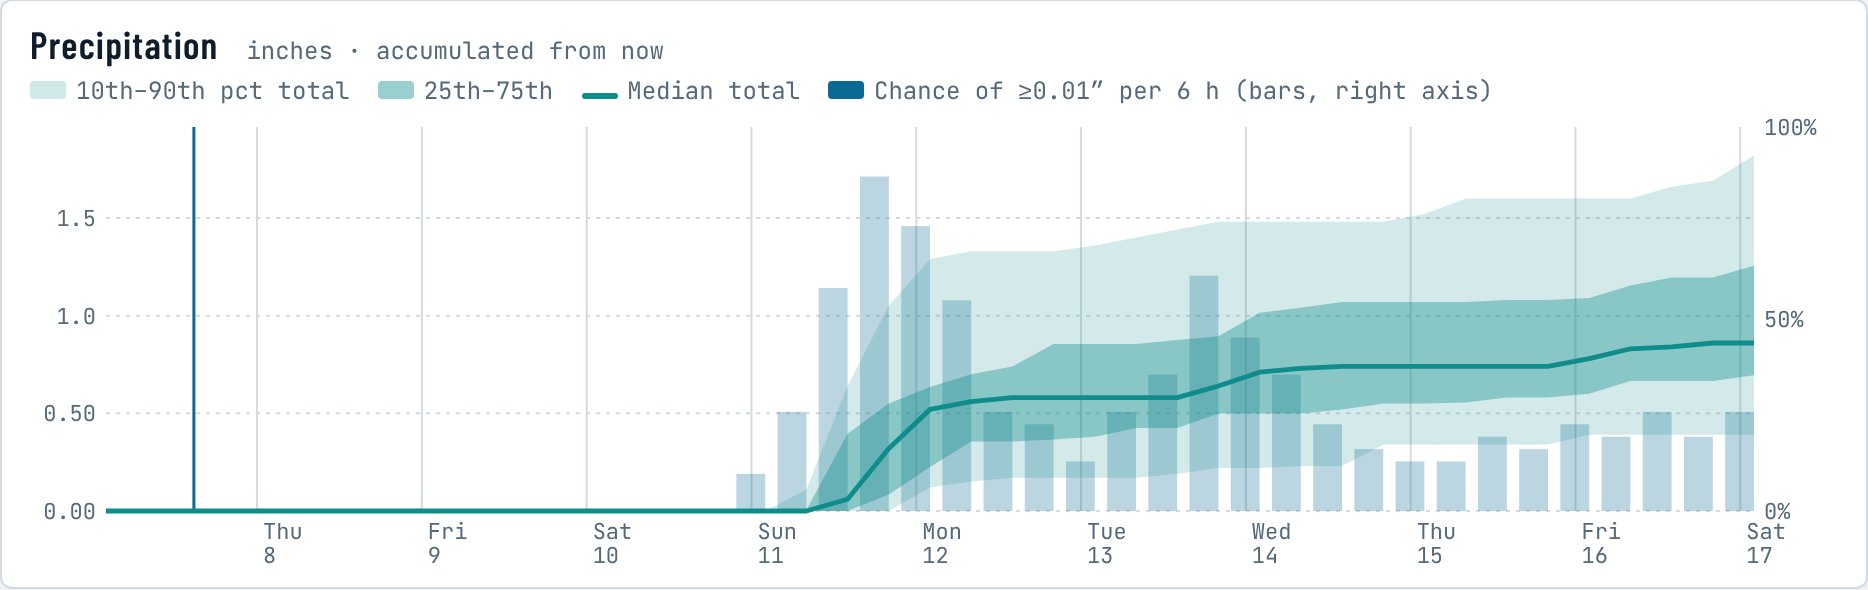
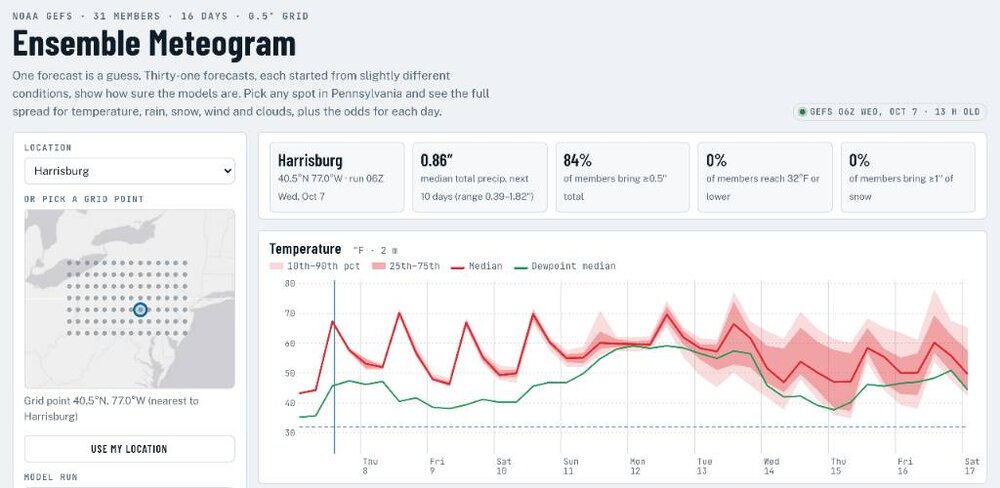
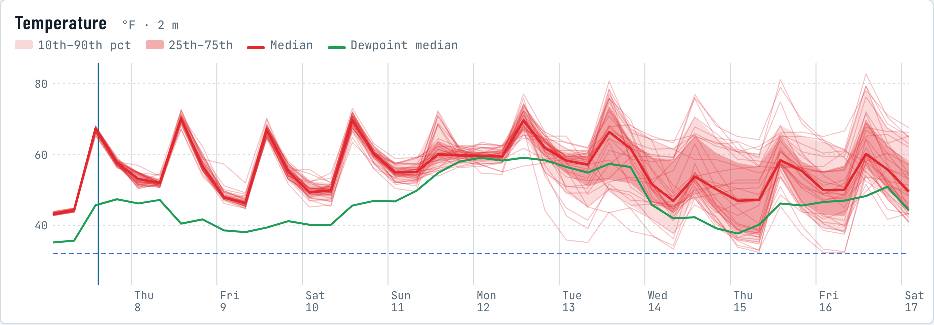
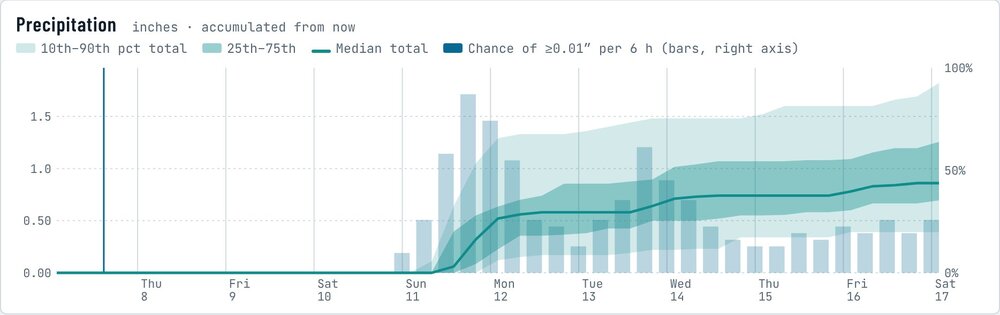
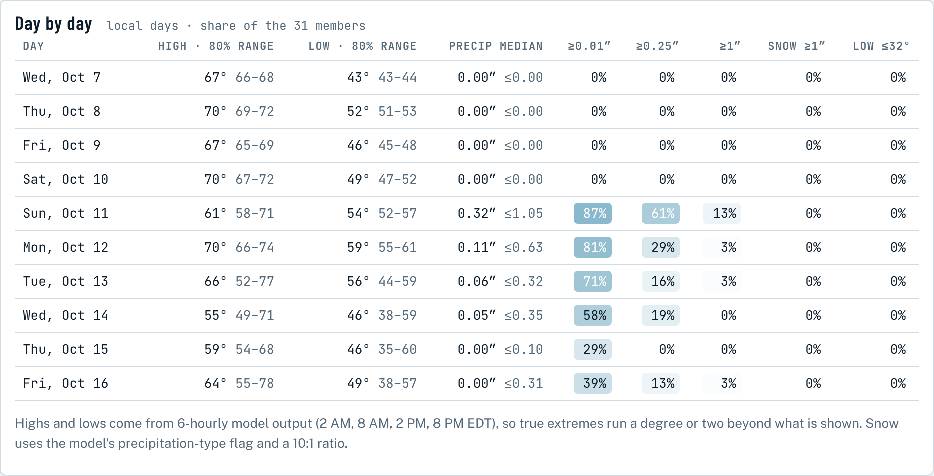
Tool Spotlight #1: The Ensemble Meteogram https://cpaweatherlab.com/tools/ensemble/ What it is. Most forecasts you see are a single answer: 68 and sunny, half an inch of rain. But that answer comes from one run of one model, and the atmosphere is chaotic enough that tiny errors in the starting conditions grow into big differences a few days out. NOAA handles this by running its Global Ensemble Forecast System (GEFS) 31 times, four times a day, each run starting from slightly different conditions. The Ensemble Meteogram takes all 31 of those forecasts for any spot in Pennsylvania and lays them side by side out to 16 days: temperature, rain, snow, wind, clouds and the overall pressure pattern, plus a day-by-day table of the odds. Instead of one guess, you see the whole range of what the models think could happen. How to use it. Pick a city from the Location menu, tap a dot on the little map, or hit "Use my location." The tiles across the top give you the headline numbers for that spot: the median rain total for the period, the chance of at least half an inch, the chance of a freeze and the chance of an inch of snow. Below that, each chart works the same way. The solid line is the median (the middle member), the darker band holds the middle half of the 31 members, and the lighter band holds 80 percent of them. Use the 7 / 10 / 16 day buttons to zoom in or out, and the Model Run menu if you want to look at an earlier run. The spread is the forecast. Check the "Show all 31 members" box and you'll see every individual forecast drawn as its own thin line. Look at this week for Harrisburg: through Saturday the lines are practically stacked on top of each other, which means the models agree and you can trust the numbers. Starting around Tuesday they fan out, with highs anywhere from the low 50s to the upper 70s on the same day. That isn't the tool being broken; that's the honest answer. When the lines fan out, any single-number forecast for that day is basically a coin flip. "Compare with previous run" helps here too: if the median keeps jumping from one run to the next, confidence should stay low even if the latest run looks tight. Rain odds you can actually read. The precipitation chart shows rain piling up over time, with blue bars for the chance of at least a hundredth of an inch in each 6-hour block. Right now it shows nothing through Saturday, then the bars jump on Sunday as the members agree rain is coming. The Day by Day table turns all of that into plain percentages, and they're simple member counts: Sunday's 87% chance of measurable rain means about 27 of the 31 members produce it, and the 61% for a quarter inch or more means about 19 of them do. Shaded cells make the wet days jump out, and the "80% range" next to each high and low tells you how wide the uncertainty is. Why it's worth your time, and a few caveats. Knowing the odds is more useful than a single number when you're planning anything outdoors, deciding whether to cover the garden, or watching for a storm a week out. It also teaches you to spot a shaky forecast before it busts. A few honest limits: each grid point is about 35 by 25 miles, so it won't capture your valley or ridge, and the NWS point forecast is still better for local detail. The GEFS also tends to be a bit overconfident, so real-world odds for extremes are a little wider than it shows. Highs and lows come from 6-hourly output and can miss the true extremes by a degree or two. Use it for timing and odds, and let it tell you how much to trust everything else you're reading. Give it a try and post what you find. Data: NOAA/NCEP GEFS v12, processed on the CPA Weather Lab server. Not an official forecast. Sent from my SM-S731U using Tapatalk
-
Just got home from work. 55° in the house. Windows open!
-

2026-2027 Fall/Winter Mountain Thread
Moonhowl replied to BlueRidgeFolklore's topic in Southeastern States
A bit different antecedent moisture conditions now than before the last tropical system that came this way to say the least. Scary dry IMBY, definitely want the rain but not the wind. -
So sorry to hear of the loss of your Mom, CG. Praying for peace for y'all during this most difficult of times. Lost my Mom 6 years ago and my Dad in 1998. Seems like forever some days and some days it seems like yesterday. Hang in there my friend.
- Today
-
2026 Atlantic Hurricane Season
Chinook replied to Stormchaserchuck1's topic in Tropical Headquarters
Here is a bit of a "banter" post