All Activity
- Past hour
-
always has been
-
Fire up the heat and fireplaces one more time!
-
It’s going to take a major volcanic eruption in order to see a short term return to something resembling cold winters. But these types of events have been lacking since Tambora. Would be an extremely disruptive event if it were to occur. https://bsky.app/profile/hausfath.bsky.social/post/3loqtpd5t6q2k Large volcanic eruptions have a major climate cooling effect. But the eruptions we've had in the past 170 years have been relatively mild compared to those in the more distant past. Here are climate model simulations of major eruptions since 1750 using FaIR:
-

2025-2026 ENSO
PhiEaglesfan712 replied to 40/70 Benchmark's topic in Weather Forecasting and Discussion
Now, here is the cold winters of the 1970s (1976-77, 1977-78, and 1978-79). Notice that, unlike 2013-14 and 2014-15, we don't have a warm west coast: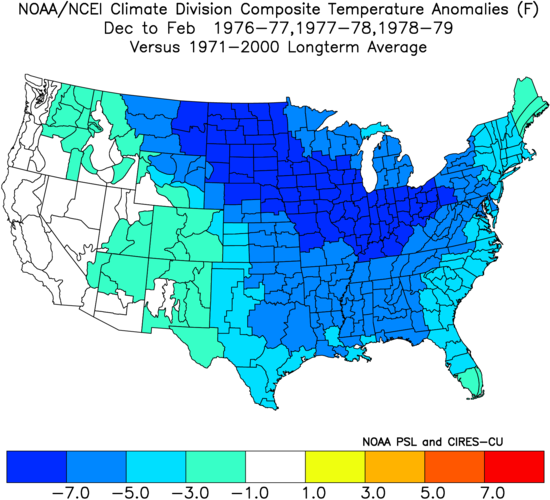
-
Oh! We don't have a site lined up out there just yet. When we do I will DM you. We've got a number of locations in the permitting and logistics pipeline, hoping to get them going this summer.
-

2025-2026 ENSO
michsnowfreak replied to 40/70 Benchmark's topic in Weather Forecasting and Discussion
Never underestimate the wild stuff he will post when you have a website like xmacis where you can literally plug in any data point to start/end at any given time, for any station. Even the most passionate CC posters know hes a joke. -
Wednesday and Thursday are basically going to feel like late March
-
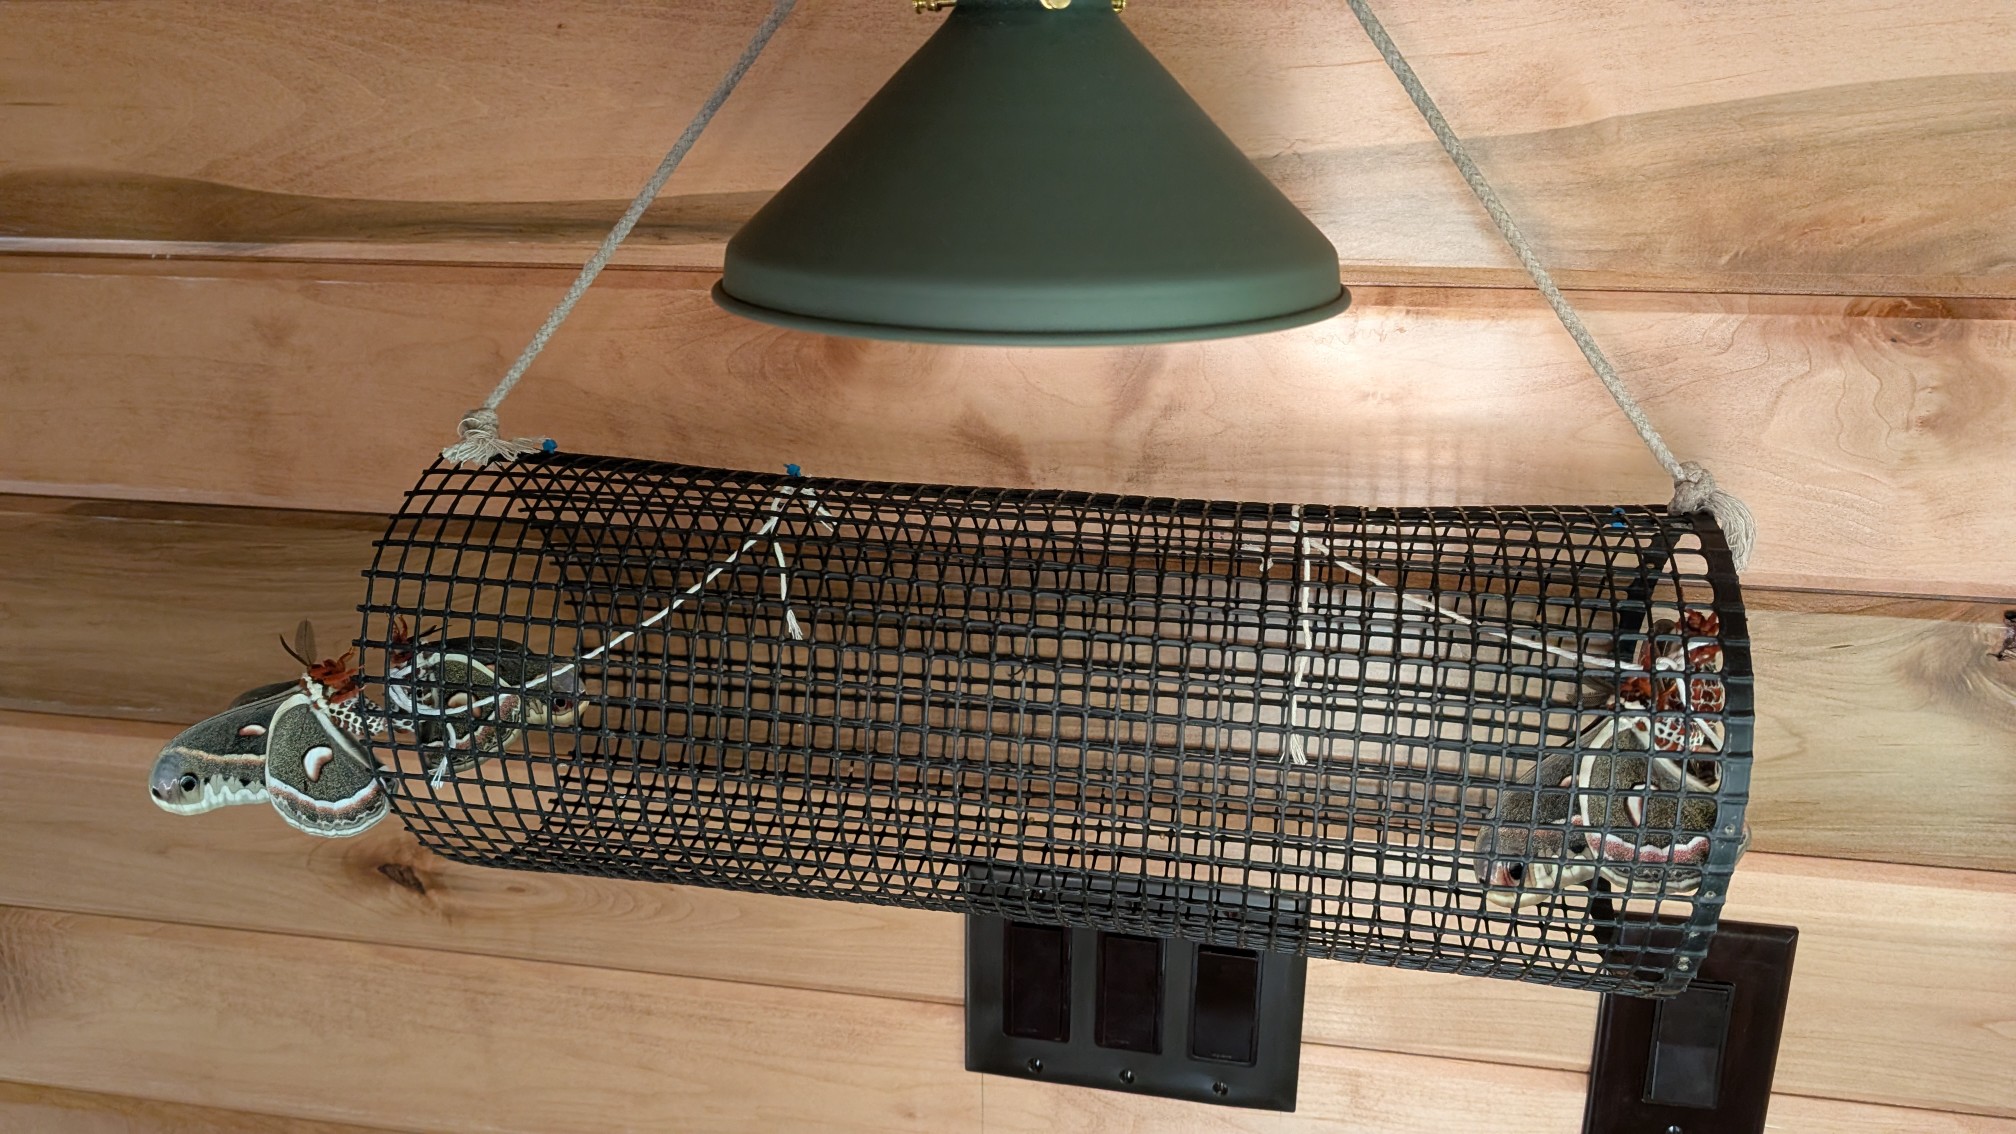
Low around 48F this morning at the cabin. Still windy with partly sunny skies. Didn't have much hope due to the weather but I tied out two female cecropia moths on my porch last night and actually pulled in a couple males.

-
Fantastic weather for outdoor activities!
-
2025-2026 ENSO
michsnowfreak replied to 40/70 Benchmark's topic in Weather Forecasting and Discussion
But as we all know, he has a one track agenda and its not swayed under any circumstances. Using a regression line is great for a long period of time, but for short periods its nothing more than cherry picking data points to support your agenda. Xmacis makes this super easy for him. Like I posted earlier, I can do the same thing by picking data points. What do you know, Detroits snowfall increased from the 30s to the 60s from 1996 to 2014 . Of course a regression line at Boston starting in 1990 will be down after the past several low winters which followed record snow in the 2010s. Its a completely pointless and errant argument from a troll. Remember, this latest posting spree of him talking to himself began with him telling bluewave that lowering coastal snowfall jives with his memory (even tho he doesnt live on the east coast) because he remembers "winters of his childhood (1990s) were WAY snowier". After which he was called out by showing that snowfall in Pittsburgh (nearest first order site to where he lives) was much higher in the 2010s than the 1990s.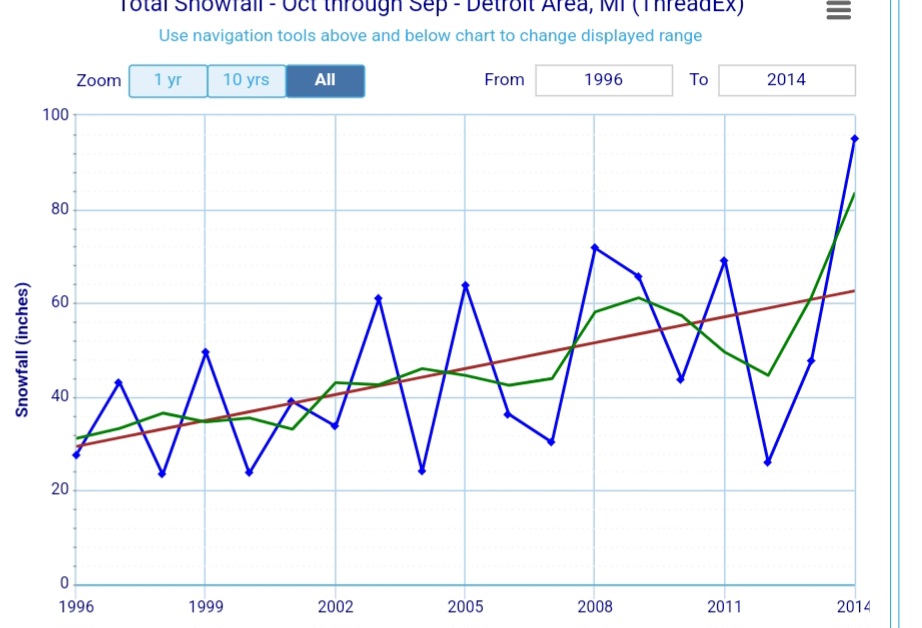
-
2025-2026 ENSO
PhiEaglesfan712 replied to 40/70 Benchmark's topic in Weather Forecasting and Discussion
A reminder, as cold as the winter of 2013-14 and 2014-15 was in the Eastern US, some areas in the West Coast, particularly California, recorded its two warmest winters during that time:
-
Imho to a higher tolerance this entire hemisphere/continental, ongoing pattern, is still quite structurally analogous to any in a day out of a January ... Just think of it as being 30 or 40 dm higher in heights and thickness. It is as though the pattern is absorbing the seasonal solar flux/change ... but it, in itself, is still very winter like and being forced to change due to that input - some how. That's what's been peculiar about this spring so far; the winter pattern isn't breaking down - same structure at a higher height registry. We're still getting above normal temperature days, too. And the "cold" ones are also doing that thing where they are cold more so relative to acclimation than they are cold relative to climatology, as well. This latter idiosyncrasy pretty much defined our temperature departure behavior during the last 9 months - here we are in May still doing that interpretive dance. All these idiosyncrasies are unusual. But they are unusual aspects that don't cause inconvenience enough for anyone to take notice. interesting. Another imo, but attribution is f*ing everything up like this... more often than not, it's sort of 'hidden' beneath the radar of everyday experience. But it's always there... lurking ... in wait to send Hethrow to 109 F, or fire off another 30 'Cane season ... or green up the Sahara (which is happening btw - ). There's a tendency - I suspect - for people to think that the eye-pop events are attributable and then it stops there. But that really an observation-inconvenience bias making that judgement. Just a Monday morning QB thought -
-
I tought the same....feels like October...only reason you can tell it isn't is the Sox are playing today.
-
Yep this is about the best weather we can get. So green. I hope we can rinse and repeat this pattern in June, July and August.
-
Especially as a man. Nothing worse then wearing a suit/tux in the heat. Congrats. Looking good for Sunday!
-
Just short in LGA and NYC but notable is the 2002 chill EWR: Hi / Low (rainfall) 5/18: 56 / 44 (1.51) 5/19: 60 / 39 5/20: 59 / 41 5/21: 63/ 43 5/22: 69 / 44
-
Death, taxes, Brad Marchard owning the Leafs in the playoffs.
-

Central PA Spring 2025
Mount Joy Snowman replied to canderson's topic in Upstate New York/Pennsylvania
Low of 54 and yesterday was my first day without measurable precip since May 11th. -
Legit fall feel this morning. Cloudy, breezy, sprinkles, u40s.
-
Much / most of this is Wed - Sat with around 1 - 1.5 with more in W(PA) and Eastern areas from the coastal
-
Records: Highs: EWR: 98 (1962) NYC: 99 (1962) LGA: 96 (2017) JFK: 92 (2017) Lows; EWR: 39 (2002) NYC: 38 (1976) LGA: 43 (1976) JFK: 42 (2002) Historical: 1780 - The infamous "dark day" in New England tradition. At noon it was nearly as dark as night. Chickens went to roost, and many persons were fearful of divine wrath. The phenomena was caused by forest fires to the west of New England. (David Ludlum) 1915: A spring storm came to an end after producing widespread snow. Total snowfall from the storm included: 17.6 inches in Scottsbluff, NE, 8 inches at Cheyenne, WY and 7 inches at Chadron, NE. 1955 - Lake Maloya NM received 11.28 inches of rain in 24 hours to establish a state record. (The Weather Channel) 1962: A heat wave gripped the East Coast with high temperatures reaching 99° at New York City, 98° at Baltimore, MD and 96° at Philadelphia, PA (all either broke or tied records for the month of May.). Other daily records included: Greenville-Spartanburg, SC: 99°, Newark, NJ: 98°, Concord, NH: 97°, Allentown, PA: 97°, Richmond, VA: 97°, Athens, GA: 97°, Columbus, GA: 97°, Philadelphia, PA: 96°, Atlantic City, NJ: 96°, Roanoke, VA: 96°, LaGuardia, NY: 95°, Harrisburg, PA: 95°, Wilmington, DE: 95°, Charlotte, NC: 95°, Raleigh, NC: 95°, Nashville, TN: 95°, Hartford, CT: 94°, Lynchburg, VA: 93 °F. 1975 - Thunderstorms produced golf ball size hail and wind gusts to 110 mph in Minnesota, between Fridley and Hugo. Fifty persons were injured. The hail and high winds destroyed fifty mobile homes, and a dozen aircraft, and also destroyed a third of the Brighton Elementary School. (The Weather Channel) 1977: Over a 9 day period, this was the fourth day of a terrible heat in the Chicago, IL area. Over the 9 day period, the daily high temperature was 90° or higher setting eight high temperature records. The monthly average for those 9 days was 69.3° or about 20 degrees above normal. 1987 - Thunderstorms in Texas produced thirteen inches of rain northwest of Lavernia. The heavy rain, along with golf ball size hail, destroyed eighty percent of the crops in the area, while high winds toppled trees. Golf ball size hail was also reported south of Dallas and around San Antonio. Up to eight inches of rain drenched Guadelupe County. (The National Weather Summary) (Storm Data) 1988 - Severe thunderstorms in southwest Texas produced hail as large as tennis balls around Midland, with the hail accumulating up to a foot deep. Showers and thunderstorms in the Middle Atlantic Coast Region produced 3.5 inches of rain near Schuylkill PA. (The National Weather Summary) (Storm Data) 1989 - Thunderstorms developing ahead of a cold front spawned ten tornadoes from Illinois to Tennessee during the afternoon and night. Snow, wind and cold prevailed in the Northern Plateau Region and the Northern Rockies. Dixie, ID, was blanketed with nine inches of snow, winds gusted to 87 mph at Choteau MT, and the temperature at Crater Lake, OR, dipped to 11 degrees. (Storm Data) (The National Weather Summary) 1990 - Thunderstorms deluged Hot Springs AR with thirteen inches of rain in nine hours resulting in a devastating flood. Two waves of water, four to six feet deep, swept down Central Avenue flooding stores and the famous bathhouses on Bathhouse Row. Water released from Lake Hamilton devastated the area between it and Remmel Dam. The 500 foot Carpenter Dam Bridge across Lake Catherine was completely washed away, as were cabins and mobile homes near the lake, many of which flowed right over the top of Remmel Dam. (The National Weather Summary) (Storm Data)
-

2025 Lawns & Gardens Thread. Making Lawns Great Again
Brewbeer replied to Damage In Tolland's topic in New England
No mow May is transitioning into no install June -
Another unreal gorgeous morning. 10/10.
-
62 / 45 breezy. 36 more hours of dry weather. Low 70s today and Tuesday , some warmer spots could touc 75 today. Trough cuts off below the ridge Wed - Sat with low developing Thu/Fri with rain, cool (50s-40s) ENE/NE flow - 1.00 - 2.00 inches of rain between Wed - Sat (AM). Saturday salvageable after the morning - but cool and proably not clearing till later in the afternoon W-NE. Sunday and Monday looking similar to today with dry , mostly sunny, breezy and temps near normal (70s). Trough stingy into the Northeast to close the month. Warmer air grows out of the rockies and towards the first week of next month into the area, nothing likely sustained but near to above normal.
-
Your 100% right on that!